How can we help you?
- How can I pay?
You can pay with your Visa, Maestro, MasterCard, Discover/Novus, Diners Club and American Express card or use PayPal. To process credit card payments we use Stripe.
- What is the refund policy?
You may terminate your subscription to the Upgrade at any time and you will not be obligated to pay any additional fees for upcoming subscription renewal periods. However, any subscription fees you have paid in advance will not be refunded unless there has been 10 days or less since the payment. For payments made in the last 10 days or less, only those payments are refundable.
- Can I buy extra SMS and voice calls (for the free plan)?
Yes, you can buy SMS (or voice calls) credits for both paid and free plan here.
SMS / voice call alerts prices
Amount Price 100 messages/call $15.00/one-time 200 messages/calls $25.00/one-time 500 messages/calls $55.00/one-time 1000 messages/calls $100.00/one-time SMS and voice calls are added to the account only once (they don't renew) and more messages/calls can be purchased anytime.
If paying by credit card, you can enable your credits to automatically refill before running out.
A notification is sent when a few messages/calls are left.
Note: Confirmation SMS for adding/changing alert contact will also consume credit(s).
Credit consumption details
- SMS Credit consumption per country
Country Credit consumption Russia 5 Algeria 2 Azerbaijan 2 Bangladesh 2 Belarus 2 Belgium 2 Bulgaria 2 Cambodia 2 Cayman Islands 2 Curaao 2 Denmark 2 Egypt 2 Ethiopia 2 Finland 2 Germany 2 Indonesia 2 Israel 2 Japan 2 Jordan 2 Madagascar 2 Mauritius 2 Nepal 2 Netherlands 2 Netherlands Antilles 2 New Caledonia 2 New Zealand 2 Nigeria 2 Pakistan 2 Panama 2 Philippines 2 Sri Lanka 2 Trinidad and Tobago 2 Tunisia 2 All other countries 1 - Voice call Credit consumption per country
Country Credit consumption All countries 2
- SMS Credit consumption per country
- How to cancel a subscription?
Log in to your account and go to
My Settings > Account profile > Plan > Manage subscription > Cancel subscription.You will need to verify a captcha and enter an approval text to confirm the action.
![Screenshot of Auto renewal cancel process]()
- How can I download my invoices?
Find all your invoices in your account under
My Settings > Account Profile > Payment History. - My credit card is not working
Please, contact your bank first to see if there are any issues with the payment and let us know.
- How do I update my credit card information?
To change the credit card details, please log in to your
Account's settings > Manage subscription > Change credit card used. You will be redirected to our payment processor’s page.Stripe payment option
- Choose Add payment method
![Screenshot of Stripe Add payment method]()
- Keep Use as default payment method option checked
![Screenshot of Stripe default payment method option]()
- Click on Add and your credit card is updated!
2checkout payment option
With the first visit, you need to create an account. For that use the order number you received in the order confirmation email from 2CheckOut and your email address used in the ordering process.
![Screenshot of loging to 2CheckOut]()
- Follow the instructions and set up your password.
![Screenshot of setting up a password in 2CheckOut]()
- After you log in, go to
My Productsand click onUpdate credit card info.![Screenshot of navigation in 2CheckOut]()
- Enter your card details and click on “Add credit card info”. Now you’re all set!
![Screenshot of Entering a new credit card on 2checkout]()
- You can also change your credit card details or remove the card from the “Payment Methods” page.
![Screenshot of changing credit cards details]()
- Choose Add payment method


- How do I create a monitor?
After you login to your account at UptimeRobot.com, click on the “+ Add New Monitor” on the left side.
You can choose from multiple options of monitor types:
- HTTP(s)
- Keyword
- Ping
- Port
- Heartbeat
Creating a monitor is as simple as adding a URL or IP address.
For the Keyword Monitor you need to add a specific keyword that should be (or not) present on your website. Set the “Alert When” option to “Keyword Exists” to be notified when, for example, keyword “Error” is present.
You can also choose the “Keyword Not Exists” option and enter a keyword available on your website when it’s online and functional.
For the Ping Monitor you need only the correct IP (or Host). Additionally, for the Port Monitor, you can set a URL and port, too.
For the Heartbeat Monitor enter a Friendly Name and click on “Create Monitor”. After, click on the Settings button and “Edit”. Take a look at the screenshot.
![Screenshot]()
Here you will find the address to which you can send your requests. If we don’t receive one, your heartbeat monitor will become “DOWN”.
For the Heartbeat Monitor enter a Friendly Name and click on “Create Monitor”. After, click on the Settings button and “Edit”. Take a look at the screenshot.
![Screenshot]()
How to send regular HTTP requests in Unix/Linux and Windows?
For the Heartbeat Monitor enter a Friendly Name and click on “Create Monitor”. After, click on the Settings button and “Edit”. Take a look at the screenshot.
If you are on a Pro Plan, you will have Optional Advanced Settings available for your HTTP and Keyword Monitors:
HTTP Method:
Choose from HEAD, GET or POST (GET or POST for Keyword Monitor) or PUT, PATCH, DELETE, or OPTIONS.
Authentication Settings:
HTTP Basic or Digest Authentication Types are available.
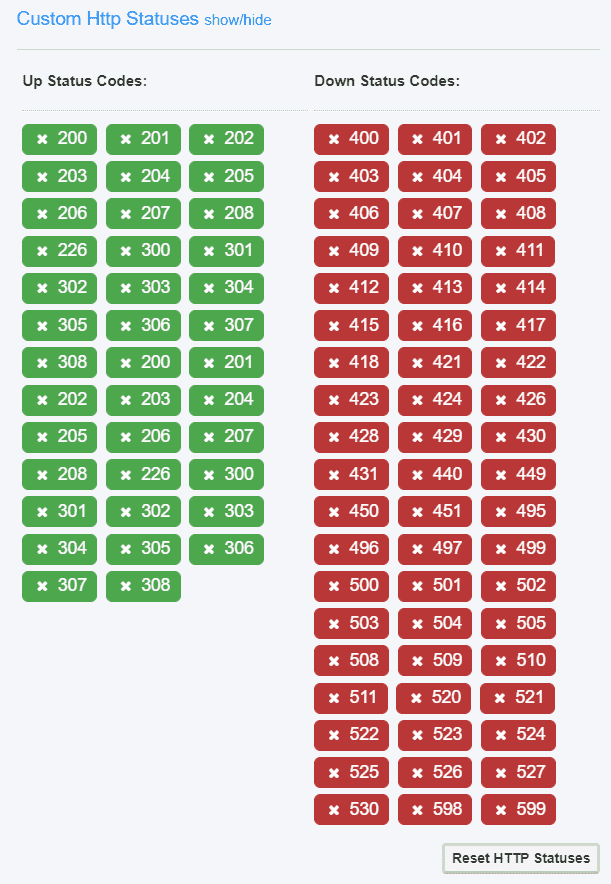
Custom HTTP(s) Statuses:
Edit your UP and DOWN status codes as you wish.
![Screenshot of statuses]()
Custom Headers:
Add multiple Custom Headers - their Name and Value.
SSL Settings:
Here you can ignore SSL errors or Disable SSL expiry reminders.
- What is a heartbeat monitor?
It works in an opposite way compared to other monitoring types. Heartbeat Monitor is the best solution to monitor endpoints inside an intranet (but connected to the internet). It’s also suitable for regular/cron jobs your website/app may be performing.
We will provide a unique URL for each heartbeat monitor to which your device/server/computer will be sending requests. Once it doesn’t arrive, you will receive a downtime alert.
Read further: How to send regular HTTP requests in Unix/Linux and Windows?
- My monitor is not working
There could be more reasons for it. You should be able to find details like timestamp and reason along with duration in your Dashboard under each monitor.
If the monitor is grey and showing “No Data”...
...after an hour since you created it, please, contact our support team.
If the monitor is down and you didn’t receive any notifications...
...please make sure your alert contact is attached to the monitor. Click on the Settings button next to your monitor on the left side and then “edit”.
![Screenshot]()
Here on the right side you can find all your alert contacts where you can add them.
![Screenshot]()
- How can I debug a down monitor?
Firstly, please, make sure all our IPs are whitelisted on your end and by your provider. They can be all found here.
If there are still any issues, you can try removing the monitor and creating it again. This will change the IP address of your monitor.
If there’s a “Connection Timeout”, take a look at the Response Times graph and see if there are some longer responses. The monitor will be marked as down after 45 seconds of not being able to reach your URL.
My glitch.me/com, Heroku, or similar monitor is not working Glitch.me, for example, is preventing ping services from reaching their servers and keeping their apps awake.
You can find more details here.
- What is your user agent?
The user agent we use is: Mozilla/5.0+(compatible; UptimeRobot/2.0; http://www.uptimerobot.com/)|
- Can I bypass the cache?
Yes, you can use our cachebuster feature, please take a look at this article.
- Is there a bulk feature available to edit the monitors?
The “Bulk Actions” feature is a bit hidden, true (we're already working on a redesign, don’t worry). You can pause, start, reset or delete your monitors, change intervals, alert contacts and SSL settings, or add a maintenance window.
![Screenshot]()
You can also change the notification settings for your attached alert contacts to be notified every “xy minutes if down for xy minutes”. This is a Pro Plan feature.
![Screenshot]()
- Does UptimeRobot auto start the monitor whenever it is down?
The monitor is still active when it’s down and checking if the service is back up.
- Where are the monitoring locations and what are their IPs?
To get a full list of our IPs, please, follow this article.
- Do I need to whitelist UptimeRobot on my server? How?
In some special cases you have to give an access to the monitored location manually. It depends on server or software you are using. If you need to whitelist UptimeRobot, here are the IPs.
- What are the differences between monitor types?
Here are short details about monitor types:
- http(s): it's perfect for website monitoring. The service regularly sends requests (which are the same as if a visitor is browsing your website) to the URL and decides if it is up or down depending on the HTTP statuses returned from the website (200-success, 404-not found, etc.)
- ping: this is good for monitoring a server. Ping (ICMP) requests are sent and up/down status is decided according to the "if responses are received or not". Ping is not a good fit for monitoring websites as a website (its IP) can respond to ping requests while it is down (which means that the site is down but the server hosting the site is up)
- port: good for monitoring services like SMTP, DNS, POP as all these services run from a specific port and UptimeRobot decides their statuses if they respond to the requests or not
- keyword: checks if a keyword exists or not exists in a web page
- cron-job (heartbeat): good for servers/computers/devices that are inside an intranet (but connected to the Internet) and need to be monitored. The feature works in the opposite way compared to other monitoring types. UptimeRobot provides a unique URL for each heartbeat monitor created and expects the monitored item to send regular requests to this URL. Once a regular request doesn’t arrive on time, the monitor is marked as down
- I am monitoring a file availability, but the monitor status is “down”. Why?
The limit for the file size is 8 MB. If it’s bigger, we recommend setting the HTTP method to HEAD. You will find it under the “Advanced settings” when editing a monitor.
- How long does it take before I get a ConnectionTimeout?
We’ll let you know if there’s no response in 1 – 60 seconds, according to your settings, so you can improve the very important speed of your website.
![Screenshot]()
- I am just wondering if there is a way to group monitors?
Unfortunately, this feature is not available at the moment, but it’s already on the feature requests list.
- How do you detect downtime?
- UptimeRobot sends HTTP requests every x minutes from its main engine (US-Dallas)
- If no response is received, another request is sent from the same location (in case the previous one was just a hiccup)
- If no response is received again, it sends 2 other requests in parallel from 2 random and remote locations (the list of locations can be found here)
- If these 2 remote requests fail to get a response too, then the monitor is marked as down and notifications are triggered
- Or, if the monitor returns an erroneous HTTP status, it is instantly marked as down without verification (as the status is returned from the monitor itself)
- And, once a monitor is down, UptimeRobot keeps sending requests every 1 min (no matter the default monitor interval) for faster uptime recovery, only from the main location
- So, in case of a 30 min downtime (except HTTP-status-based downtimes), the monitor needs to:
- fail to respond twice from the main engine
- fail to respond from 2 remote locations
- and must have failed to respond at least 20-25 times in a row from the main location (as the requests are sent only from the main location once the monitor is down)
There are some rare/edge scenarios like:
- our requests/IPs may have been temporarily blocked by a firewall
- there may have been a problematic hop between UptimeRobot's servers and monitor's server. And, if all the requests UptimeRobot has sent passed from that problematic hop at some point, the requests may have failed and UptimeRobot would think that the site didn't respond. This is the main reason we send "verification requests" from multiple locations to minimize this risk and it is very very low
- both of these scenarios have a very low possibility, yet, still wanted to share.. just in case
For the Pro Plan, it is possible to:
- get a “DOWN” notification only if the monitor is down for x minutes
- and, optionally, keep getting the “DOWN” notifications every y minutes
Simply, you may configure your settings like “if down for x minutes alert once” or “if down for x minutes, alert every y minutes“. Please check our related blog post for details.
- Someone redirected my website to another one, is it possible to detect this?
Actually, you can use the Keyword monitor which is available for the Free-Plan as well.
Keyword Monitor is searching for the keyword you entered but that's not all of that, for there is a condition you must select too.
- Keyword Exists
- Keyword Not Exists
Based on the condition you select the Keyword Monitor will decide if the monitor will be “DOWN” or “UP”.
If the condition you selected becomes true, the monitor will show “DOWN” and notify you, if not, the monitor will keep showing “UP” and no alert notification fired.
For example: If you choose the condition Keyword Exists then the monitor will turn “DOWN” if it finds the Keyword on the page and will notify you.
- How do we go about viewing logs after we hit the "reset" button on the dashboard for a URL that we are monitoring?
Unfortunately, if you clicked on the “Reset States” all logs for this monitor will be erased and there is no way to return them back.
- We have a website we've set up so it’s only accessible in the USA. Is it possible to lock in the check so even secondary requests come from servers in the USA?
Unfortunately, this feature is not available at the moment.
- If I set your service to monitor a webpage that is under Cloudflare always online caching, will it detect downtime?
If Cloudflare returns an HTTP error code, we'll consider it as down otherwise it'll be considered as up. The server IP address can be also monitored directly.


- I didn’t receive any notification
If your monitor status changed and you didn’t receive a notification, make sure you have attached the alert contact to your monitor. Click on the Settings button next to your monitor on the left side and then “edit”.
![Screenshot]()
Here on the right side you can find all your alert contacts where you can add them.
![Screenshot]()
- Can I be notified after a certain time of a downtime?
In the Pro Plan you can find “advanced options” under your alert contacts and set the notification to be sent after “xy minutes” “if down for xy minutes”. This is a Pro Plan feature.
![Screenshot]()
- How to create a Slack App alert contact?
After you log in to your account, click on your email in the upper right corner and "My Settings".
Click on the “Add Alert Contact” (or "Add Integration") in your and choose Slack Alert Contact Type.
![Screenshot]()
Enter the Friendly Name of your contact and your Slack Webhook URL. You can find the link to where it can be created in the blue windows below. You will be redirected to the app to create the webhook.
Custom value would add a specific text to each notification you receive on Slack.
- How to add Pagerduty integration?
After you log in to your account, click on your email in the upper right corner and "My Settings".
Click on the “Add Integration” (or "Add Alert Contact") and choose Pagerduty Alert Contact Type.
![Screenshot]()
Enter the Friendly Name of your contact and your Pagerduty URL (Integration Key). To get this from Pagerduty please follow the Generate a New Integration Key instructions.
- When will I be notified about the SSL expiration date?
You will receive a notification 30 days in advance, in case of Let’s Encrypt certificate it’s 3 days before the expiration date.
- How can I test notifications?
You can test your notification setup for each specific monitor through the Test notification setup button.
You’re able to double-check if the alert contacts are attached to the monitor, so you can make sure everything is working and test how both UP and DOWN notifications will behave.
![Screenshot]()


- How do I set up a public status page?
Public status page is a free feature available for all. Find the option to “Add Public Status Page” in your Dashboard after you log in at UptimeRobot.com.
![Screenshot]()
You can choose if you want to show all or specific monitors, enter the name of your status page, add your own logo or set a custom domain (status.yourwebsite.com). Don’t forget to set the CNAME DNS record to stats.uptimerobot.com in that case.
You can make your status page private, too. Just enter a password.
Note: If you are using Cloudflare and a Custom Domain, take a look at this article.
- Public status page is not working
If you are using Cloudflare, please take a look at this article.
If you are using a custom domain, make sure you create a CNAME DNS record for your domain to stats.uptimerobot.com. It can take up to 30 mins for the custom domain to be activated.

- Why is UptimeRobot free?
That's a good question. UptimeRobot is launched in January 2010 and it is totally free since then.
It all started with the desire to create a useful and available tool for the web community. After some time, the service grew so much, we spent lots of hours improving it and learned a lot.
Update 13 Jan 2015: We have introduced a Pro Plan today. And, the Free Plan is still here to stay :)
- Are my website stats affected?
No, they are not. Most analytics services (like Google Analytics) use JavaScript to collect data and UptimeRobot's requests don't trigger JavaScript.
For non-JavaScript trackers, excluding UptimeRobot's IPs will help.