Bring UptimeRobot data into your AI workflows.
Use MCP to list, create and update monitors, investigate incidents, and view integrations directly in agent workflows, no local server required.
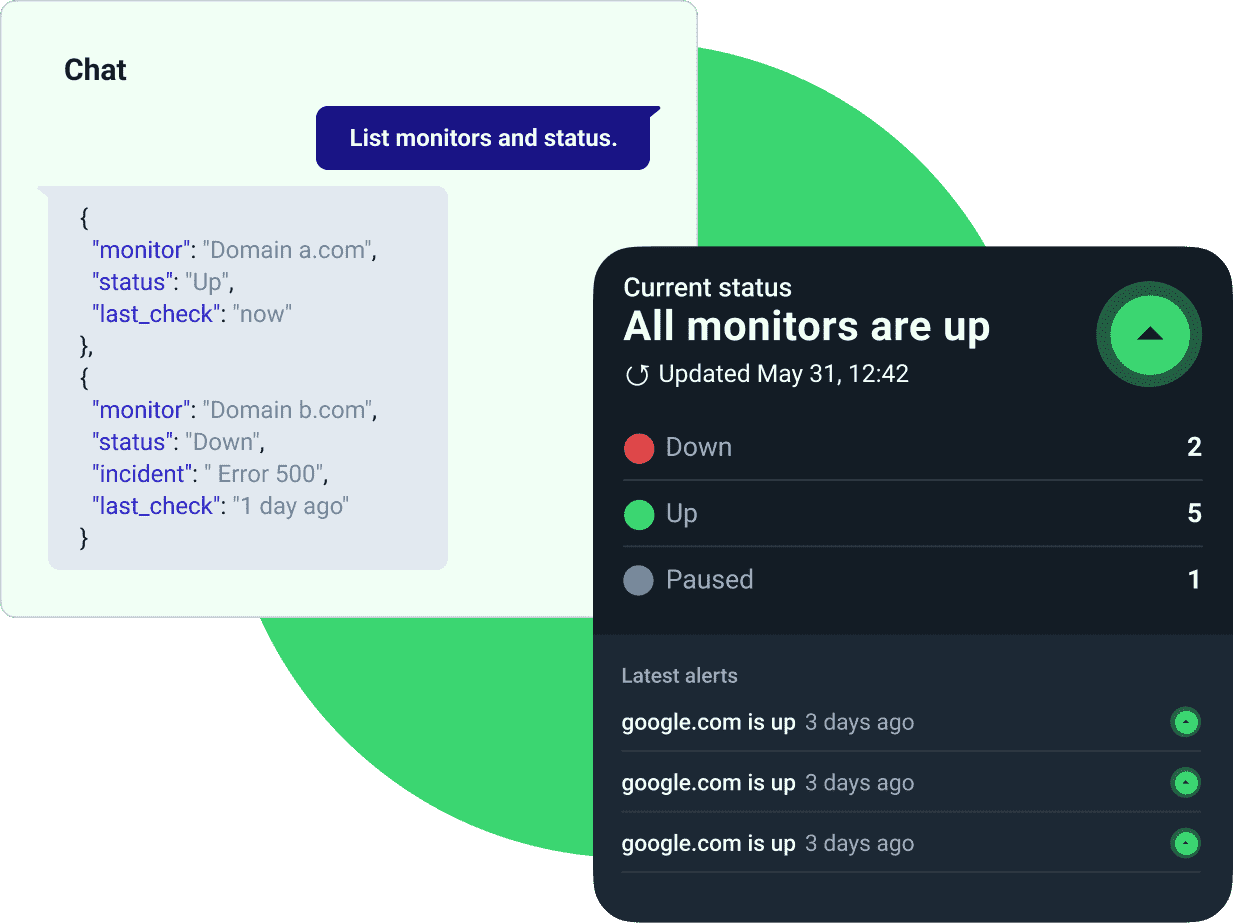
Get live monitoring context in your AI tools.

List monitors and their current state
Surface which checks are up, down, or paused directly in your agent as you investigate issues.

Pull recent incidents per monitor
Pull recent incidents for any monitor to understand timing and impact fast.

See connected notification integrations
Know who gets alerted with an overview of connected notification channels.

Hosted connection with your API token
Connect to UptimeRobot’s hosted MCP endpoint using your API token without running a local server.

Agent-friendly, structured outputs
Structured responses that are easy for AI tools to parse and act on.

See uptime and health at a glance
Ask your agent for uptime percentages, incident counts, and status breakdowns for a single monitor or across your account.

Analyze response times over time
Pull 1h–90d response-time series with min, max, average, and p95 stats ready for your agent to graph, alert, or compare.

Drill into incident details
Expose full incident timelines, error codes, request logs, checker locations, and traceroutes (when available) from inside your AI workflow.
Connect to the hosted UptimeRobot MCP in minutes.
                     "uptimerobot": {
                         "command": "npx",
                         "args": [
                             "mcp-remote",
                             "https://mcp.uptimerobot.com/mcp",
                             "--header",
                             "Authorization: Bearer ", // Enter your API token here.
                             "--header",
                             "X-MCP-Content-Format: true"
                         ],
                         "env": {
                             "UPTIMEROBOT_API_TOKEN": "" // Enter your API token here.
                         }
                         },
                         ...
1 Get your UptimeRobot API key
Create or locate your API key in your UptimeRobot dashboard (Integrations & API tab in the left sidebar). Use your Main API key for full read/write access, or a read-only key if you only want MCP to read data.
2 Add the hosted MCP endpoint to your client
Paste the provided config snippet into your MCP client settings and replace <your-uptimerobot-api-token> with your token.
3 Restart your MCP client
Save and restart your MCP client so it can discover the tools.
4 Start querying
Use natural language to list and manage monitors, get uptime and response-time insights, investigate incidents, and see connected integrations.
Note: Keep your token private. Do not commit it to source control.
Start using UptimeRobot MCP today
Connect in minutes and bring live monitoring context into your AI workflows.
More MCP features.

Monitor control (write actions): Pause, resume, update, and create monitors (HTTP, Keyword, Ping, Port, Heartbeat, DNS).
Deep incident context: Incident timelines, error codes, request logs with timestamps and regions, checker locations, and traceroutes (when available).
Incident request logs: Inspect per-incident request logs with timestamps, regions, and error details.
Response-time analytics: Time-bucketed series with min, max, average, and p95 percentiles over 1h–90d windows.
Monitor health stats: Up/down/paused counts and uptime percentages over a selected window.
Contacts and tags on create/update: Assign alert contacts and tags when creating or updating monitors.
Frequently asked questions.
What can I do with MCP today?
List and manage monitors (including creating and pausing/resuming them), get uptime and response-time insights, pull recent incidents, and see connected notification integrations.
Can it make changes to my monitors?
Yes. You can pause or resume monitors, update their configuration, and create new monitors via MCP tools.
Which AI tools does it work with?
Any MCP-compatible client. It's client-agnostic.
How do I set it up?
Add the hosted UptimeRobot MCP endpoint to your MCP client's config and include your API token. Restart your client to auto-discover the tools.
Where does my API key live? Is it secure?
You add the token to your MCP client configuration. It's sent as a Bearer token to UptimeRobot's hosted MCP endpoint. You can rotate or revoke the token anytime in your dashboard.
Does MCP run locally or in the cloud?
It's hosted by UptimeRobot. No local server is required.
Can I use a read-only API key?
Yes. If you only need read access (listing monitors, stats, incidents, and integrations), you can use a read-only API key. Use your Main API key when you want MCP to create or update monitors.