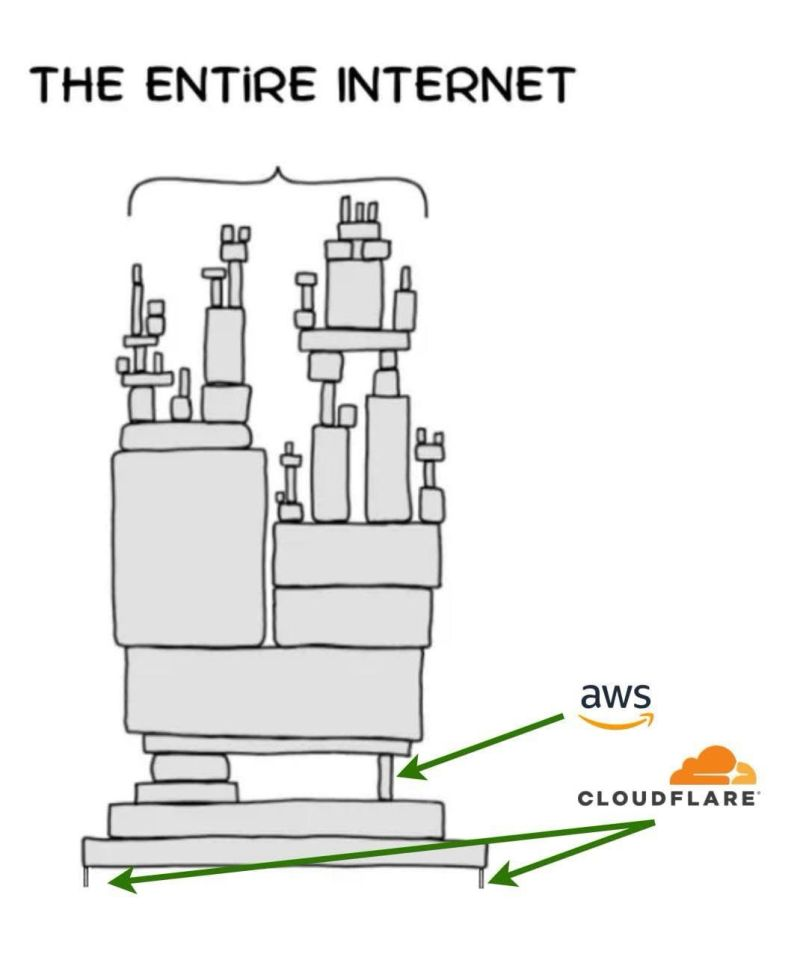
On November 18th, 2025, a large Cloudflare outage briefly broke big chunks of the internet.
For several hours, users around the world were greeted with 500 errors, including platforms like X, ChatGPT, Spotify, and many others that run behind Cloudflare’s network.
At UptimeRobot, we sit in a slightly unusual spot during events like this:
- We monitor over 10 million endpoints, including a massive number of websites and APIs that run on Cloudflare.
- We also use Cloudflare ourselves.
So when Cloudflare has a bad day, we see it twice: once in the alerts we send to our customers, and again in how it affects parts of our own infrastructure.
From our vantage point, about 18% of UptimeRobot users saw at least one monitor go down during the incident (compared to roughly 1.2% at the same time on a normal day), with an average downtime of 33 minutes and a median of 10 minutes.
On top of that, our notification pipeline briefly spiked by around 3,900%, which is 40x the usual load.
In this post, we’ll keep the Cloudflare internals short and focus on two things:
- A quick, human-readable summary of what went wrong.
- What we saw across the internet through UptimeRobot monitoring.
What happened at Cloudflare (the short version)
Cloudflare has already published a detailed breakdown of the incident, so we won’t repeat their whole post-mortem here.
In simple terms, an internal configuration change in Cloudflare’s Bot Management system caused one of their internal “feature files” to grow far beyond its expected size (after a ClickHouse permissions change doubled the rows returned by the query that builds it).
That file was pushed across their network and loaded by the software that handles traffic for many Cloudflare services. When the file became too large, the software started to crash. Cloudflare has confirmed that this wasn’t a cyberattack, but rather a bug in the configuration generation process.
Because of how the faulty configuration was generated and rolled out, some locations recovered briefly and then broke again, which is exactly the kind of pattern that shows up as flapping in uptime monitoring.
Incidents like this show that even if your own servers are healthy, your users can still see 5xx errors. Relying solely on internal monitoring is a dangerous game, and timely third-party uptime alerts might save you from lost revenue and reputational damage.
What we saw across the internet
When Cloudflare started having problems, our monitoring data reacted almost immediately.
A very large number of monitors behind Cloudflare flipped to DOWN in a short time window, then bounced between UP and DOWN as Cloudflare worked through the incident. From the outside, it looked less like a single clean outage and more like a series of waves hitting different parts of their network.
Inside UptimeRobot, dashboards quickly filled with incidents on Cloudflare-backed domains, and alerts fired for sites that were healthy themselves but still relied on Cloudflare to reach users.
Alert volume also went up – a lot. Notifications jumped by roughly 40x or 3,900%, as Cloudflare-backed monitors started to trigger at once.
How much downtime did our users experience?
Looking at all affected monitors, the average downtime during the Cloudflare incident was 33 minutes, with a median of 10 minutes. In other words, half of the affected monitors recovered in about ten minutes or less, but a long tail of longer incidents pulled the average up.
Broken down by monitoring intervals the affected monitors look like this (rounded):
- < 1 minute: ~1%
- 1–5 minutes: ~8%
- 5–10 minutes: ~30%
- 10–30 minutes: ~30%
- 30–60 minutes: ~6%
- 1–2 hours: ~24%
- > 2 hours: well under 1%
So most outages for Cloudflare-backed monitors were under 30 minutes, but almost a quarter of them stretched into the one–to–two-hour range.
So this outage drove roughly 15x more accounts into “something is down” territory than usual.
Final thoughts
As we’ve seen recently with AWS and now Cloudflare, any provider can run into issues and cause temporary chaos on the mighty internet. We believe it’s fair to say that if, at this point, you still don’t have reliable uptime monitoring in place, you’re going to run into problems down the line.
If you’re new here, join UptimeRobot to get 50 monitors with 5-minute intervals for free, no credit card required.