Uptime looks simple until you have to explain it after an incident. A service shows “99.9%,” customers are upset, and someone asks how many minutes were actually down. Without a clear method, the number creates more confusion than clarity.
This guide breaks uptime into something you can calculate, defend, and repeat. It covers the basic formula, what counts as downtime, and where teams usually miscalculate, planned maintenance, partial outages, and monitoring gaps.
You’ll learn how to translate percentages into real impact, compare SLAs without hand-waving, and validate the math with monitoring data. If uptime numbers matter to your users or your contracts, let’s get into it.
TIP: Read more about the 6 hidden costs of downtime.
What is the difference between uptime and availability?
Uptime and availability are often used interchangeably, but they have subtle differences.
Uptime refers to the total time that a system, typically a website or server, remains operational and accessible to users. It’s a measure of system reliability and stability. On the other hand, availability is the proportion of time a system is functional relative to a specific period, usually expressed as a percentage.
In simpler words: If you run a website that’s been live for 29 days in a month of 30 days, then it has an uptime of 29 days. If we turn this into a percentage relative to the entire month, it’s the availability.
| Uptime | Availability | |
| Definition | Total operational time of a system | Percentage of operational time in a period |
| Example | A site up for 29 days in a 30-day month | (29/30) x 100% = 96.67% for that month |
This distinction is crucial, especially when dealing with service providers who might tout impressive uptime figures. Always ask if they’re talking about absolute uptime or availability over a given period. The difference can impact your business’s operations.
99.999: The five nines
Achieving 99.999% uptime, often referred to as the Five Nines, is the Holy Grail in the world of uptime. For organizations, it translates to a yearly downtime of just about 5.26 minutes. The pursuit of the Five Nines has led many companies to invest heavily in infrastructure and monitoring tools.
TIP: What does 99.999% uptime really mean?
Statistically speaking, aiming for Five Nines (99.999% uptime) means your website or system would experience:
- Daily: 0.864 seconds
- Weekly: 6.048 seconds
- Monthly: 26.28 seconds
- Yearly: 5.26 minutes
of downtime.
In comparison, 99.9% uptime would allow for:
- Daily: 1.44 minutes
- Weekly: 10.08 minutes
- Monthly: 43.8 minutes
- Yearly: 8.76 hours
of downtime.
So while 99.9% and 99.999% might sound similar at first, the difference is quite significant at the end of the day.
So how hard is it to achieve 99.999% uptime? According to NOBL9, “Achieving five 9s availability is often difficult and expensive, as it requires a high level of redundancy and careful planning. For example, a power grid that is designed for five 9s availability will typically have backup generators and power lines that can be used if the primary system fails.”
SLA vs. SLO
Service Level Agreement (SLA) and Service Level Objective (SLO) are often at the heart of uptime discussions.
An SLA is a formalized commitment made by a service provider to its clients.
It’s often tied to legal obligations and can include penalties for not meeting the agreed-upon standards. Businesses usually use public status pages to showcase their SLA.
In contrast, an SLO is more of an internal benchmark set by organizations.
It’s an aspirational goal that they aim to achieve but isn’t legally binding.
If an organization sets an SLO of 99.99% and falls short, there might be internal repercussions, but clients can’t typically sue or claim penalties based on it.
Think of them as complementary, rather than separate things. Essentially, SLOs serve as internal objectives and benchmarks, while SLAs are oriented externally, usually between a service vendor and its client.
Check out our article SLA vs. SLO vs. SLI: What’s the Difference? for a deeper insight into the topic.
How to calculate uptime and availability?
Calculating uptime is straightforward — it’s the amount of time your system has been functional.
But to get the availability percentage, you’ll need to divide the uptime by the total period you’re measuring and multiply by 100.
For example, for a website that’s had 8 hours of downtime in a year: Total hours in a year: 8,760 Uptime = 8,760 – 8 = 8,752 hours Availability = (8,752/8,760) x 100 = 99.91%
Or, in a more visual form:
📅 Total Hours in a Year: 8,760 hours
🚫 Oops! Downtime Experienced: 8 hours
🆙 Actual Uptime: 8,760 – 8 = 8,752 hours
📈 Availability Percentage:
[(8,752 hours ÷ 8,760 hours) x 100] = 🎯 99.91% Uptime!
Other key metrics you should track
Beyond uptime and availability, several other metrics provide insights into system performance and reliability.
Metrics are more than just numbers on a dashboard, they are the narrative of a system’s journey.
They guide businesses in understanding not just the ‘how’ but also the ‘why’ behind system behaviors. Each metric is like a puzzle piece, revealing a different facet of the system’s overall health, efficiency, and user experience.
By tracking the right metrics, businesses can proactively identify potential pain points, anticipate challenges, and drive continuous improvement.
MTBF (Mean Time Between Failures)
This is an indicator of a system’s reliability. It represents the average interval between system failures.
If you have a high MTBF, it suggests that your system is reliable, encountering failures infrequently.
But what exactly constitutes a “good” MTBF?
The answer varies depending on the context and the specific industry in question.
According to Pure Storage, “Since the time between failures for a system or component can depend on factors such as configurations, operating conditions, age, and other external factors, there isn’t one ‘good’ MTBF metric. Instead, MTBF should be calculated for your specific assets and will become more accurate as you collect more data on them.”
Here’s an example of a high MTBF (which means the system is reliable):
Imagine a scenario where the system experiences disturbances three times within a span of 60 days (1,440 hours).
Each hiccup lasts just 5 minutes, adding up to a total disruption time of 15 minutes (0.25 hours).
Total uptime = (1,440 – 0.25) = 1,439.75 hours
Total number of incidents = 3
MTBF = total uptime / number of incidents
MTBF = 1,439.75 / 3 = 479.92 hours (roughly 20 days)
With interruptions occurring only every 20 days and lasting a mere 5 minutes each time, this system showcases a high degree of reliability, ensuring minimal disruption to business activities and customer experiences.
MTTR (Mean Time to Repair)
This refers to the average duration it takes to restore a system after a failure.
A lower MTTR indicates efficient recovery mechanisms in place.
On the other hand, the longer it takes for services to come back after a failure, the bigger the negative consequences.
Formula to Calculate MTTR:
MTTR = Total Repair Time / Number of Repairs
In the equation:
- Total Downtime is the cumulative time the system was down due to failures during a specified period.
- Number of Incidents refers to the total number of times the system failed in the same specified period.
For example, let’s say a website experienced five failures in a month:
- 2 hours on the 5th
- 1.5 hours on the 9th
- 3 hours on the 15th
- 2 hours on the 23rd
- 1 hour on the 28th
Using the formula, you get:
Total Downtime = 2 + 1.5 + 3 + 2 + 1 = 9.5 hours
Number of Incidents = 5
MTTR= 9.5 hours/5 = 1.9 hours MTTR
This means, on average, it took 1.9 hours to rectify a failure every time the website went down during that month.
Renewal rates
Renewal rates, especially in the realm of SaaS (Software as a Service) businesses and subscription models, act as key indicators of customer satisfaction.
While not directly tied to uptime, they offer insights into the customer experience.
A low renewal rate might hint at underlying issues, such as frequent downtimes, affecting user experience.
A study by Zippia found that a 5% increase in customer retention can lead to a 25% to 95% increase in profits, highlighting the importance of maintaining a high renewal rate and the potential indirect link to uptime.
Satisfaction scores
Satisfaction scores, such as Net Promoter Score (NPS) or Customer Satisfaction Score (CSAT), provide businesses with a pulse on their customers’ contentment levels. A dip in satisfaction scores often follow system downtimes.
For example, if users are consistently facing accessibility issues, their satisfaction scores are likely to plummet.
Research published on Research Gate shows that every 1% improvement in the satisfaction score can lead to a 2.37% increase in ROI and revenue, highlight the close relationship between satisfaction and system reliability.
On the other hand, a 1% decrease in customer satisfaction leads to a 5.08% decrease in ROI.
How to ensure 99.9% uptime
According to Zendesk, “73% of consumers will switch to a competitor after multiple bad experiences.”
Repeated outages would certainly qualify as bad experiences and stress the importance of investing in reliable uptime to avoid lost sales and retain loyal customers.
But consistently achieving 99.9% uptime is no easy task.
It requires a blend of technology, strategy, and proactive monitoring.
To get you started, here are some key actions to achieve this:
1. Investing in top-notch hosting solutions
Your hosting provider plays a pivotal role. Providers with a track record of consistent uptime, backed by genuine user reviews and industry recognition, are a safe bet.
2. Regular and proactive monitoring
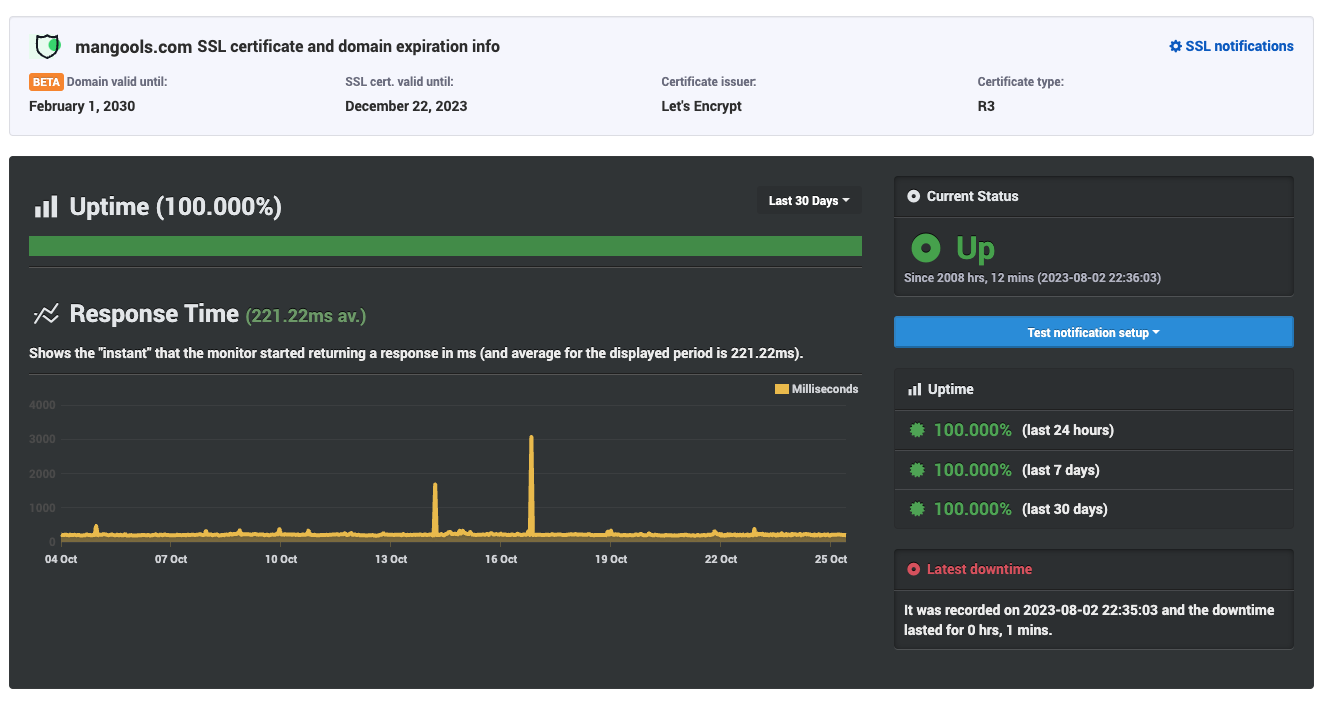
Using tools like UptimeRobot for website monitoring to actively monitor your website’s health and send alerts for potential downtimes can help you address issues as soon as they come up.
3. Routine maintenance and backups
Scheduled maintenance, coupled with frequent backups, ensures that even if things go south, recovery is quick and easier.
4. Implementing a Content Delivery Network (CDN)
A Content Delivery Network (CDN) efficiently disperses your website’s content across a network of servers worldwide. This strategic distribution safeguards your website’s availability, even if one server experiences difficulties.
While this enhances loading speed and minimizes latency, it’s important to note that CDNs are primarily designed for serving static content such as images, CSS, and JavaScript. If your website is dynamic, such as an e-commerce platform powered by WordPress, relying solely on a CDN won’t ensure continuous operation in the event of backend server or database failures.
5. Diversifying DNS providers
Relying on a single DNS (Domain Name System) provider can be a point of failure. By using multiple DNS providers, you’re safeguarding your website from potential outages that can occur if one DNS provider goes down.
For example, when Dyn, a major DNS provider, suffered a massive distributed denial-of-service (DDoS) attack in 2016, websites that relied solely on Dyn for their DNS services were affected, while those that had diversified their DNS providers were better positioned to remain accessible during the outage.
What uptime percentages actually mean
Uptime percentages look simple until you translate them into minutes and hours. That translation is where most misunderstandings happen, especially in SLAs and post-incident reviews.
Start with the total time window. Uptime is always measured against a period, usually a month or a year. A “99.9 percent uptime” claim means nothing unless the timeframe is clear. For monthly reporting, use the total minutes in that month, not a fixed average.
The basic formula is straightforward:
-
Total time in period
-
Minus total downtime
-
Divided by total time
-
Multiplied by 100
Where it gets tricky is defining downtime. Decide upfront what counts. Planned maintenance, partial outages, and regional failures often get debated after the fact. If you exclude maintenance, document it. Otherwise, uptime math turns into opinion.
Percentages hide impact. A single 45-minute outage and nine five-minute outages can produce the same uptime number, but feel different to users. That is why pairing uptime with incident count or longest outage adds context.
Small percentage changes matter more than they look. The difference between 99.9 and 99.99 percent uptime is not cosmetic. Over a 30-day month:
-
99.9 percent allows about 43 minutes of downtime
-
99.99 percent allows about four minutes
That gap is often larger than expected and should drive how aggressively teams invest in redundancy and alerting.
Rolling windows help spot trends. Monthly uptime can look stable while weekly uptime degrades. Calculating uptime over shorter windows surfaces reliability drift earlier, before it shows up in SLA reports.
Be careful with averages across services. Averaging uptime from multiple components can inflate the final number. If users depend on all components, the weakest link defines the experience. In that case, track uptime per dependency and for the full request path.
Finally, treat uptime as a signal, not a goal. Chasing a percentage can hide slow failures, retries, and degraded performance. Pair uptime calculations with latency and error-rate monitoring to understand what users actually experience.
Clear definitions and consistent math matter more than chasing extra nines.
Final thoughts
Uptime is the heartbeat that keeps businesses alive and thriving. The ripple effect of even a minor downtime can lead to lost revenues, a loss of customer trust, and a damaged brand reputation.
But understanding the details of uptime, availability, and associated metrics in the online business world isn’t just about number-crunching. It’s also about ensuring a smooth, continuous experience for every user.
Whether you’re reaching for the elusive Five Nines or simply working to maintain a consistent online presence, every second counts. Equip yourself with the knowledge, tools, and strategies shared here, and you’ll be well on your way to establishing a reliable digital footprint that keeps customers coming back for more.
FAQ’s
What does uptime percentage actually measure?
Uptime percentage measures how much time a system was available during a given period. It’s calculated as available time divided by total time, expressed as a percentage. This helps quantify reliability in a way that’s easy to compare over time.
How do you calculate uptime?
ptime is calculated by subtracting total downtime from total time, then dividing by total time. For example, if a service was down for 30 minutes in a 30-day month, its uptime is (totaltime-downtime)/totaltime(total time – downtime) / total time. Always use the same time window to keep comparisons accurate.
What’s the difference between uptime and availability?
Uptime focuses on whether a system is running, while availability considers whether users can actually access it. A service can be “up” but still unavailable due to partial outages or performance issues. Availability is usually the more user-centric metric.
How much downtime equals 99.9% uptime?
At 99.9% uptime, you’re allowed about 43 minutes of downtime per month. Small percentage differences translate into real user impact faster than most teams expect. That’s why “three nines” versus “four nines” matters operationally.
Should planned maintenance count as downtime?
That depends on how you define your SLA or internal goals. Many teams exclude planned maintenance from uptime calculations, but users still experience it as downtime. Be explicit and consistent about what you include.
3 Comments
Interesting how 6 seconds a week of downtime will cause 26 minutes a month of downtime. I'd recommend to double check your math there.
"Weekly: 6.048 seconds
Monthly: 26.28 minutes"
Good catch, Simon! It's supposed to be 26 seconds, not minutes, of course. It's fixed now.
how to fined PM and RCA