Synthetic monitoring catches failures users haven’t reported yet. A login flow slows down, checkout breaks after a deploy, or a third-party script times out only in one region. By the time real traffic hits the problem, revenue or trust is already lost.
This article looks at synthetic monitoring tools from a hands-on ops perspective. What they’re good at, where they fall short, and how much effort they take to keep accurate as your app changes. The focus is on real workflows, not demo scripts.
You’ll learn when synthetic checks make sense, how to choose the right tool, and how to avoid brittle tests that alert for the wrong reasons. If you want earlier signals without extra noise, keep reading.
How we chose the synthetic monitoring tools
When choosing the best synthetic monitoring tools we focused on several factors.
Some of the main factors included:
- User reviews
- Features
- Pricing
- Ease of use
Our analysis focused on defining the best tools for various needs, ensuring that each selection delivers value and performance across different industries and organizational sizes.
Whether you’re a small startup looking for budget-friendly options or a large enterprise seeking advanced features, our list includes tools tailored to meet diverse requirements.
Best Synthetic Monitoring Tools Reviewed
We’ve hand-picked the best monitoring solutions in 2026 based on their unique features and benefits.
From user-experience and ease-of-use to enterprise-level functionality, find the perfect monitoring tool for your business.
We grouped the tools into the following categories:
- Comprehensive monitoring solutions: Tools that provide a combination of synthetic monitoring, real-user monitoring, and full-stack capabilities.
- Uptime and performance monitoring tools: Tools focused on monitoring website uptime, performance metrics, and user experience.
- API monitoring tools: Specialized tools for monitoring APIs and web applications.
- Incident management and status page tools: Tools designed for incident response, management, and service status communication.
- AI-powered accessibility tools: Some monitoring solutions now integrate AI gateway to enhance accessibility, including features like TTS voices for better communication and user experience.
1. UptimeRobot
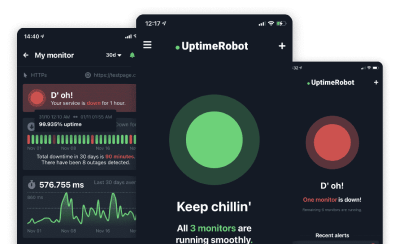
UptimeRobot primarily focuses on monitoring the uptime and availability of websites, servers, ports, SSL certificates, domains, response time, or cron jobs by periodically sending requests to specific URLs or IP addresses and alerting you immediately when your attention is needed.
Here are some key features of UptimeRobot that align with synthetic monitoring:
Key Features of UptimeRobot
- HTTP(S) Monitoring: Periodically sends HTTP or HTTPS requests to specified URLs to check if they are accessible and responding correctly.
- Ping Monitoring: Uses ICMP ping to check the availability of servers or network devices.
- Port Monitoring: Checks the availability of specific ports on servers to ensure services like FTP, SMTP, and others are up and running.
- Keyword Monitoring: Checks the presence or absence of specific keywords in the response body of a web page.
- Interval Checks: Allows users to set the frequency of checks, ranging from every 30 seconds or 5 minutes to 24 hours.
- Global Monitoring Locations: Performs checks from multiple geographic locations to avoid false positives and to ensure global availability and performance.
- Alerting: Sends notifications via email, SMS, push notifications, and other channels when a monitored service goes down or comes back up.
How UptimeRobot Fits Synthetic Monitoring
-
- Proactive Monitoring: UptimeRobot proactively checks the availability and performance of services at regular intervals.
- Scripted Interactions: While UptimeRobot’s interactions are simpler compared to more complex synthetic monitoring tools (which might simulate user transactions), it still mimics basic user actions like accessing a web page or pinging a server.
- Global Reach: By performing checks from various locations, UptimeRobot ensures that services are accessible globally.
- Performance Metrics: Provides uptime statistics and response times, helping to identify performance issues.
Pros
- Full-service monitoring
- Easy to use
- Excellent proprietary and community support
Cons
- Might not cover all synthetic monitoring needs
Pricing:
- Free plan: Offers basic monitoring features for 50 monitors with 5-minute check intervals, forever free of charge.
- Pro plans: Starts from $7/month, providing 1-minute or 30-second checks, advanced features, and up to 17 native integrations.
G2 Rating: 4.6/5
Users said: “Best monitoring service.”
Comprehensive Monitoring Solutions
Explore our list of comprehensive monitoring solutions:
2. Better Stack

Better Stack is a comprehensive monitoring solution that combines synthetic and real-user monitoring to give you a clear overview of the application’s performance.
It allows you to visualize your entire stack in a beautiful dashboard, giving you clear insights into performance issues and how to debug them.
Pricing:
- Starts at $0 per month with 10 monitors
- Pay as you go model, starts at $29 per month
G2 Rating: 4.8/5
Users said: “Very easy to set up.”
Pros
- Combines synthetic and real-user monitoring
- Data visualization and alerting
Cons
- Limited Scalability options
- Fewer integrations than some competitors
3. New Relic
New Relic is a cloud-based platform that allows you to monitor your stack. It allows you to monitor your application in real-time.
By analyzing metrics that the platform provides, developers can identify and remove any issues that may hinder the optimal performance of your application.
Pricing:
- Starts at $0
- Employs a pay-as-you-go model for paid versions
G2 Rating: 4.3/5
Users said: “Excellent and diverse infrastructure monitoring.”
Pros
- Application Performance Monitoring (APM)
- Ease of use
Cons
- Technically challenging
- Pricing is confusing for some users
4. Dynatrace
Dynatrace is a software intelligence platform that leverages its AI capabilities to automate the detection and resolution of any application issues.
It is best-suited for cloud-native environments where it can analyze and provide the user with comprehensive information about the infrastructure health in cloud environments.
Pricing:
- Free trial
- Pay $0.001 per synthetic request
G2 Rating: 4.5/5
Users said: “Dynatrace is robust , tough competitor for other APM tools.”
Pros
- Unified observability
- AI-driven analytics
- Generation of detailed monthly reports
Cons
- Potential high costs
- Difficult dashboard navigation for some users
- Complex setup
5. Datadog
Datadog is a popular, cloud-based application monitoring platform. It provides users with comprehensive insights into the application’s monitoring, log management and security.
Datadog is praised for its flexibility and scalability. They allow it to efficiently address the needs of businesses and companies of all sizes.
Pricing:
- Free plan
- Pro ($15/month): Centralizes the monitoring of all your systems, with 750+ integrations and 15-month metric retention
- Enterprise ($23/month): Advanced features and machine-learning based alerts
G2 Rating: 4.4/5
Users said: “Datadog’s easy to use UI and simple setup streamlined our monitoring stack.”
Pros
- Efficient dashboard for monitoring
- Multi-stage alerts
- The REST API functionality
Cons
- Some users reported lacking documentation
- Time-consuming setup
- Missing reporting capabilities
Uptime and performance monitoring tools
Explore our list of synthetic monitoring tools designed to effectively analyze and improve the uptime of your applications.
6. Uptime.com
Uptime.com is a website monitoring solution designed to quickly help users assess whether their application is up.
Its key features are gathering insights for API checks, page speed checks, synthetic, and real user monitoring.
Pricing:
- Starter ($20/month): Limited number of uptime, transaction, and API checks
- Essential ($67/month): Increases the number of checks, includes real user monitoring
- Premium ($379/month): Improved monitoring capabilities
- Custom: Solution tailored to your specific needs
G2 Rating: 4.5/5
Users said: “Simplify your performance tracking for better reliability!”
Pros
- Intuitive interface
- In-depth insights
- Customizable alerts
Cons
- Higher cost than competitors
- Lacking documentation in some areas
- Limited plans for startups
7. Pingdom
Pingdom is known as a reliable and easy-to-use solution for tracking website performance metrics.
It offers both real-time and synthetic monitoring for comprehensive performance insights.
One of Pingdom’s key features is that it shows live mapping of performance hotspots across the globe.
Pricing:
- No free version
- Starts at $10 per month
Capterra rating: 4.5/5
Pros
- Easy-to-use interface
- Comprehensive website performance insights
Cons
- Limited customization options compared to some competitors
- Some users report negative experiences with Pingdom’s customer support
8. Site24x7
Site 24×7 is a comprehensive cloud-based monitoring solution. It offers users browser, transaction, and server monitoring.
Key features of Site 24×7 include code-level diagnostics and customizable error thresholds, and the tool is accessible through mobile.
G2 Rating: 4.6/5
Users said: “Very useful tool to find the issues in our websites.”
Pricing:
Site 24×7 utilizes a transparent pricing model based on your needs and the size of your organization.
You can see their monitoring pricing in the below image:
Pros
Cons
- Lacking VM monitoring capabilities
- Confusing interface for some users
- False alerts according to some users
9. Uptrends
Uptrends is another cloud-based monitoring tool that allows users to monitor the performance of their websites, servers, APIs and more.
Some of its key features include checkpoint monitoring, real-time alerts, and a transaction recorder.
Uptrends became a part of the ITRS, a 24/7 monitoring service that provides quick alerts and leads to speedy resolution of any issues that might affect the users’ digital experience.
G2 Rating: 3.9/5
Users said: “Great for our external site monitoring and alerting our teams of an outages.”
Pricing:
Uptrends’ segregated its pricing based on different functionalities, allowing users to find a solution that best aligns with their needs and budget.
Pros
- In-depth performance insights
- Worldwide monitoring locations
Cons
- Higher costs for small businesses
- Steep learning curve
Performance and API monitoring tools
Explore our list of best performance and API monitoring tools available in 2026:
10. Dotcom-Monitor
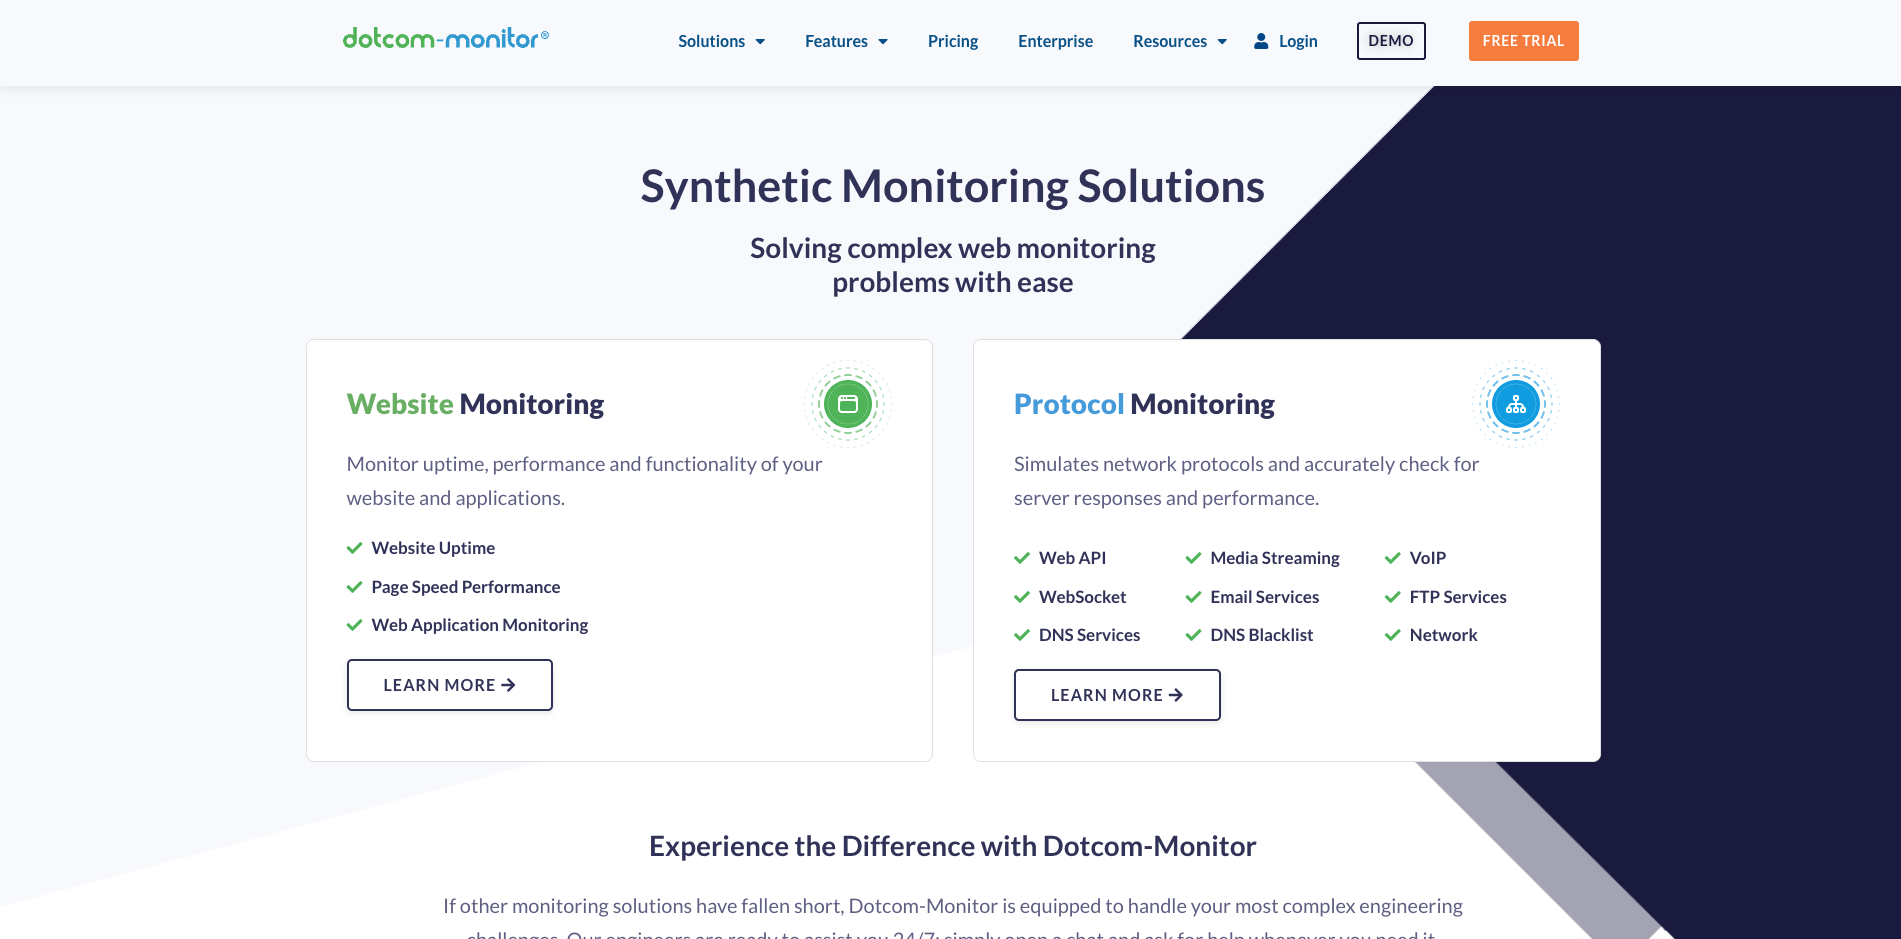
Dotcom-Monitor is a cloud-based comprehensive synthetic monitoring platform. It offers users a way to ensure availability, uptime and scalability for websites, applications, APIs, and IT infrastructure.
One of its main features is the ability to consume data through the XML feed, allowing developers to subscribe to the wanted data and present it in their own desired format and environment.
Pricing:
- Website and API Monitoring: From $19.99/mo
- Internet Infrastructure: From $40.00/mo
- Page Performance: From $29.96/mo
- Web Applications: From $38.95/mo
G2 Rating: 4.5/5
Users said: “Reliable Monitoring Solution.”
Pros
- Ease of use
- Customer service
- More than 20 servers for web page speed in a single click
Cons
- Some users reported inconsistency in server response time readings
- Too technically challenging at times
- Pricier than some competitors
11. SpeedCurve
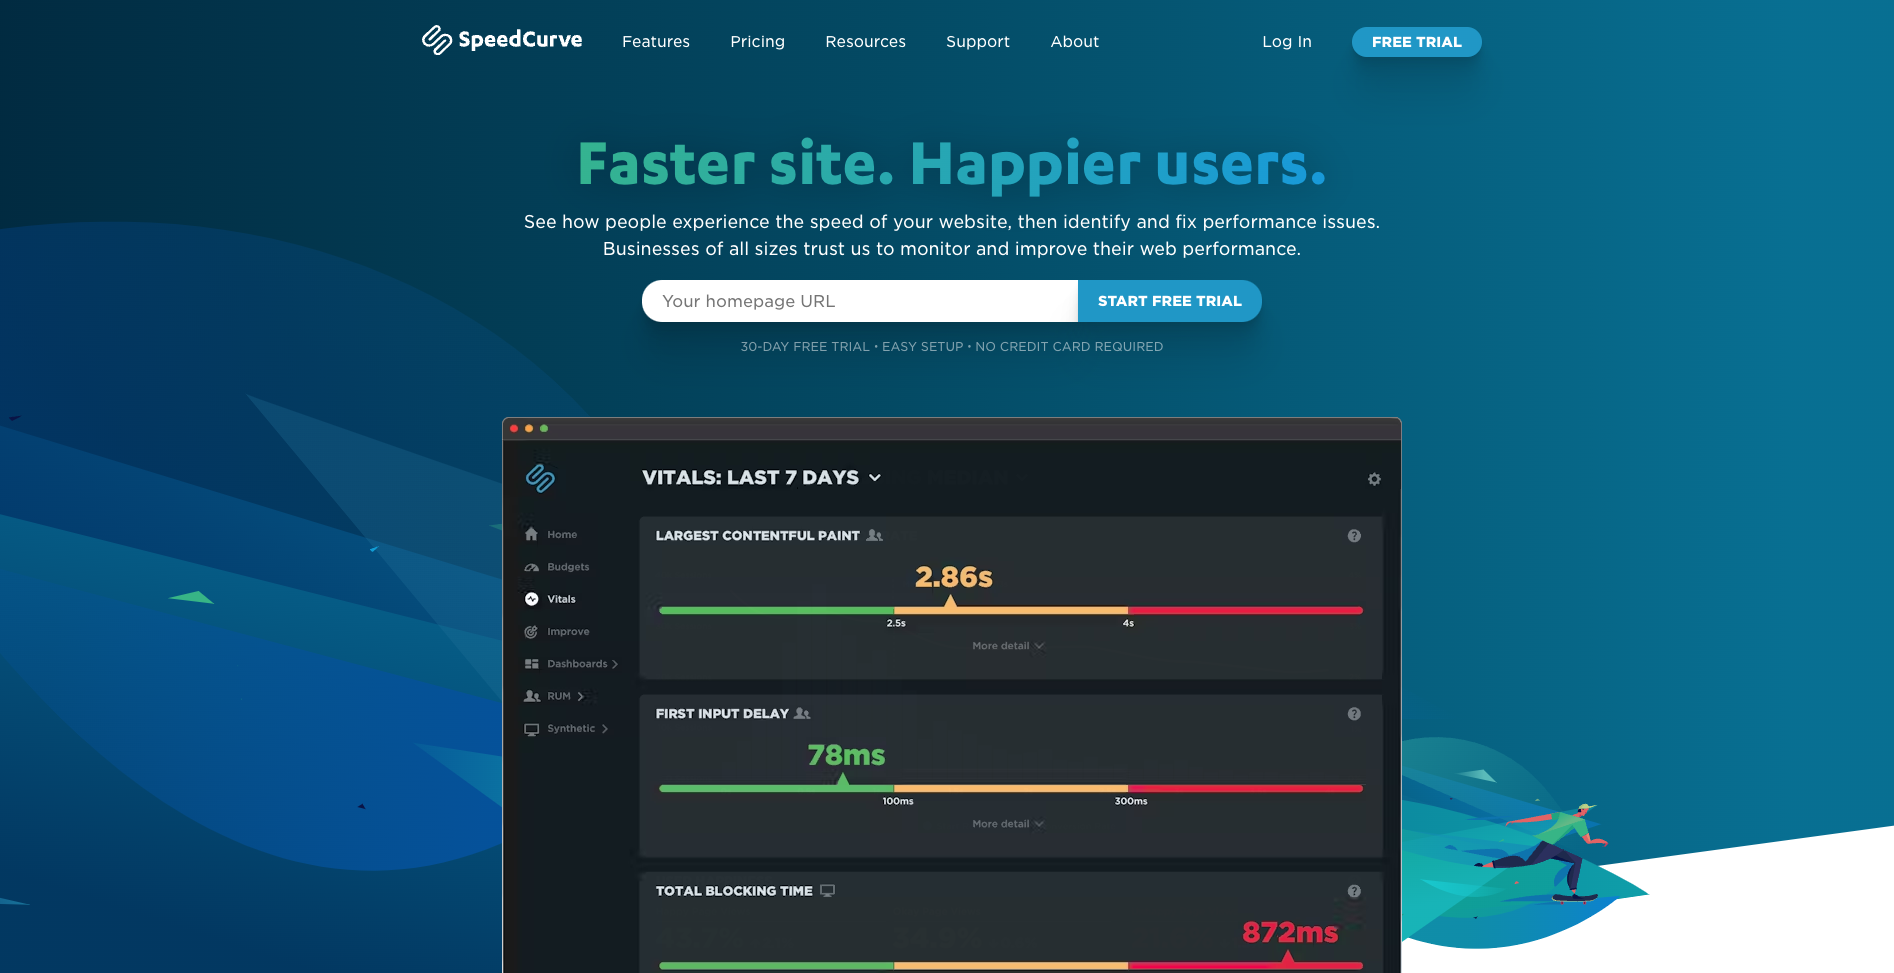
SpeedCurve is a performance monitoring tool that allows businesses of all sizes to check their site’s performance and how it impacts their business metrics.
Leveraging the Core Web Vitals feature, SpeedCurve leverages the Core Web Vitals feature which quickly debugs systems and improves Google search rankings.
Pricing:
- Starter ($12/month): Unlimited teams and users; synthetic monitoring
- Growth ($576/month): Real user monitoring; high priority support
- Enterprise ($1,680/month): Single sign on (sso); synthetic private agents; regular check-ins; consulting
Pros
- Detailed visualization of metrics
- User-friendly interface
Cons
- Limited API functionality compared to some competitors
- High cost
12. Catchpoint
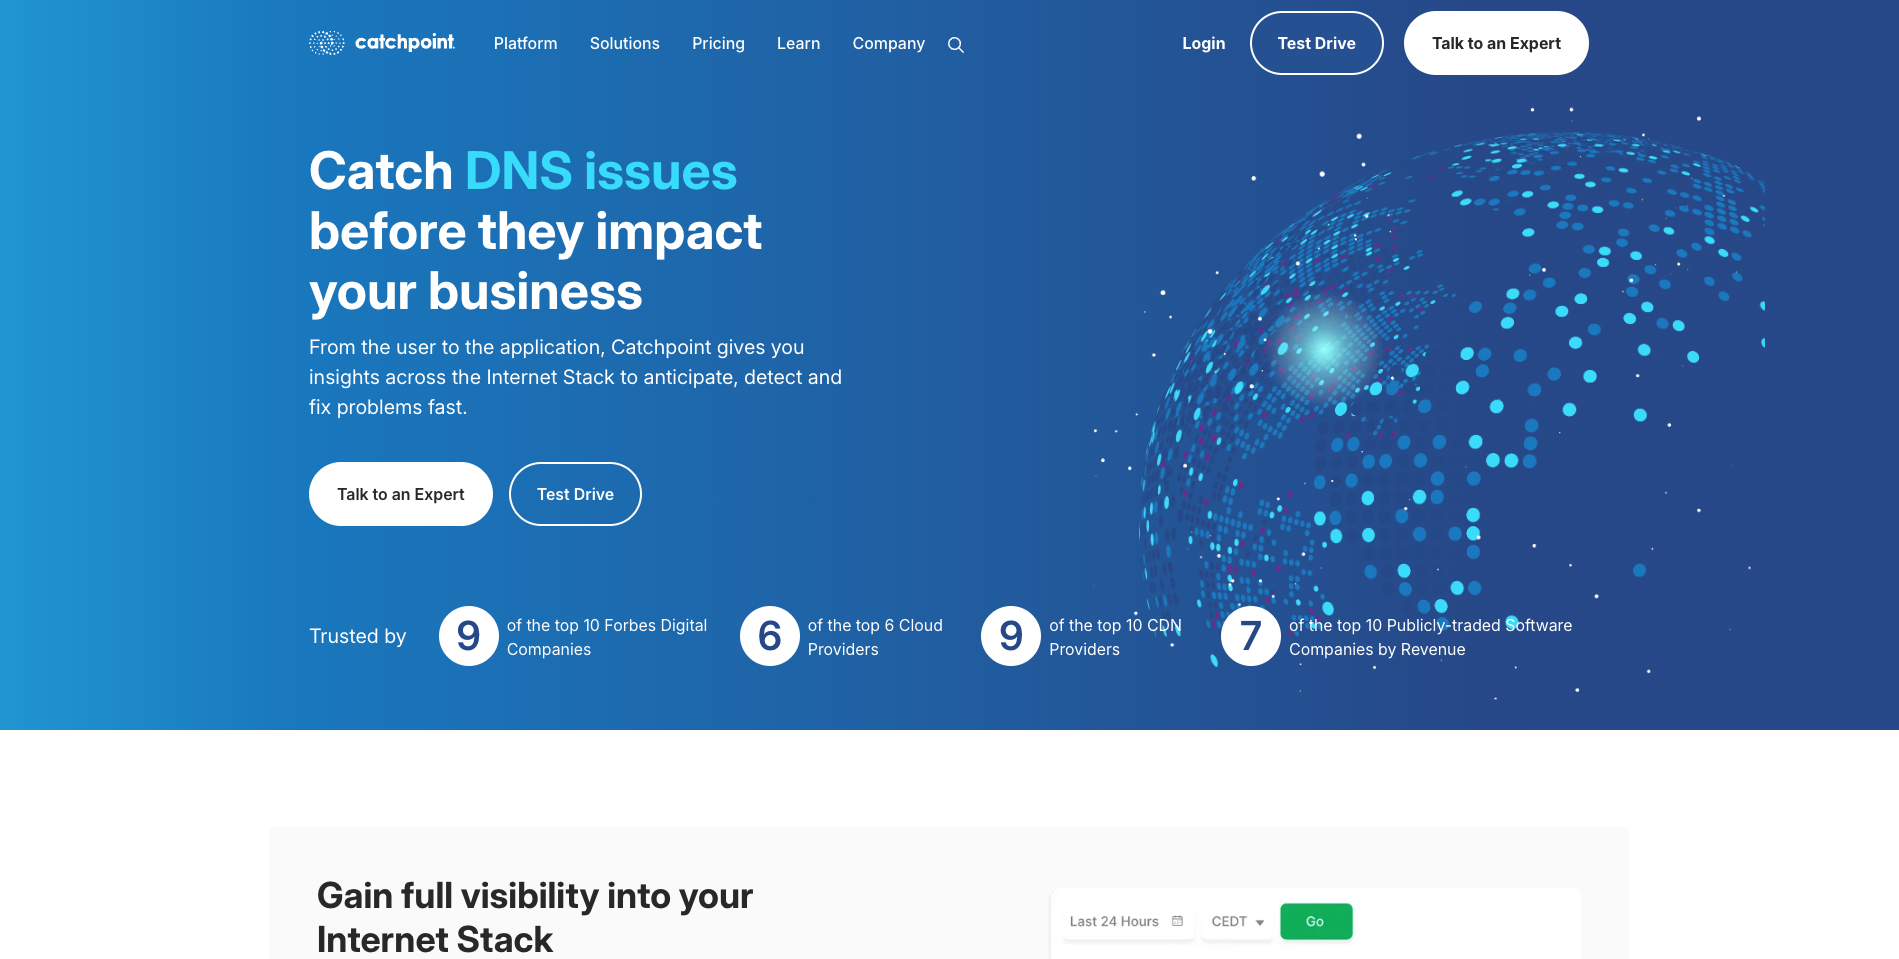
Catchpoint is another performance monitoring tool that analyzes your complete digital ecosystem and provides you with actionable insights.
Some of its main features include:
- Visibility into the entire stack
- Internet Stack Map for simplified troubleshooting
- Global observability network
Pricing:
- Flexible pricing based on your needs
G2 Rating: 4.5/5
Users said: “Catchpoint – Tool to identify bugs.”
Pros
- Live chat support
- Number of available nodes for running the probes
- Easy to login with SSO
Cons
- Confusing UI interface
- Limited functionality according to some users
- Difficulty with JavaScript editor
13. Checkly
Checkly is a cloud-native API monitoring tool that allows users to check the performance and availability of their APIs and web applications.
One of its main features is the ability to do complex browser tests using a simple JavaScript API.
Pricing:
- Hobby ($0/month): 10k API / 1.5k browser check runs
- Team ($80/month): 100k API / 12k browser check runs
- Custom: custom solutions tailored to your needs
G2 Rating: 4.5/5
Users said: “Provides great security for deployments.”
Pros
- Ease of use
- Strong API monitoring focus
Cons
- Pricing not suitable for small team
- Confusing interface at times
Incident management and status page tools
Explore the tools with a focus on incident management below:
14. PagerDuty
A digital operations platform that focuses on quickly identifying and resolving incidents.
PagerDuty offers robust on-call scheduling, real-time notifications, and detailed reporting, making it a great tool for teams looking to optimize their incident response times..
Pricing:
- Free ($0/month): Easy on-call scheduling, unlimited API calls, 700+ out-of-box integrations
- Professional ($21/month): Free plan + International phone/ SMS notifications, SSO Ticketing integrations, email support
- Business ($41/month): Professional + incident workflows business response, advanced admin features, advanced ITSM integrations
- Enterprise: Custom solution for your needs
G2 Rating: 4.5/5
Users said: “PagerDuty: Seamless monitor of IT alerts.”
Pros
- Great notification system
- Slack integration
- Customizable notifications
Cons
- Lack of integrations
- Higher cost than some of the competitors
- Some users reported false alerts
15. Zabbix
Zabbix is an open-source comprehensive monitoring solution.
It offers diverse monitoring solutions for networks, servers, and virtual machines. Some of its main features include:
- Centralized monitoring
- Multi-platform support
- Native agents and SNMP Support
Pricing:
Zabbix is open-source and free to download and use
G2 Rating: 4.3/5
Users said: “Flexible, powerful and customizable monitoring tool.”
Pros
- Wide-range of monitoring capabilities
- Customizable triggers and alerts
- Open-source flexibility
Cons
- Some users find user interface difficult to navigate
- Limited mobile support
- Support response times could be better
What synthetic monitoring tools catch before real users feel it
Synthetic monitoring tools run scripted checks that simulate user behavior on a schedule. Instead of waiting for real traffic to fail, they test key paths proactively. That shift from reactive to proactive is where most of the value sits.
These tools are strongest at validating workflows, not just endpoints. A homepage loading does not mean login works. Login working does not mean checkout succeeds. Synthetic checks walk through steps in order and fail if any part breaks. This makes them useful for spotting issues that basic uptime checks miss.
Consistency is another advantage. Synthetic tests run the same way every time, from the same locations, with the same inputs. That removes variability from the signal. When a synthetic check fails, it usually means something changed in the system, not user behavior.
They also help with change detection. Deploys, config updates, CDN changes, and dependency updates often introduce subtle breakage. Synthetic checks placed around release windows catch regressions fast, while rollback is still cheap.
That said, synthetic monitoring has limits. It tests what you script, not everything users do. If a flow is not covered, failures slip through. Over time, scripts drift from reality as products evolve. Keeping them accurate requires regular review.
False confidence is another risk. A green synthetic dashboard does not mean all users are happy. Real traffic varies by device, network, and behavior. Synthetic tools usually represent a narrow slice of that diversity. They complement, not replace, real user monitoring.
Execution cost matters too. Complex scripts take longer to run and are more fragile. Tests that are too detailed fail for reasons unrelated to user impact, like slow third-party assets. The goal is to test critical paths, not every edge case.
The most effective setups are selective. Teams monitor a small number of high-value journeys, such as login, checkout, or API auth. They keep scripts short, stable, and tied to business impact.
Synthetic monitoring works best when you ask one question: can a user complete the thing that matters most right now? When checks answer that clearly, failures stop being surprises.
When to consider using synthetic monitoring
Having defined some of the best synthetic monitoring tools and their features, we can ask the question: when do you need synthetic monitoring?
Some real-life use cases of synthetic monitoring include:
- Testing performance issues before they affect users: Synthetic monitoring can simulate real user interactions when real users aren’t available (such as pre-launch).
- Benchmarking: You can look at your APIs from different locations at different times, allowing you to set benchmarks for your website performance.
- Testing your scaling capabilities: Using synthetic monitoring, you can test the performance of your website under a simulated increased load.
- Monitoring third-party integrations: Use it to test APIs integrated with third-party services.
- Ensuring security and compliance: You can ensure that your website meets minimum regulatory requirements for uptime while also testing for user interactions that can reveal vulnerabilities.
Conclusion
When trying to find the perfect synthetic monitoring tool, it comes to the size of your team, budget and the specific features you need to optimize your operation.
If you are looking for a reliable and easy to use solution for uptime monitoring and availability, then you might want to consider Uptime Robot.
However, if you need a more comprehensive solution that combines real-user and synthetic monitoring, then Better Stack, with its holistic view, might be the solution you need.
Ultimately, the only right solution is the one that fits you and your exact needs. Make sure you understand what you need and you will find a solution that ticks most, if not all, of your boxes.
FAQ’s
What is synthetic monitoring?
Synthetic monitoring uses automated checks to simulate user interactions with a system. These checks run on a schedule to verify availability, response time, and basic functionality. It helps detect issues before real users are affected.
How is synthetic monitoring different from real user monitoring?
Synthetic monitoring runs scripted tests from known locations, while real user monitoring collects data from actual user sessions. Synthetic monitoring is proactive and predictable. Real user monitoring is reactive and reflects real-world behavior.
What can synthetic monitoring test?
It can test uptime, response time, APIs, login flows, and critical user paths. Synthetic checks are especially useful for verifying that key workflows work end to end. They’re not limited to simple “is it up” checks.
When should teams use synthetic monitoring?
Teams use synthetic monitoring when they want early detection and consistent baselines. It’s useful for catching issues during off-peak hours or before releases impact users. It’s also helpful when traffic is low but reliability still matters.
What are the limitations of synthetic monitoring?
Synthetic monitoring doesn’t reflect every real user condition, browser, or network. It also won’t capture issues that only affect specific user segments. That’s why it works best alongside other monitoring types.
1 Comment
nice blog