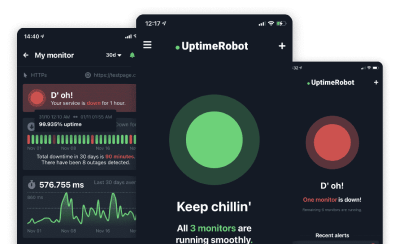
Uptime Robot helps getting notified of any downtime so that any possible issues can be resolved quickly.
It is also a very good idea to share the statuses of the monitors with website visitors or teammates so that they know how the website/system performs too.
Such communication helps them to know “it is or it is not only them when they experience issues reaching the sites/servers”.
Last update: 12th April 2021 (updated screenshots, introduced redesigned status pages, customization options, custom domains CNAME DNS settings).
Content of this article:
- How to create a status page?
- How to connect a custom domain?
- Are you using Cloudflare?
- How to customize your status page?
- How can I use the “Subscribe to updates” feature?
- How can I track my visitors on the status page?
- How can I change the homepage URL?
- How can I add and remove password protection?
Public Status Pages
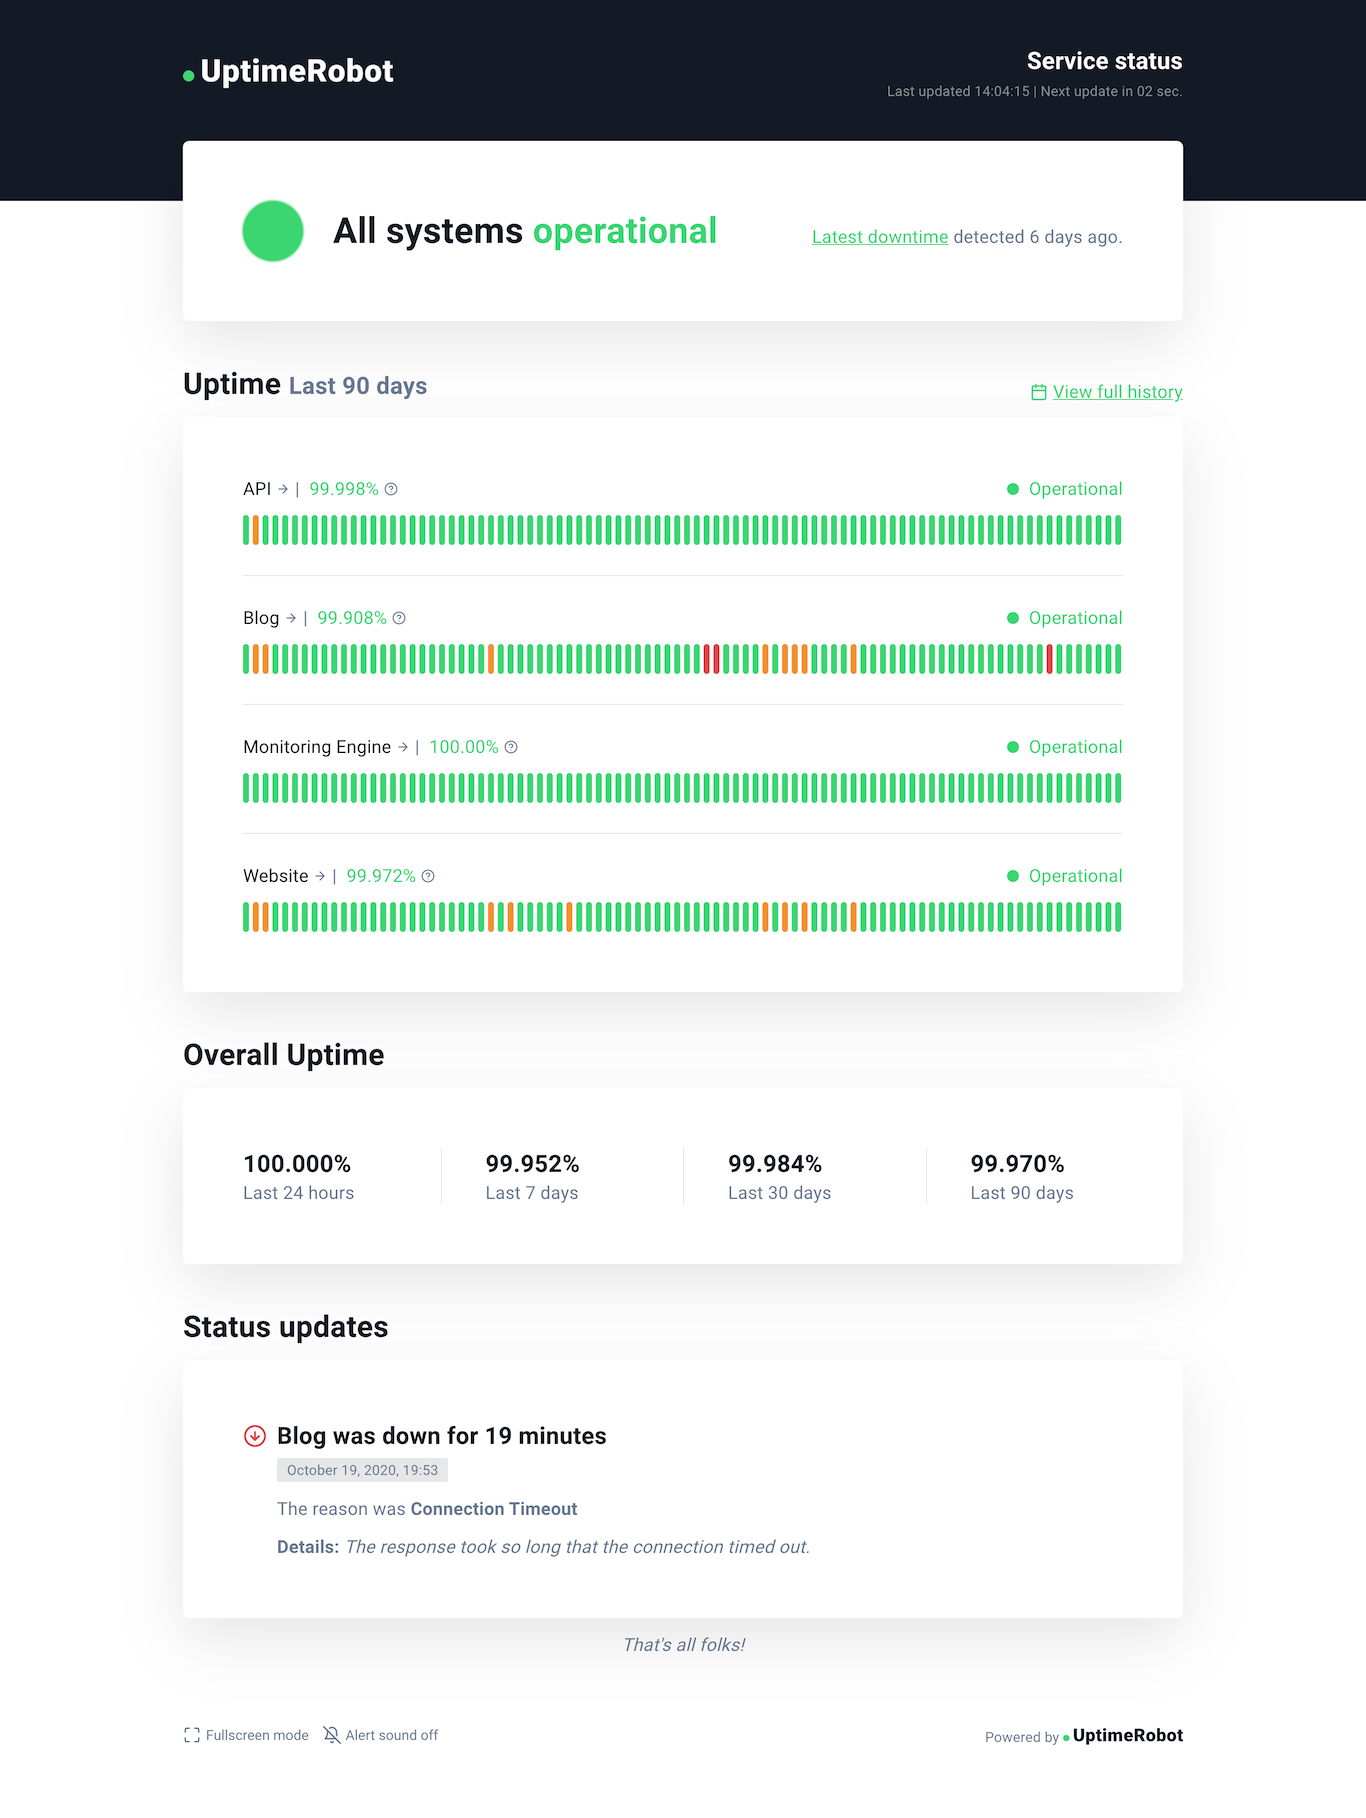
This new feature helps to create such a public status page in seconds where the page will be displaying all the major details needed (uptime status and ratio for the last 24 hours, 7/30/90 days, announcements, and UP/DOWN events).
With a PRO plan, your visitors can subscribe to updates and receive them via email.
Note: As a demo, check Uptime Robot’s status page.
How to create a status page?
Here are the steps to create it:
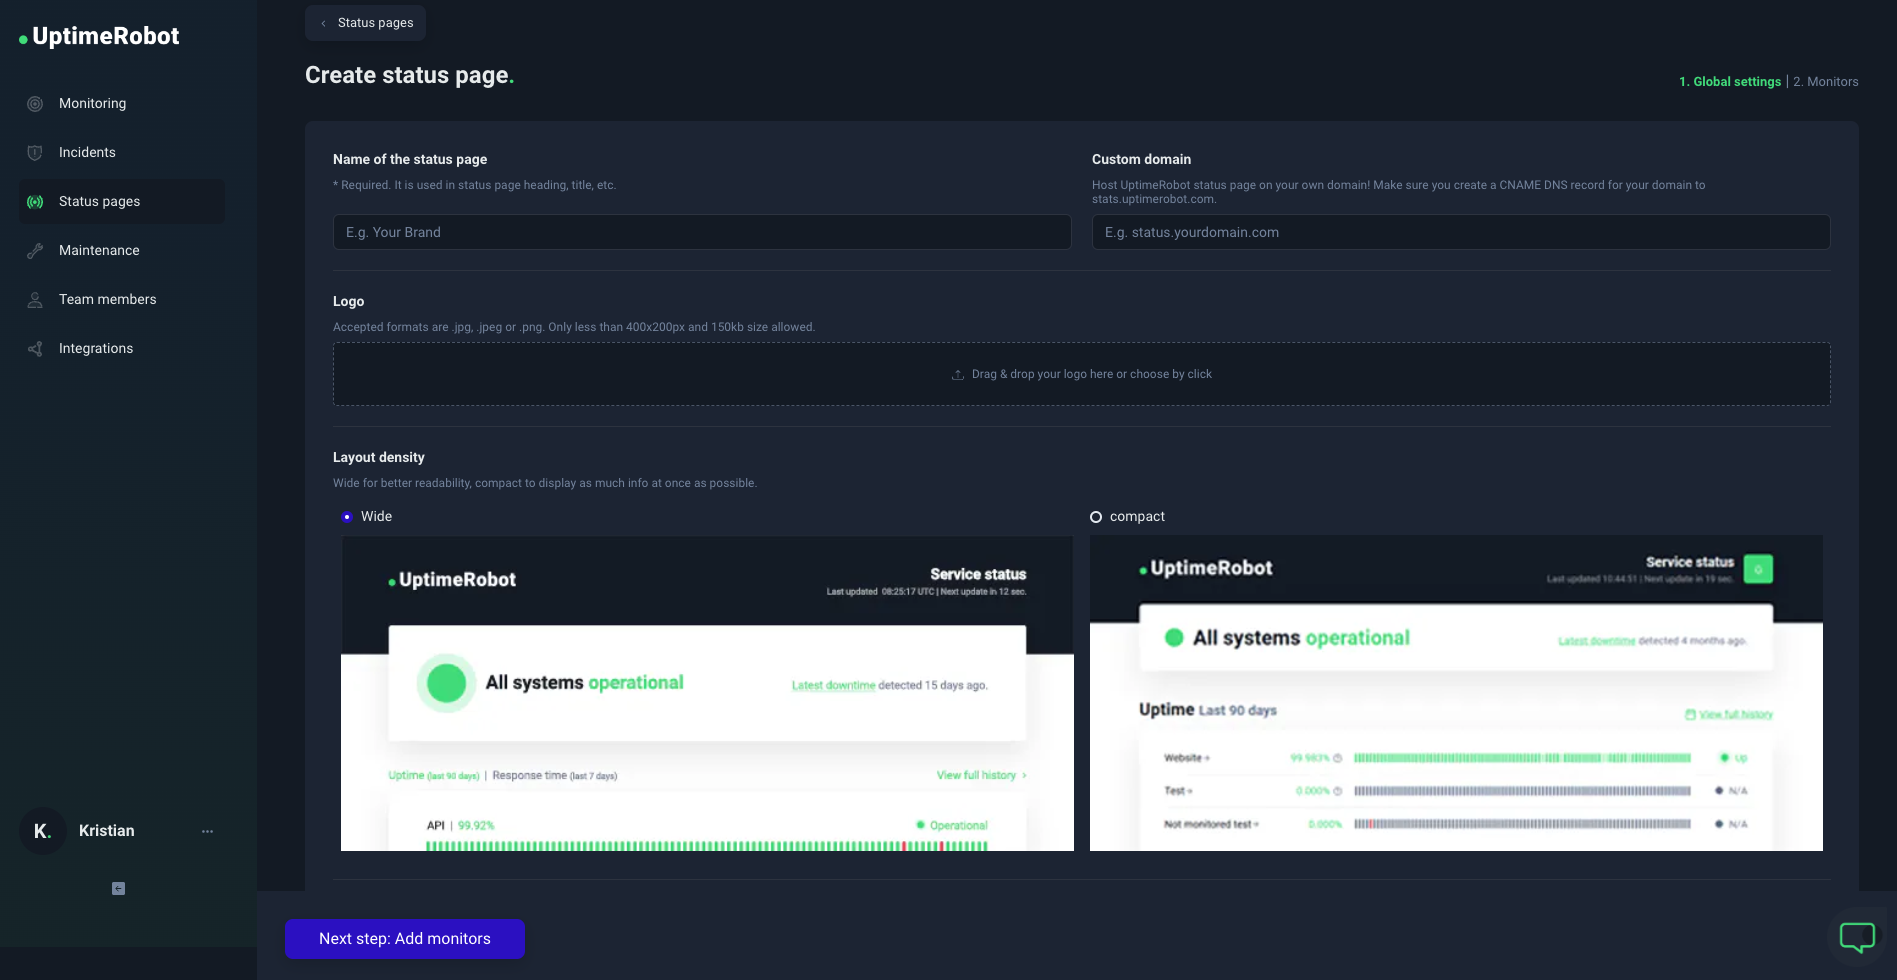
1. Log in to your account at UptimeRobot.com and click on “Status Pages“.
2. click on “Add Status Page”.
3. Enter the name of your status page – this will be shown on your status page if you don’t add a logo.
4. Upload your logo, enter a custom domain, or protect it with a password (optional).
5. You can also hide our logo from your status page if using a PRO plan.
6. Add monitors to your status page – you can pick them or add all monitors. Click on the blue finish button and that’s it!
7. Your status page will be public with a unique UptimeRobot.com URL (custom domain is optional).
How to connect a custom domain?
You can use the status page on your own subdomain, for example, status.yourdomain.com.
What CNAME record should I use for the custom domain?
Make sure your CNAME DNS record is set and resolving correctly to stats.uptimerobot.com. Please, contact your domain/DNS provider if you don’t know how to set it.
We are using Lets’ Encrypt and ZeroSSL to issue SSL certificates for your custom domain. If you already have CAA records in place, you need to add the following CAA records to your DNS settings:
example.com. IN CAA 0 issue “letsencrypt.org”
example.com. IN CAA 0 issue “zerossl.com”
These records authorize Let’s Encrypt and ZeroSSL to issue certificates for your domain. If you do not have any existing CAA records, you may skip this part.
You can check if the CNAME DNS record is resolving already using available free tools like this from Google Admin Toolbox.
It might take up to 24 hours for your custom domain status page to become active. It will be protected with a Let’s Encrypt SSL certificate.
Are you using Cloudflare?
There are some additional simple steps when setting up a CNAME DNS record using the Cloudflare service.
You’ll find all the details on how to set up the UptimeRobot custom domain status page using Cloudflare in our blog post here.
The status page can be consumed with the unique link generated or under a custom domain by setting up a CNAME DNS record that points to stats.uptimerobot.com.
How to customize your status page?
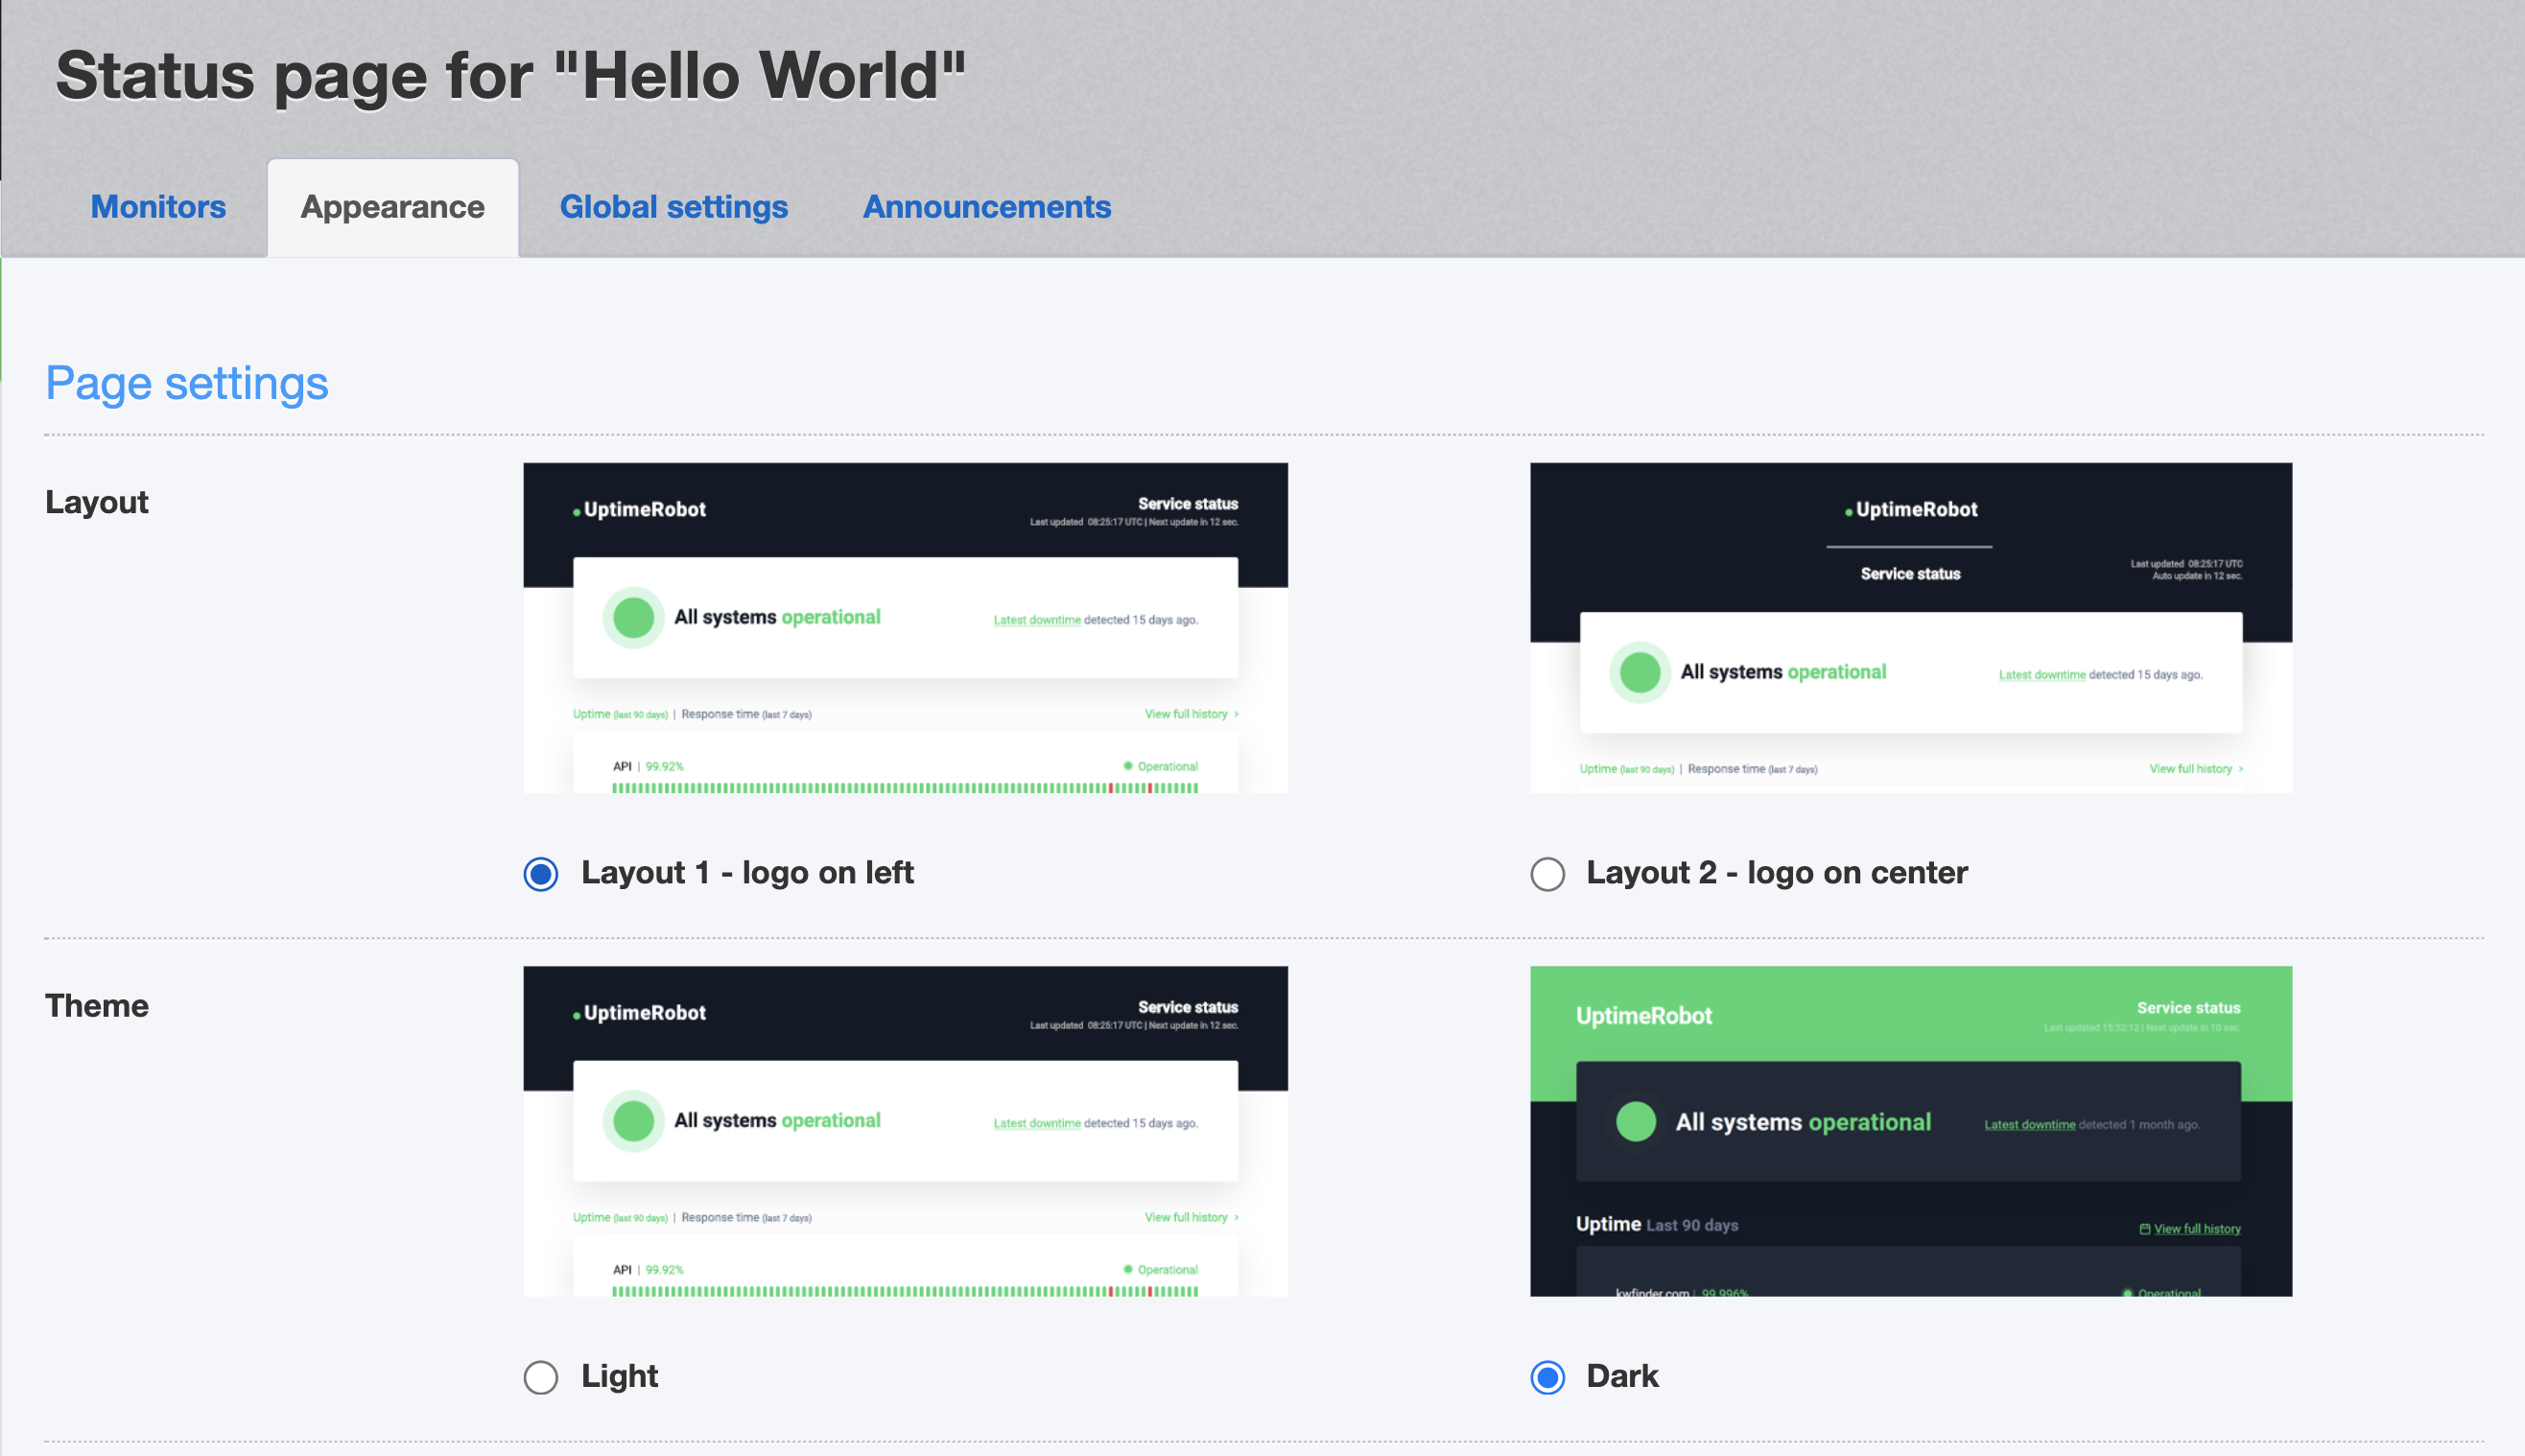
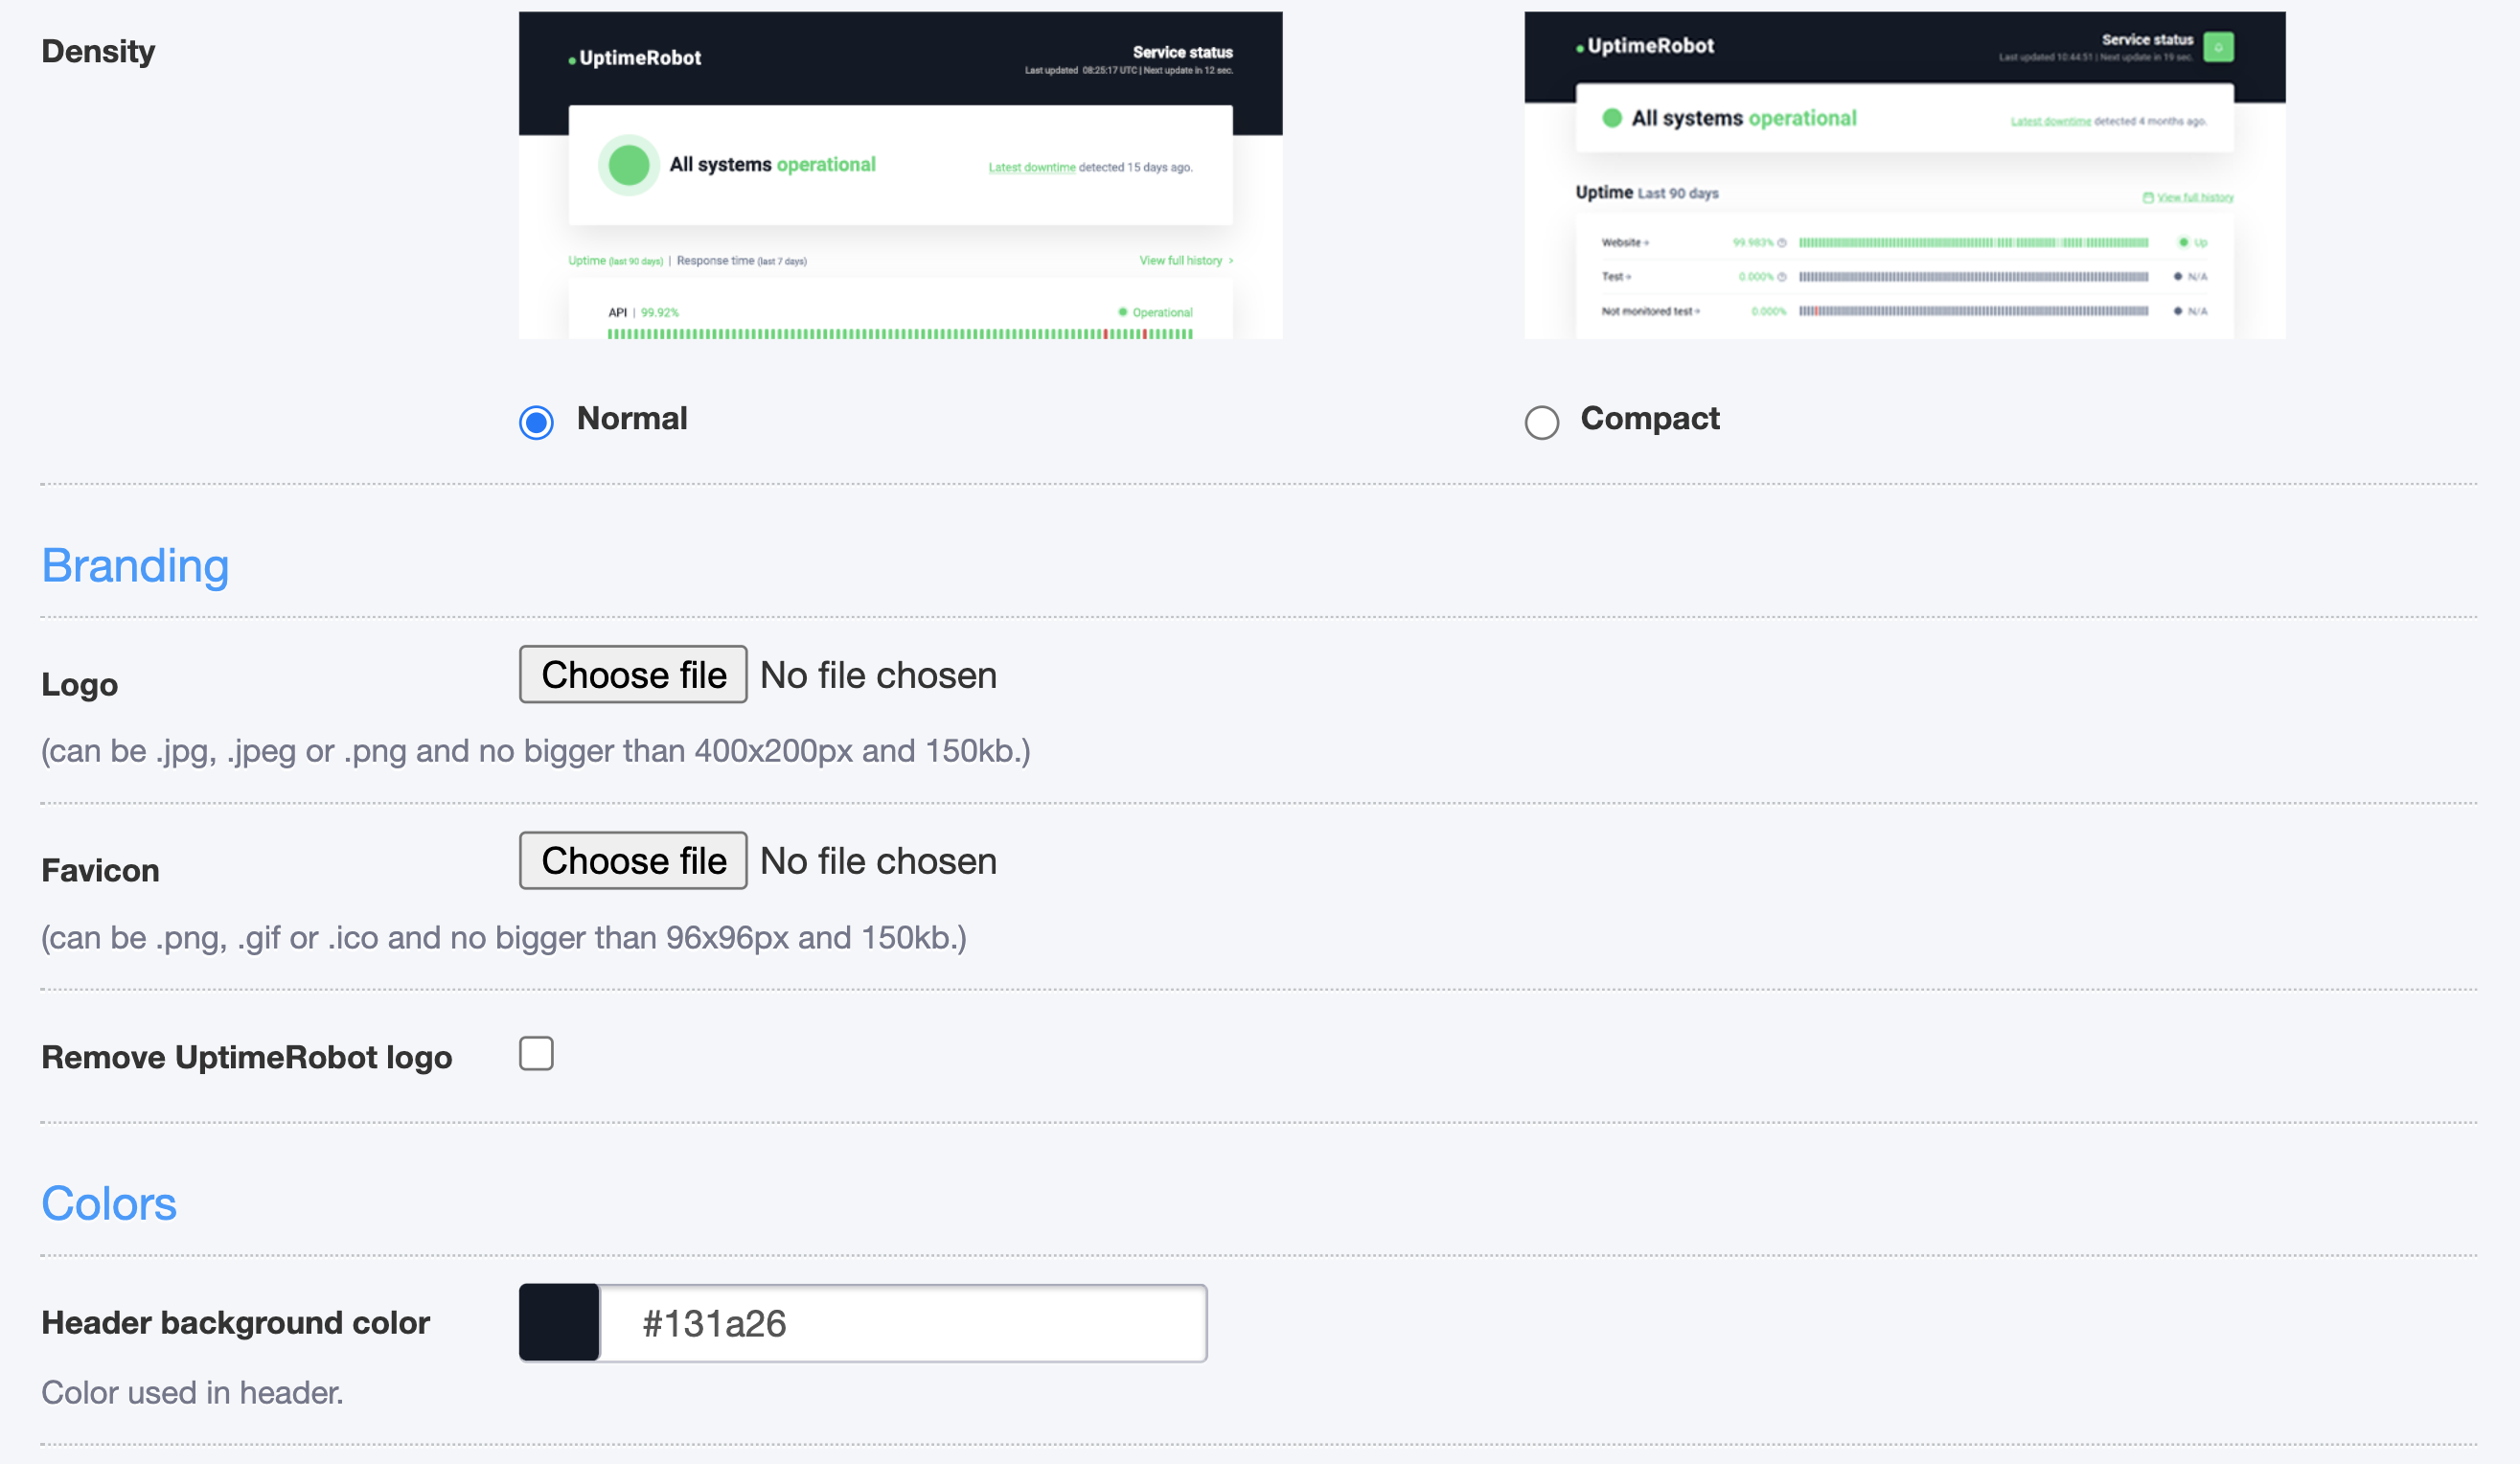
Change the layout, theme, or density of your status page. You can also upload your own logo and favicon.
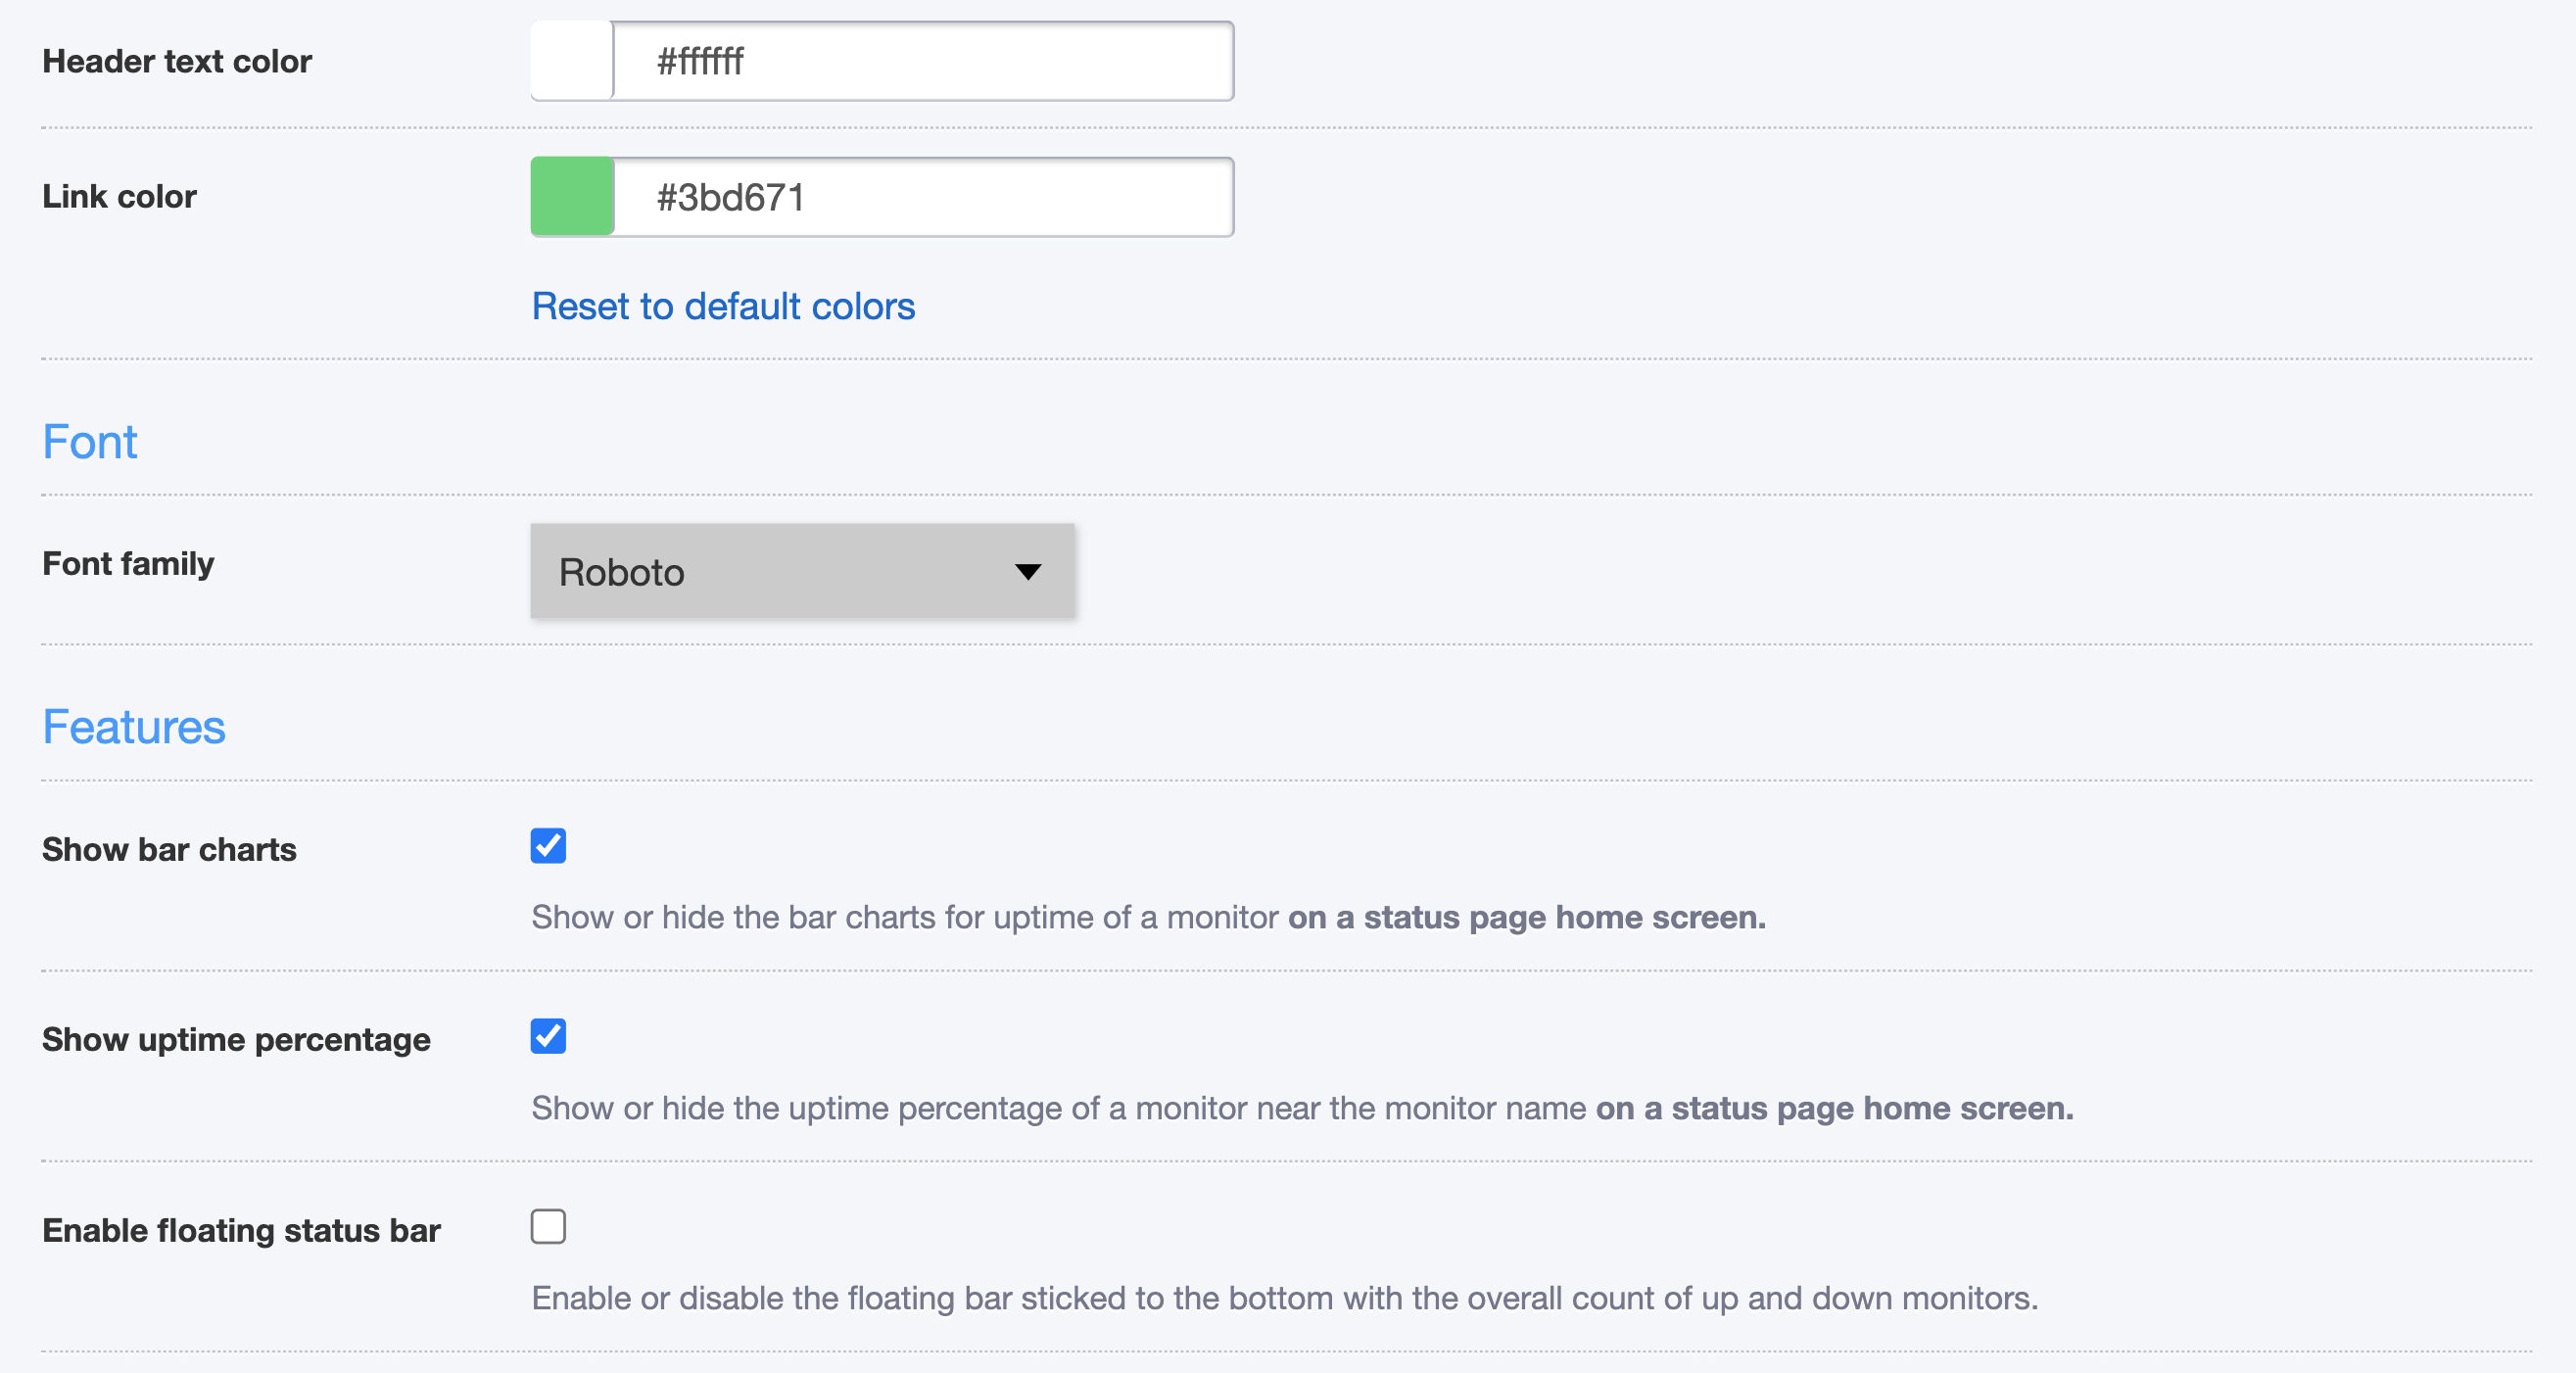
With a PRO plan, you can remove the UptimeRobot logo, change the colors or font of your status page and choose from different features.
How can I use the “Subscribe to updates” feature?
If using a PRO plan, you can enable this feature in your settings. Your subscribed visitors will receive announcements via emails.
Note: There are no limits on the number of subscribers and it’s not possible to add, remove or view them manually (they can unsubscribe from every announcement email).
You can enable this feature under Status Pages > Announcements. You can also preview the email there. Please, make sure you’re using a future date.
Emails will be sent with a 5-minute delay, so you can still make any changes.
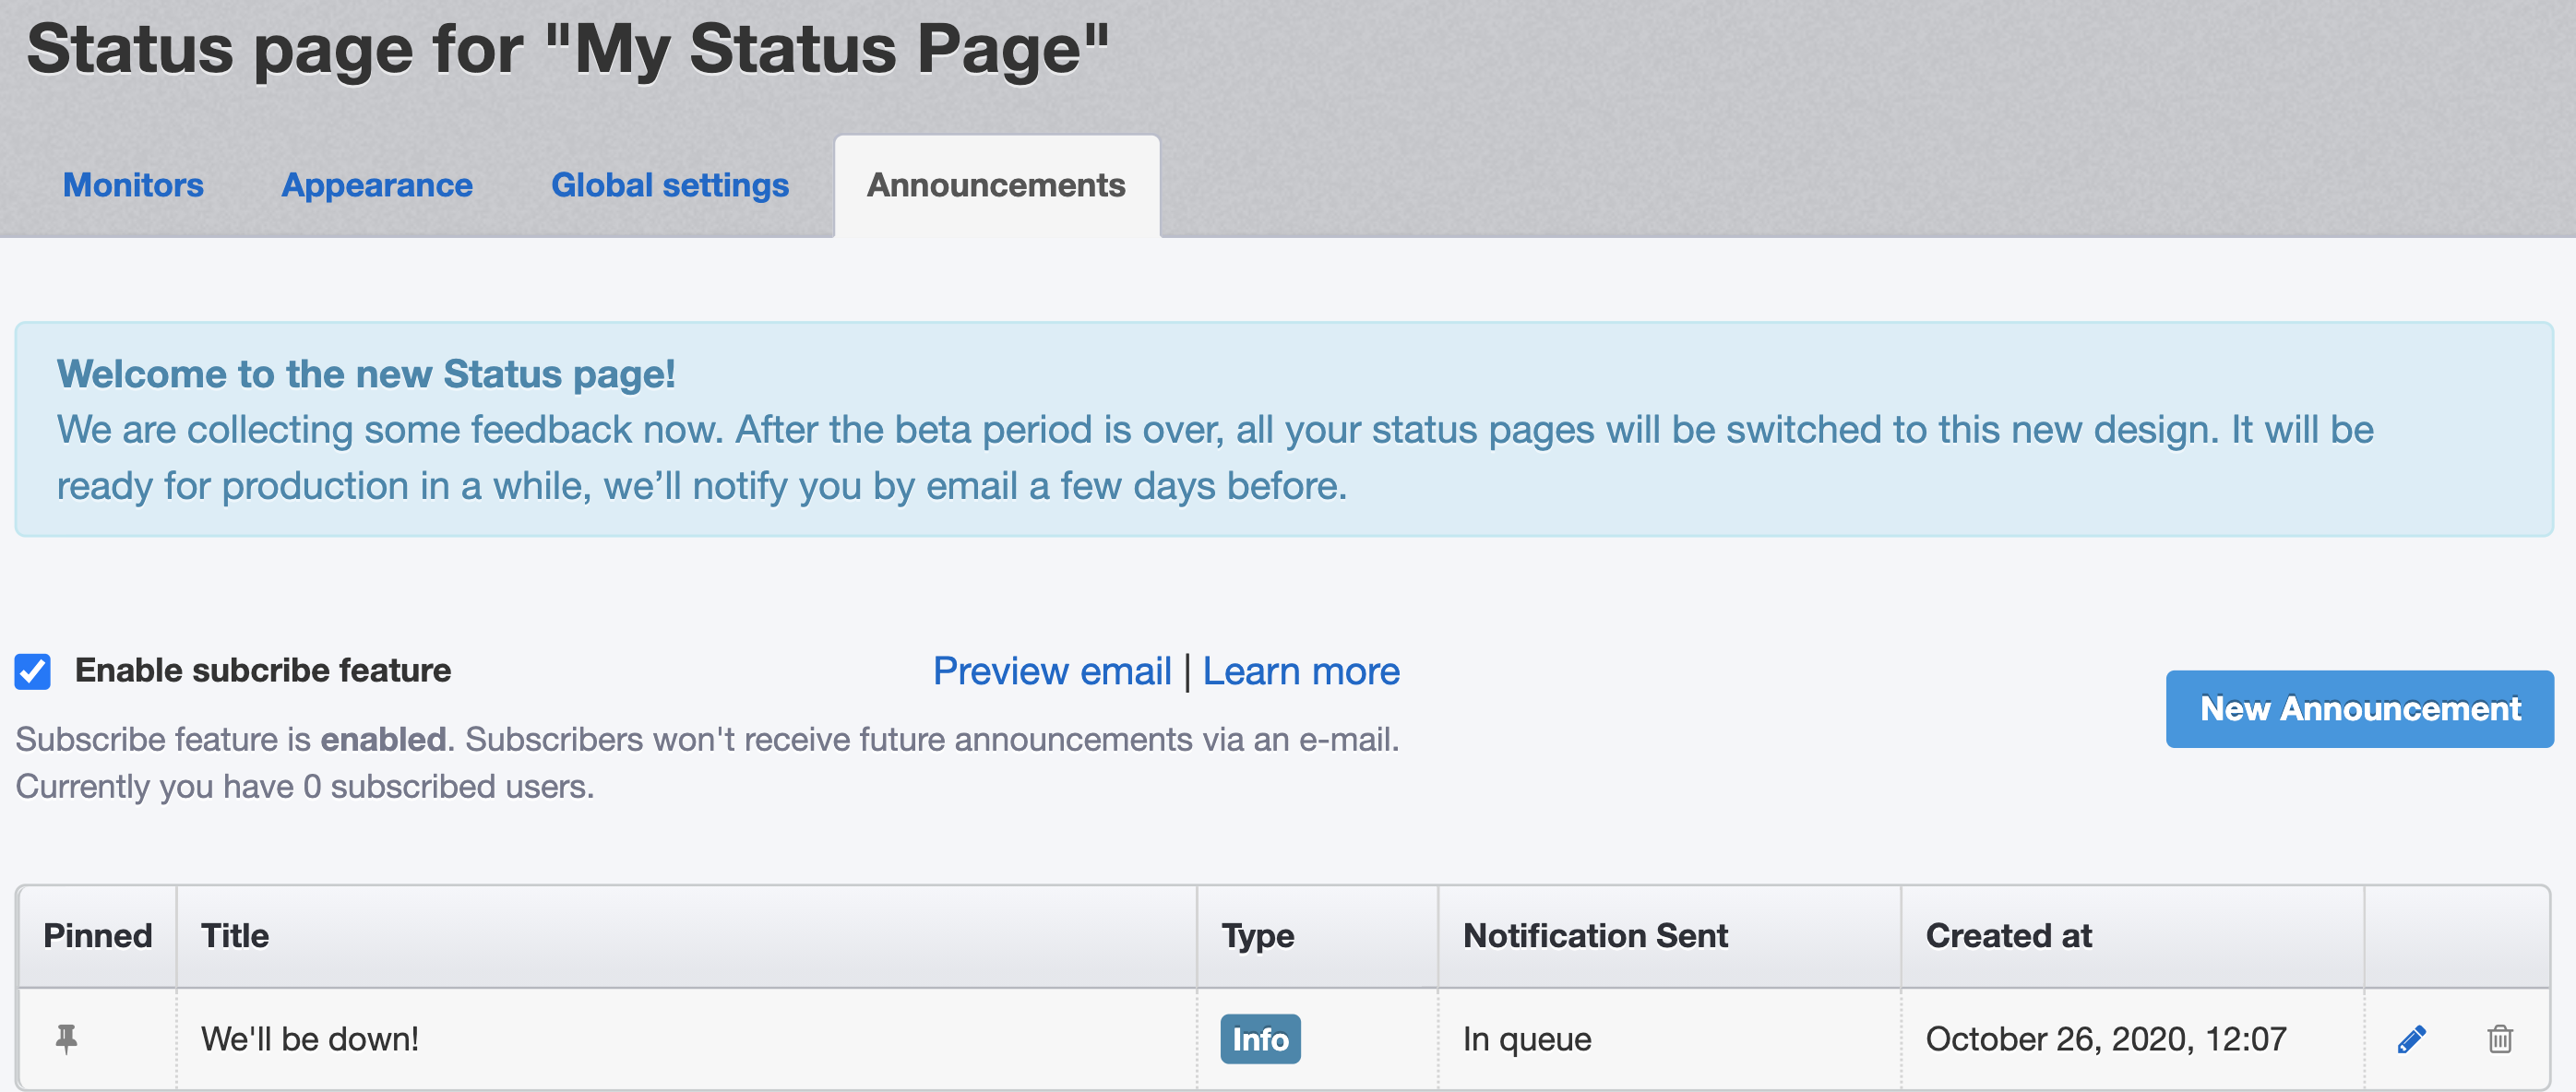
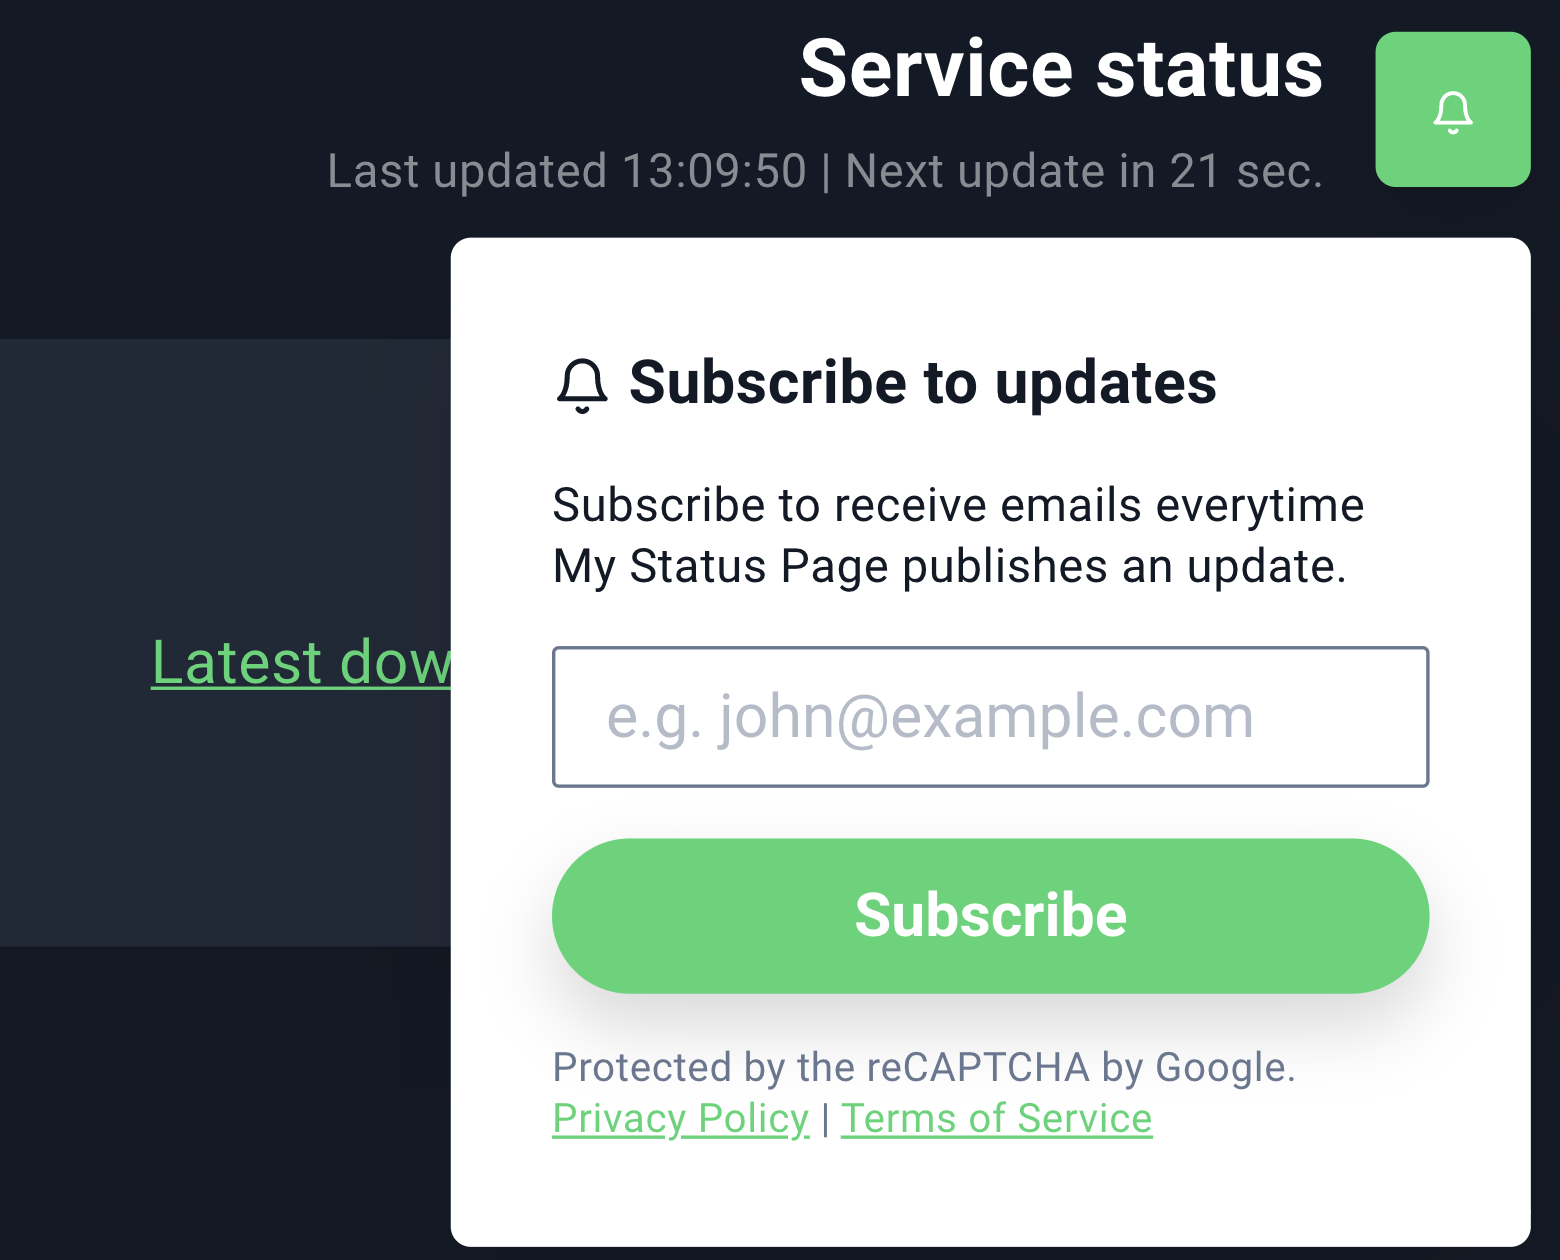
After you enable it, a subscribe button will appear in the top right corner of your status page:
This is how the email will look like:
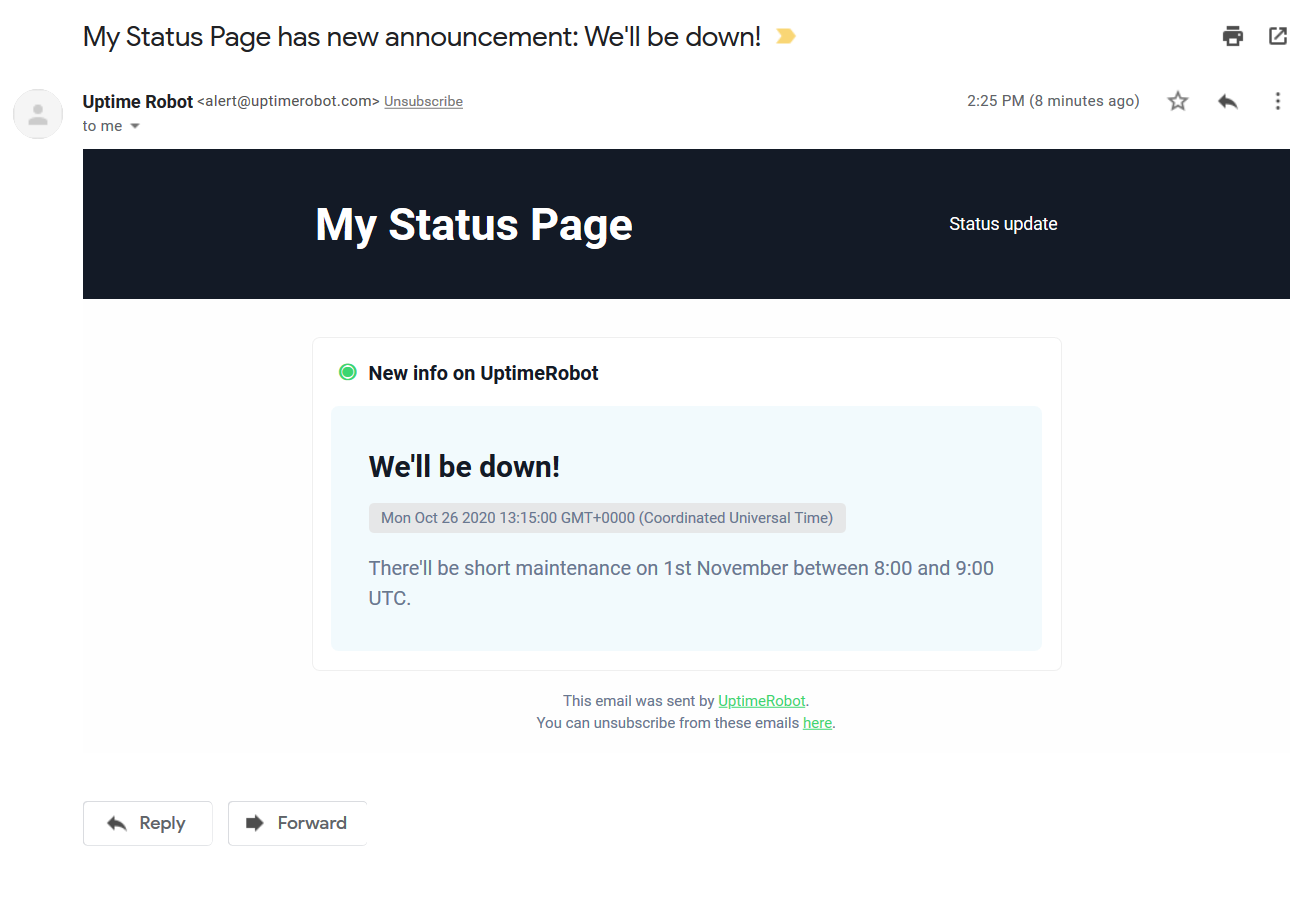
NOTE: If you want to send the notification please make sure you set the announcement start time to the future. It doesn’t work retrospectively. The announcement start time must always be bigger than the present time.
How can I track my visitors on the status page?
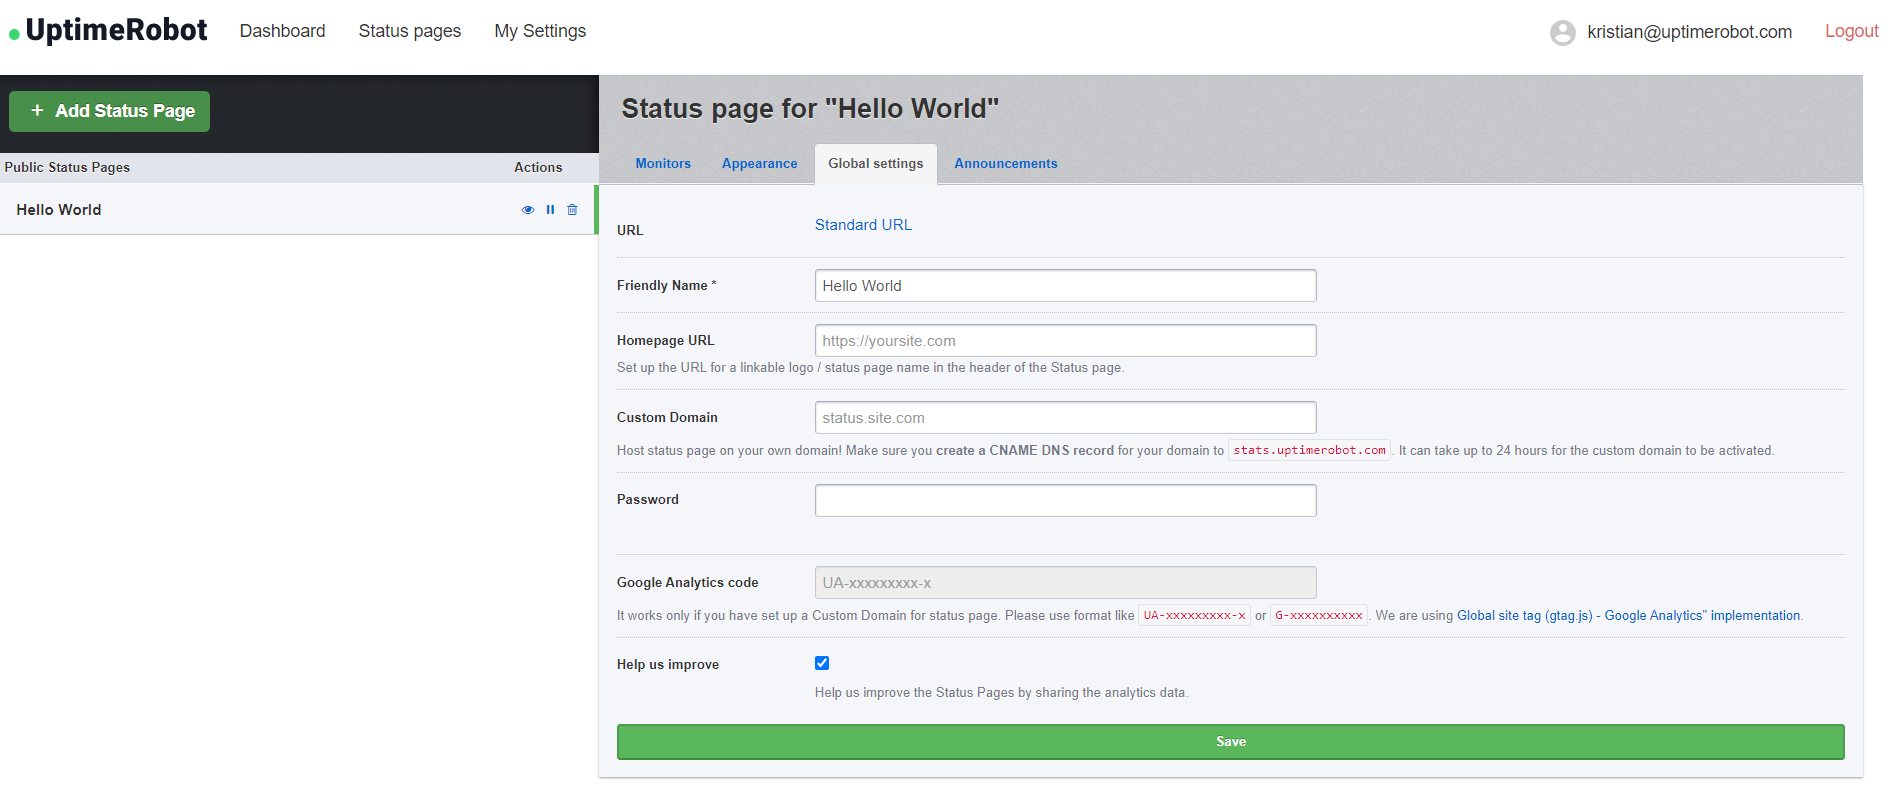
You can simply add your Google Analytics code under “Status page” > “Global settings”.
This is a PRO plan feature and you need to be using a custom domain.
How can I change the homepage URL?
As you might notice on the previous screenshot, you can also set up the URL of your logo or status page name in the header of your status page.
Add your URL under “Status page” > “Global settings” and click on the Save button.
How can I add and remove password protection?
Protect your status page with a password if you prefer it private.
Simply enter the password under “Status page” > “Global settings”.
If you wish to remove the password, click on “Change password” – the field will be empty. Click on the save button and the password protection will be removed.
173 Comments
Hi,
Sorting the monitors alphabetically would be nice.
Coming soon :).
What legend color mean, red orange
+1
This is awesome, thanks so much! Here's a few bits of feedback:
- The individual monitor screen shows blocks for the last 7 days above the graph of response time over the last 24 hours, but the former is in descending chronological order and the latter is ascending. While they don't cover the same amount of time, I think it would be more intuitive if both went the same direction.
- For organizational purposes, it would be nice if we could provide an alias for each monitor to be displayed on the public status page rather than the name used on the internal dashboard.
Great addition! Quick suggestions:
- Make it responsive
- Don't use the no-reply email. I was gonna email you guys but I couldn't
- Use a different service for this comments so that your users can upvote/downvote comments easily (or use a board with features to people upvote/downvote)
Adam & Gui,
All great suggestions and noted all. Thx a lot.
Super awesome! Would love the ability to show a longer period of time.
This is great!
Two things I'd love to see for this:
1) Let us edit the monitor names on the public status page. E.G., let us name a monitor "CMS cluster HQ1" for staff alert emails but have the status page refer to it as "Main website."
2) Let us re-arrange the order in which monitors are displayed on the status page.
Thanks!
Can you please add options for different date formats? We generally prefer MM-DD-YYYY here in the US so it's a bit confusing when we see it the other way around.
+1 - we would like this too.
Actually, in the US they generally prefer MM/DD/YYYY (with slashes instead of dashes). Europeans generally prefer DD/MM/YYYY (again with slashes).
The best date format in my opinion is YYYY-MM-DD: it puts the largest time units first and in order, so that if you sort the dates alphabetically, it also gets sorted chronologically. This is not a common date format, but it's started to gain popularity in software because of its ease of use and comprehension. Sadly, it seems some people are only copying the dashes but not the nice order-ability of the dates, leading to weird formats like MM-DD-YYYY. If you want to use traditional year-last formats, use traditional slashes too.
+1 for having a YYYY-MM-DD date format available.
Having said that: the status pages are a great new feature. Thanks!
YYYY-MM-DD is definitely part of international standard notation of dates called ISO 8601. It was created to remove ambiguity and confusion, like guess what 03/01/2017 means around the world.
Another +1 for YYYY-mm-dd date format (ISO 8601 date format). Indeed use of ISO 8601 for all time stamp elements is a good idea (IMHO) , again primarily for clarity but also for ease of handling in different software packages given sort by text is equivalent to sort by date.
Also I have been the victim of Euro/US date format confusion (not uniquely I am sure). The confusion can be costly.
We updated the date format to YYYY-MM-DD so that it is clear for all of us.
Great to see! Could you add TLS by automatically provision Let's Encrypt certificates? That would be especially useful with password protected status pages.
That is in the roadmap :).
Can you allow us to customize SSL certificate used for the page ?
Yay! Thrilled to see this new feature. Can't wait to test it out. Thank you SO much.
This status page is a great addition to Uptime Robot, and the features (custom logo and CNAME redirection) are great additions, well thought through!
However, the design needs a bit of correction: when there was a single downtime in the past few days that are displayed, the entire row of the monitor turns red, which is incorrect: only the day that had the downtime should turn red, the other days should stay green.
Another suggestion for the design would be to use different shades of yellow and orange between green and red to manifest different levels of downtimes. For example:
- 100% green
- 99.99% and below: yellow
- 99.9% and below: orange
-99% and below: red
The mentioned issue must be fixed now. We currently only display yellow for uptime % below a specific point but will definitely be improving it.
Thanks so much for this tool !!
If a host is added to the status page and then renamed in the dashboard, it throws an error.
This must be all fixed now.
The demo page is down. Do you have a status page for the status page?
It is all stable now.
Hi, nice new feature.
This is my feedback so far:
1) On my settings> public status page after press show them
the list is displayed ok but if you add a new page the buttons (edit,pause,delete) are added next to the page name instead of below of existing buttons.
You got to refresh the page to render properly
2) In the same list, the only way to access a page that is not using a cname (and you forgot or miss the link) is presing on edit button, then on url.
It would be nice/better/simple to add this link to the page name itself on the list, thus you just press on the page name (in the list of pages) instead to press edit and then on url.
If you are using cname, then the link should point to cname.
Regards
Thanks very much for the suggestions and we'll definitely be improving the UI there.
Nice feature, will surely test this out in coming days. Thanks for all the great work.
Does it support https?
As my website use Strict-Transport-Security: max-age=63072000; includeSubDomains; preload
No yet, however, it is in the to-do-list.
Wow that's cool. now the only thing missing would be the part to also record some outages to inform all status watching users that there is some work going on.
This would be great to have the ability to add outage report etc - similar to the statuspag e.io facility?
Could the quick stats be moved to the top of the status page?
We actually made our own status page as an Android app using your API and having a static screen in the office with the status ticking over is really handy!
It seems strange hierarchically to have the overview info after the individual status monitors.
Thanks for cool new feature!
Noted that suggestion.
I'm not seeing this under My Settings - is this a new feature that is only available in a Pro plan?
It is available for all users.
Awesome feature, thanks so much!!
We would love to put this on our monitors using just the smart-tv browser but all the monitors do not fit and the white background is consuming.
it seems nice, we can offer this monitor for all customer into our datacenter both in italy and latvia. what about API and whitelabel ?
The API and web-hooks are the way for white-labeling the service.
great feature!! many thanks for that. and now if we even could include at the status page our twitter status account that would be great! Or another possibility to write some outage status reports or work description and so on.
Thank you! However, please, use https:// instead of http:// for security reasons. One more suggestion, status javascript widget with green (everything up) / orange (some down) / red (all down) indicator could be also good for some web apps.
This is awesome, thank you very much.
Great work. You are busy with the mobile app and now this!
Absolutely dig it - thanks!
Hi there, this looks really nice!
Will these features become available through the API as well?
Thanks!
One question, on our status page (http://status.serverastra.com/) Overall Uptime is lower due to addition of new monitors, can it be fixed (like if monitor did not exist then don't count it as downtime (and don't draw those meaningles 0% boxes for them))? Also yearly uptime would be nice as well
That must be fixed now and we'll definitely be adding ratios for a longer history.
This feature is great! Can this page add SSL?
Nice! I have some suggests:
- Using SSL
- Combine multiple monitors into single service, user only need to know if the service is working, not every server's detail
Thanks!
Hi
Was hoping the "coming soon" sign on public status pages would not take too long to be removed, so I'm happy it's here today.
It's not exactly what I had hoped for actually. I can see the direction you have taken when designing it, and it seems to be geared toward startups and tech companies, who care about API response time and such.
I was hoping for something more helpful for regular web sites owners: a page:
- displaying simple uptime stats for the pas few days: you got that, but added much more data that's only useful to few people, and confuse the page very much.
- helping to communicate with customers while the site is down: posting messages, updates and keeping a brief history of past downtimes
When I look at the status page today, I would like:
- "Monitors" should be customizable. It has no meaning to a customer. I'm sure that's coming though
- Type and interval columns to be removed: that's just internal tech stuff
- option to entirely remove the "response time" graph you get when clicking on a monitor. Response time history over time is tech stuff, not for customers (unless you sell an API, which is less frequent than having a website)
- "Quick stats" appears to be a counter of events. I feel this has limited value and takes up space (yep,you had only 2 downtimes last 6 months, but what if one was 12 hours? only % have a real meaning)
As for helping to communicate with customers in case of downtime (ie posting messages), maybe that's part of the "more customization features"?
Cheers
Thanks so much for the suggestions.
We actually want to cover many use cases and this was the initial version of the status pages.
And, we are working on customization of them. It is hard to find a balance between usability and simplicity :).
Congratulations. Great and excellent service!!
Very nice idea, thanks!!!
Would be nice customise the page to
- Ordering by name
- Option to showor hide fields (like only quick stats or hide the time/days/periods)
- Customise the colors
But overall, very pleased with this option !!!!
Keep it up :)
Gr Sander
Just thought I'd let you guys know I'm intermittently getting 503 bad gateway error when I go to http://status.uptimerobot.com/
and when it's up it's very slow.
It is all stable and faster now.
Hi!
Great job.
Its possible select language? For example, show uptime robot in spanish.
Thanks!
Sorry but not yet.
Would love to see a feature like this too. We use your awesome service and offer our services to spanish speakers.
Pura vida!
Thanks for bringing the public status page/s. Moving all my uptime monitoring domains here.
Great feature - thanks!
Can we pass the password in the URL or via POST ?
Hi,
I'm testing the new feature here. I noticed that the page asks to hit the password again once after 1 hour logged in. Is that someway to keep it logged in full time?
Thanks
Great feature.
However I would like to see one improvement.
I just added 3 new monitors and added them to the new public status page. The overall uptime is dropped to ~40% because there is only data since today. Because there are no interruptions during monitoring I think this is not correct. The unmonitored time could be grayed out or something like that and not counted as downtime.
We have applied that update.
This is fantastic! Thank you so much for continuing to improve this service. I love the simplicity of it and clean interface.
What are the maximum dimensions for the banner on the public status page? I was told my banner was too large, but don't see anywhere this size is published.
The sizes are shared in the add/edit status page dialog.
This is SICK! Thank you
It would be nice to group monitors. Lets say I have four monitors on the same piece of equipment keeping track of port 80, 443, 8080 and 8443. Lets say this server hosts our external website. What I want is the ability on our public status page to have the service name "Public Website" and have these four monitors all build the data for this public status page element.
Additionally it would be nice to have these monitors roll up in several different ways. In example:
1) If one monitor is down the service is down
2) if one monitor is up the service is up
3) If one monitor is down then the service is 75% available
That being said this is great and will make consuming our status so much better.
Thank you!
Nick
Totally understand the need.
We plan to make this possible once we add a "grouping feature to the dashboard too".
What about the grouping feature? The only thing which we did not move to UpTimeRobot is that we cant group our monitors. (And grouping them in statuspage)
Hi Aron, this feature is planned but there's no specific date for it yet, unfortunately. We'll make sure to announce it properly in one of our updates blog and on our Social Media when done.
Love the new feature, thank you!
Is anyone else having problems with the password-protected status pages. It keeps prompting for a password. Eventually, I just refresh the page and it loads the status information.
I'm having the same problem, it seemed to resolve and let me in, however the data that was there for my monitors is now saying NaN% for everything. I've previously set this up and it was working perfectly before. I'm now trying to figure out what happened.
I have a free account, so I can't bitch too much.
This must be all resolved now.
Nice job. I seem to be getting multiple login popups for the password feature.
Allowing clients to subscribe, to get notified once server is back online via email?
That seems like a great addon for the Pro plan.
+1 to this suggestion. Would love an ability to expose an RSS feed specific to the monitors on the public page to allow others to subscribe.
That is a planned feature :)
What about SMS notification to subscribe to updates?
Thanks for feature ;)
but what about dashboard for month (or last 30 days) ??
Ah,glad to know the status,and i tried added 2 monitor, and is there any guide where to "get the unique link" at the section titled "Public Status Pages" of dashboard,or need submit some request? greetings!
Are there any plans to increase the shown timespan? I would be super nice to see the data for the last 3 months. So you could generate a report every quarter of the year.
Thanks
Yes, we will be displaying more data soon.
Hi - do you have any update when you guys will be able to publish more data? Its a great tool and the teams are seeing great benefit in the response time trends - its just fairly manual atm & being able to look at trends across a week - 3 months would really help.
Thanks!
Hello,
I have the same requirement for 1 month on Public Status Pages.
Any chance to add it ?
Hi, Any further update on this, as we have a requirement to show the last 30 days of uptime.
Thanks!
Hi Kevin,
we are currently working on a complete redesign of our status pages, so stay tuned!
Absolutely brilliant feature guys, I'm really impressed.
From a corporate perspective:
- I'd look at ability to style the pages. Arguably i wouldn't expect that in a free version.
- I'd second the ability to remove certain features, I'd like perhaps a board I could give my devops teams, and another which I might use as an externally facing board for stakeholders or management.
- SSL would be brilliant on it
Great feature!! Actually this could have been a pro-addon all over (not only the branding) but makes me appreciate it even more :)
One thing though: Passwords like GZdNh7Fn&2aPffdQ>s do not seem to work, getting rid of the special symbol / chars solved it.
Cheers + keep it up
Please add no-index rule at robots.txt
http://stats.uptimerobot.com/robots.txt
https://www.google.com.br/search?q=site:stats.uptimerobot.com
I updated and added a new status page, set CNAME in DNS, the uptimerobot url works fine, the cname though I get an error
502.3 - Bad Gateway
Most likely causes:
The CGI application did not return a valid set of HTTP errors.
A server acting as a proxy or gateway was unable to process the request due to an error in a parent gateway.
Things you can try:
Use DebugDiag to troubleshoot the CGI application.
Determine if a proxy or gateway is responsible for this error.
Detailed Error Information:
Module ApplicationRequestRouting
Notification ExecuteRequestHandler
Handler ApplicationRequestRoutingHandler
Error Code 0x80072efd
Requested URL http://status.ourdomain.com:80/
Physical Path C:\inetpub\wwwroot\stats.uptimerobot.com
Logon Method Anonymous
Logon User Anonymous
Must be all fixed now.
Is there a possibility to set the time zone?, because it is not taking the area that you have configured in the system
It now works with the account's timezone.
this is fantastic. thank you so much!!! saves a lot of people a lot of headache here!!!
Like everyone else, I think this is a great move. There have been some excellent suggestions in comments too, although surely not all of them can be implemented.
Please consider this one:
- Add a label or comment for downtime events
That way the 'Latest downtime' will be labelled. And if you move to show an optional list of events, they too will be labelled.
It doesn't seem as important until you have faced downtime and need a way to report the cause publicly! Otherwise there is no confidence for the viewer when they are simply seeing that the downtime was *reported*, without any sort of comment/followup/reason.
Thank you.
Thanks so much for the suggestion and we are planning such an update.
The Page Load is very long, here my MTR Check:
uptimerobot.com:
http://prntscr.com/cvy7u4
blog.uptimerobot.com (better):
http://prntscr.com/cvy8fy
Must be fixed now.
Great tool, thak you. But CNAME is no option today with more than 50% of internet has https.
Or you use a CloudSSL cert and add all our hostnames to your cert?
Other solutions?
br,
lautrivta
Public Status Pages looks great, I will definitely try it out.
That's a great feature !
Is an option to hide certain columns somewhere in the to-do-lis?
I'd love to see this as a 3rd party data source for my public metrics on statuspage.io
I have set up a public status page and added a cname to my domain (http://status.rwshosting.com/) to point to stats.uptimerobot.com but it shows a Bad Gateway (502.3) error:
Detailed Error Information:
Module ApplicationRequestRouting
Notification ExecuteRequestHandler
Handler ApplicationRequestRoutingHandler
Error Code 0x80072efd
Requested URL http://status.rwshosting.com:80/
Physical Path C:\inetpub\wwwroot\stats.uptimerobot.com
Logon Method Anonymous
Logon User Anonymous
More Information:
This error occurs when a CGI application does not return a valid set of HTTP headers, or when a proxy or gateway was unable to send the request to a parent gateway. You may need to get a network trace or contact the proxy server administrator, if it is not a CGI problem.
Does anyone have any ideas what might be wrong?
Thanks
Robin
It's ok it seems to have started to work now after first showing the CGI error then displaying NaN and no monitors for a little while.
I must just need to be more patient!
Https must be urgently available. Otherwise, there is always an error when using Cloudflare https
It would be nice if you can write a text on the status incidents so that customers know the failure is known. Similar to CachetHq
You guys just introduced these are the right time, was thinking of jumping ship to a system that supported public facing pages.
One thing that competitors can do, that it would be great if this could do - would be for an admin to be able to put comments again a 'down' result that could explain to a client what caused that, as apposed to a 403 just saying 'forbidden' under reason for example.
Otherwise, fantastic update!
I am also getting a 502.3 Bad Gateway error after setting up a CNAME in godaddy.
It would be nice to add more color themes (dark, ...)
---
Great feature! Thank you.
I can't get the custom cname to work.
Could someone explain how to add custom cname record in cpanel? e.g. if I want to use status.mypage.com how would I enter that ?
In cpanel advanced DNS editor, it shows the following fields: Name | TTL | Class | Type | Record
I entered like so:
[Name] status.mydomain.com. (note period at end is required)
[TTL] 14400
[Class] IN
[Type] CNAME
[Record] stats.uptimerobot.com
So the entry line looks like this:
status.mydomain.com. 14400 IN CNAME stats.uptimerobot.com
When I check mxtoolbox some hours later, the cname does not show up. Also tried going to status.mydomain.com and I get a basic "not found" page.
What am I doing wrong ?
One other question: if i use custom domain, will I still be able to access the status page using the uptime robot generated URL?
Thanks
Alex
Just entering "status" (rather than status.mydomain.com) must be enough for the CNAME record.
Süper bir hizmet very nice umut kardeşim şimdi yeni açtığım site olan canliradyodinle.life yi ip olarak ekledim bi sorun olmaz heralde?
Great! Please add many translations (I can help with Polish). ;)
If I try to embed this page into a SharePoint 2013 page using the Page Viewer web part, the Uptime stats page does not load. It just hangs on the "Loading" animation...
Is there another way to embed this into a SharePoint page?
Sorry but no options for embedding yet.
Embedding options would be great. Up to you if it's on free plan or not.
Love it but your SSL chain is not installed properly and it is hard to reach, can you fix?
https://www.ssllabs.com/ssltest/analyze.html?d=stats.uptimerobot.com
Hi!
Where to find URL of Statuspage after setting up?
Thx,
Michael
It can be found in the "edit status page dialog"
I created my Public Status Page, not using a custom domain (perfectly fine with the default), however I cannot find the URL for the PSP. You mention it should be in the Edit PSP Dialog Box, but there's no URL in that dialog box except for the greyed out one (status.site.com). Have looked everywhere for the URL.
Any news on https with HSTS? Chrome complains about the certificate when visiting my custom subdomain, and of course I cannot just use http, because my Http Strict Transport Security is including subdomains and such doesn't allow it.
All HTTPs now :).
This is great, and I can't believe I only just came across it. Many thanks, it's really useful for my devops teams to see it.
would be nice to have an updating "badge" that only shows the number of sites up/down.
obviously would link to the more detailed status page but great to put on a support site for a quick glance.
Great service guys, really enjoying it!
+1 for this. Or have a color coded system indicating sites that are up or down at any particular time.
Moreover, a cumulative graph/grid showing the extent of downtimes over a select period of time will be awesome.
This is AWESOME.
Be awesome to let people subscribe via email on the free plan.
But on the paid plan, let them subscribe via other methods. On the paid plan, let the admin actually email users directly...and maybe add statuses to the stream.
Any chance of having twitter profile integration or custom announcement text on status pages? Would be nice for people to know why something is down, not just that it is down.
Yes, I would like to see this too :-)
You guys are so cool. Thanks for this. This is good!
Public Status page is awesome. Would love to sort via status, ensuring that the monitor that is down jumps to the top of page 1
Sorting options now exists.
Love this!! Thanks!!
I just added a CNAME for my public status page and it just throws a:
ERR_TOO_MANY_REDIRECTSBest wishes,
-k0nsl
I set my status page up last week and it was working great but today the page just sits at the loading animation and never populates. Is there an issue with the public pages at this time?
Sorry for that temp issue. All stable now.
A small space where insert custom message in the status page can be useful. For example motivate some down or alert the user there is a work in progress ... add a small place where add a visible custom message in the status page can be very useful :D
thanks a lot
I have a small hosting company, It helps me and my clients to see server status easily. Thanks UptimeRobot team for this
Hi,
I have an issue with gcb domain (domains with german umlauts).
I have a domain like xn--domin-ira.de and set a dns cname for stats.xn--domin-ira.de to stats.uptimerobot.com. and if i enter stats.xn--domin-ira.de it open a page with:
page not found
DNS shows:
nslookup stats.xn--nhteufelchen-gcb.de
Name: stats.uptimerobot.com
Address: 69.162.67.141
Aliases: stats.xn--domin-ira.de
I think there can not detect the domain correctly.
best regards
Torsten
We also recently discovered this bug and it is now a task for our dev team which must be fixed soon.
Embed options would be great. A simple light when clicked to take user to full status page. Easier to embed on website.
I'm lovin' (and using) this! This is a great service for my customers. I ditto the embed idea but I got over it by using an iFrame. Thanks much, Uptime Robot, impressive!
Would be awesome to be able to add notifications or inject custom HTML from services such as HelloBar, Tawk.to, Intercom, Zop.im etc...
Hello,
We are using the status page with password protection on a Chrome Bit to show on a TV so we can monitor some sites.
Currently we are having the issue that we get signed out after few hours.
Is there a way we can store our login session for 2 weeks or so ?
Or are there any other people with this issue whom might have found a work a round.
Kind regard,
Roel
Sorry for the trouble and this is all fixed since the last few months.
Would love to see our status twitter stream in the status page.
We do communicate maintenance, issues and updates through twitter.
Combining both uptime robot and twitter timeline would deliver a one stop status page solution.
The twitter integration would happen in the browser, performance impact would be close to none.
We are planning to add this within few months.
I am trying to activate a custom URL for a public status, and everything seems to be ok, but when I press custom URL in order to get it, it doesn't work.
Does it take a while?
Thanks a lot!!
It usually takes few minutes after the CNAME DNS records are created but can rarely take up to few hours (due to DNS propagation).
Tebrikler. Uzun zamandan beri beklediğim özelliklerden biriydi. Bunu ileride bir Wordpress eklentisi ile birleştirebilir ve ciddi backlink çıkışına dönüştürebilirsiniz.
Başarılar!
Noted all those great suggestions, thanks a lot and we'll soon be adding more options to the status pages.
It would be nice, if (after nearly two years) there would be an option to customize the colors of the status page.
Hi Sascha, we are happy to inform you that you can customize your status pages now :) Let us know if you need any assistance!
I'd like to see a way to customize the look of the status page, tailor it to the look and feel of our company, as well as adjust what is displayed and the sizes of everything. We have a static monitor that we use for at-a-glance status of our servers, but with the current layout, there is a lot of dead space, and it doesn't look too great. That ability to customize this would be greatly appreciated!
The logo replaces the "friendly name" (basically the title) at the top of the page. Once a logo is added, I can't find any way to remove it. Do we have to delete the entire status page and build a new one?
Cancel that. Went back in a couple of times and now there's a remove logo link. Weird it didn't appear straight away.
Why only 7 days for the status report?
Can we also have month report in there - is this available in the pro plan ?
Also - can we please have incident pagers?
Hi Colin, you can currently switch to a monthly view, with a Free Plan there are 2 months old logs available, with the Pro Plan 2 years. We are currently completely redesigning the status pages though, they will look much better with more features added! :)
Hi Kristian,
Can you let us know a little bit more about the schedule?
Thanks,
Erik
Hi Erik,
it's hard to say at the moment, but within a few months, hopefully :)
this is very well hidden, i didn't find it without googling
Custom sorting of monitors in status page when? Very much wanted :)
It's noted! Thank you for your suggestion. Currently, you can sort them by name or status.
+1 for custom sorting
Just confirming, I tried to setup my custom URL for my status page by creating a CNAME record with Target - "stats.uptimerobot.com."
but its not working, does it need the "." after com?
please help
Hi, you don't need the dot after, but it might take up to 24 hours to become active, sometimes longer. Let us know if you have any issues on support@uptimerobot.com and we'll be happy to take a look at it, thank you.
Hi,
Please can you allow the public status pages to be embedded in an iframe.
I'd like to directly embed this in my website, but it's currently blocked - other pages work fine though.
Many thanks,
Gordon
Hi Gordon, it should be possible with the PRO plan, please contact our support if you need any further assistance.