When systems get noisy, more data does not automatically mean better visibility. The right observability tool helps you spot abnormal behavior, trace it back fast, and figure out whether the problem sits in the app, the infrastructure, or the user path.
For many teams, UptimeRobot fits that first layer well because it gives you fast visibility into availability, response time, SSL, domains, and other core checks without a heavy setup.
After that, the real decision is about fit. Some observability tools go deep on logs, metrics, and traces. Others lean toward simpler alerting, easier setup, or better control over cost and complexity.
This roundup compares the top observability tools of 2026 so you can narrow the list faster and choose the one that matches your stack and the way your team works.
What are observability tools?
Observability tools are instruments designed for software engineers and DevOps teams to gain in-depth insights into their systems. These tools go beyond data collection and allow teams to actively interrogate and explore their systems in real-time.
With observability tools, professionals can track down the root causes of issues, observe trends, and keep their services running smoothly and efficiently.
This suite of tools typically includes capabilities for handling logs, metrics, and traces, which collectively form the backbone of a full and complete observability strategy.
How we chose the best observability tools
Choosing the right observability tool for your organization involves a detailed evaluation process. Here’s how we determined the best tools:
- Understand requirements: Identified specific organizational needs like real-time analytics, microservices support, or security features.
- Evaluate capabilities: Assessed functionalities such as data collection methods, analysis and visualization, alerting systems, and tool integrations.
- Scalability: Ensured tools could scale with organizational growth and handle expected data volumes.
- Integration options: Looked for integration capabilities with existing technology stacks.
- Community and support: Considered the availability of community support for open-source tools and vendor support for commercial ones.
- Cost analysis: Analyzed the total cost of ownership, including deployment, training, and maintenance.
- Security and compliance: Verified adherence to industry security standards and compliance requirements.
- User feedback and reviews: Reviewed testimonials, case studies, and user experiences to gauge reliability and ease of use.
Top 10 observability tools
Choosing the right observability tool can be a game-changer for your organization, allowing you to dive deep into your system’s performance and anticipate issues before they escalate.
With a plethora of options available, selecting the best fit requires a detailed look at what each tool offers.
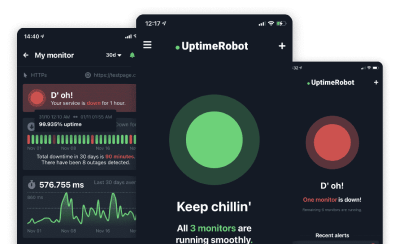
1. UptimeRobot
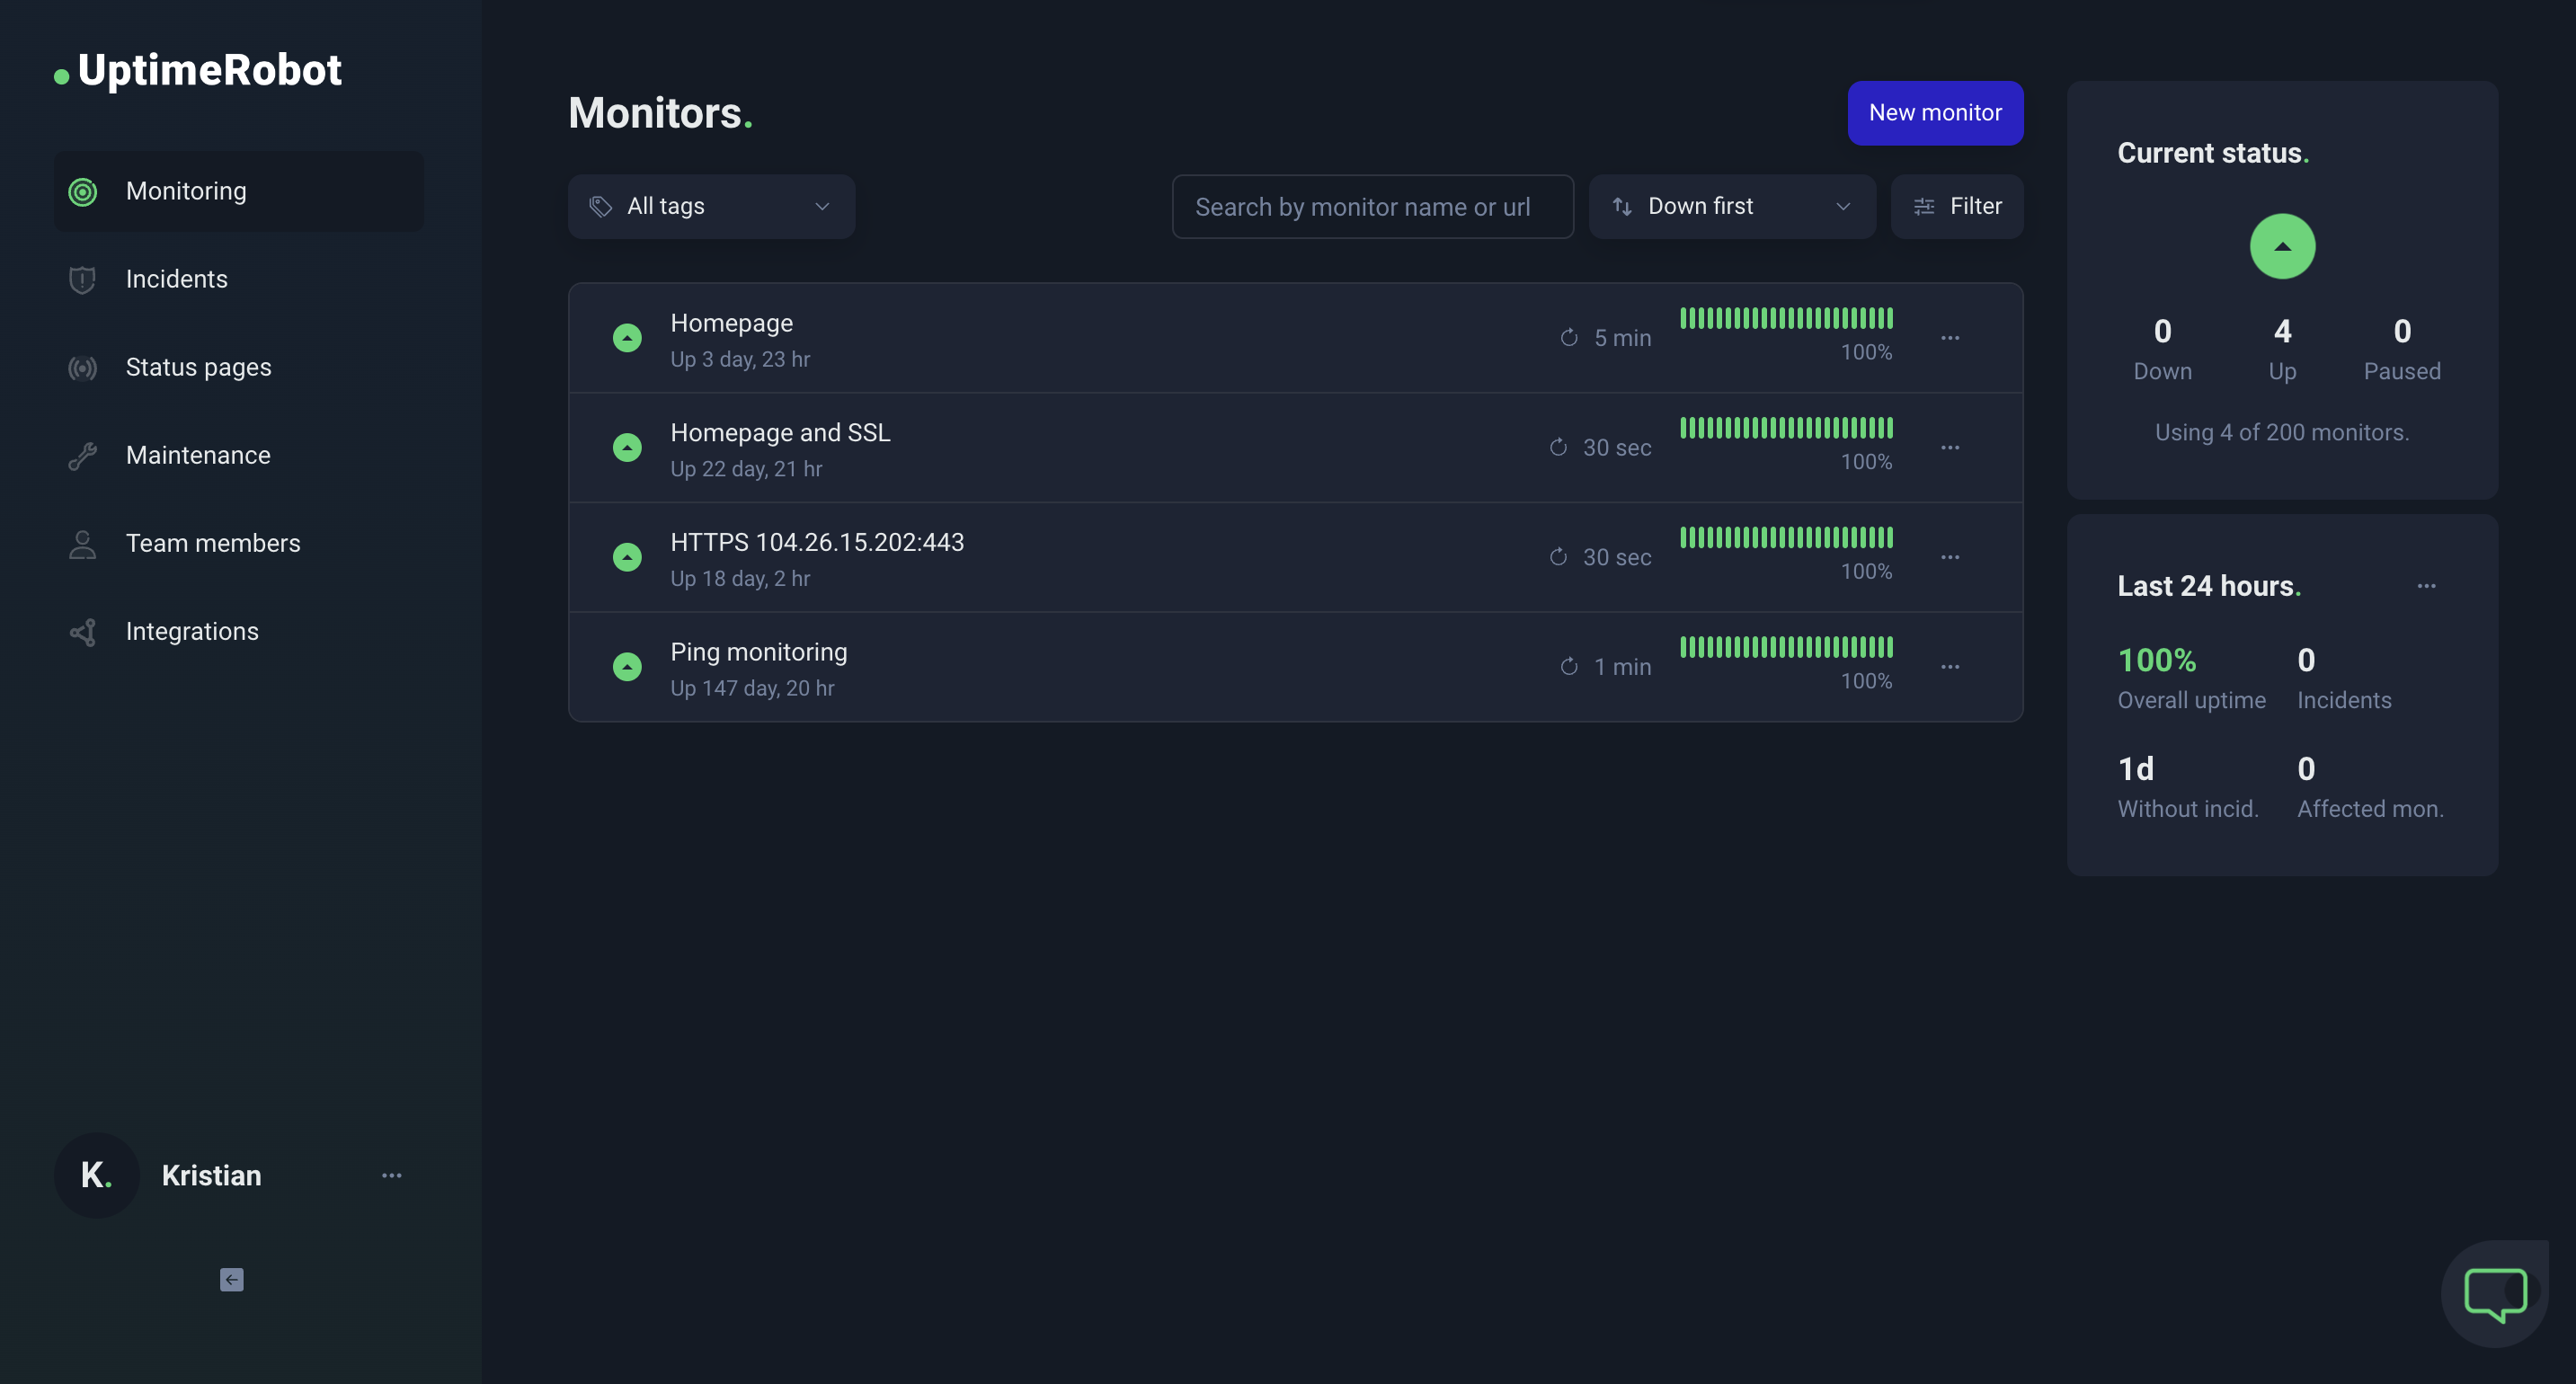
UptimeRobot simplifies observability for developers and IT teams, focusing on uptime monitoring with a user-friendly interface.
It’s designed to offer straightforward yet effective monitoring solutions, ensuring your websites, servers, and APIs remain operational and responsive.
Best features
- Comprehensive monitoring: Tracks the uptime of websites, IPs, ports, presence of keywords in the HTML code, cron jobs, domain expirations and SSL errors and expirations.
- Instant alerts: Sends notifications through email, SMS, webhooks, and popular third-party integrations like Slack and PagerDuty.
- Detailed reporting: Provides insights into uptime, response times, and downtime causes to help identify and resolve issues promptly.
- Status pages: Offers customizable public status pages to communicate system status transparently with users or customers.
- Easy integration: Features a powerful API for seamless integration with your existing tools and workflows.
Pricing
- Free plan: Offers basic monitoring features for 50 monitors with 5-minute check intervals.
- Pro plans: Start from $7/month, providing 1-minute or 30-second checks, advanced features, and up to 17 native integrations for your favorite programs.
Consumer score
With a score of 4.7 on Trustpilot, users love UptimeRobot because it’s straight-forward, and easy to set up and use.
2. Dynatrace
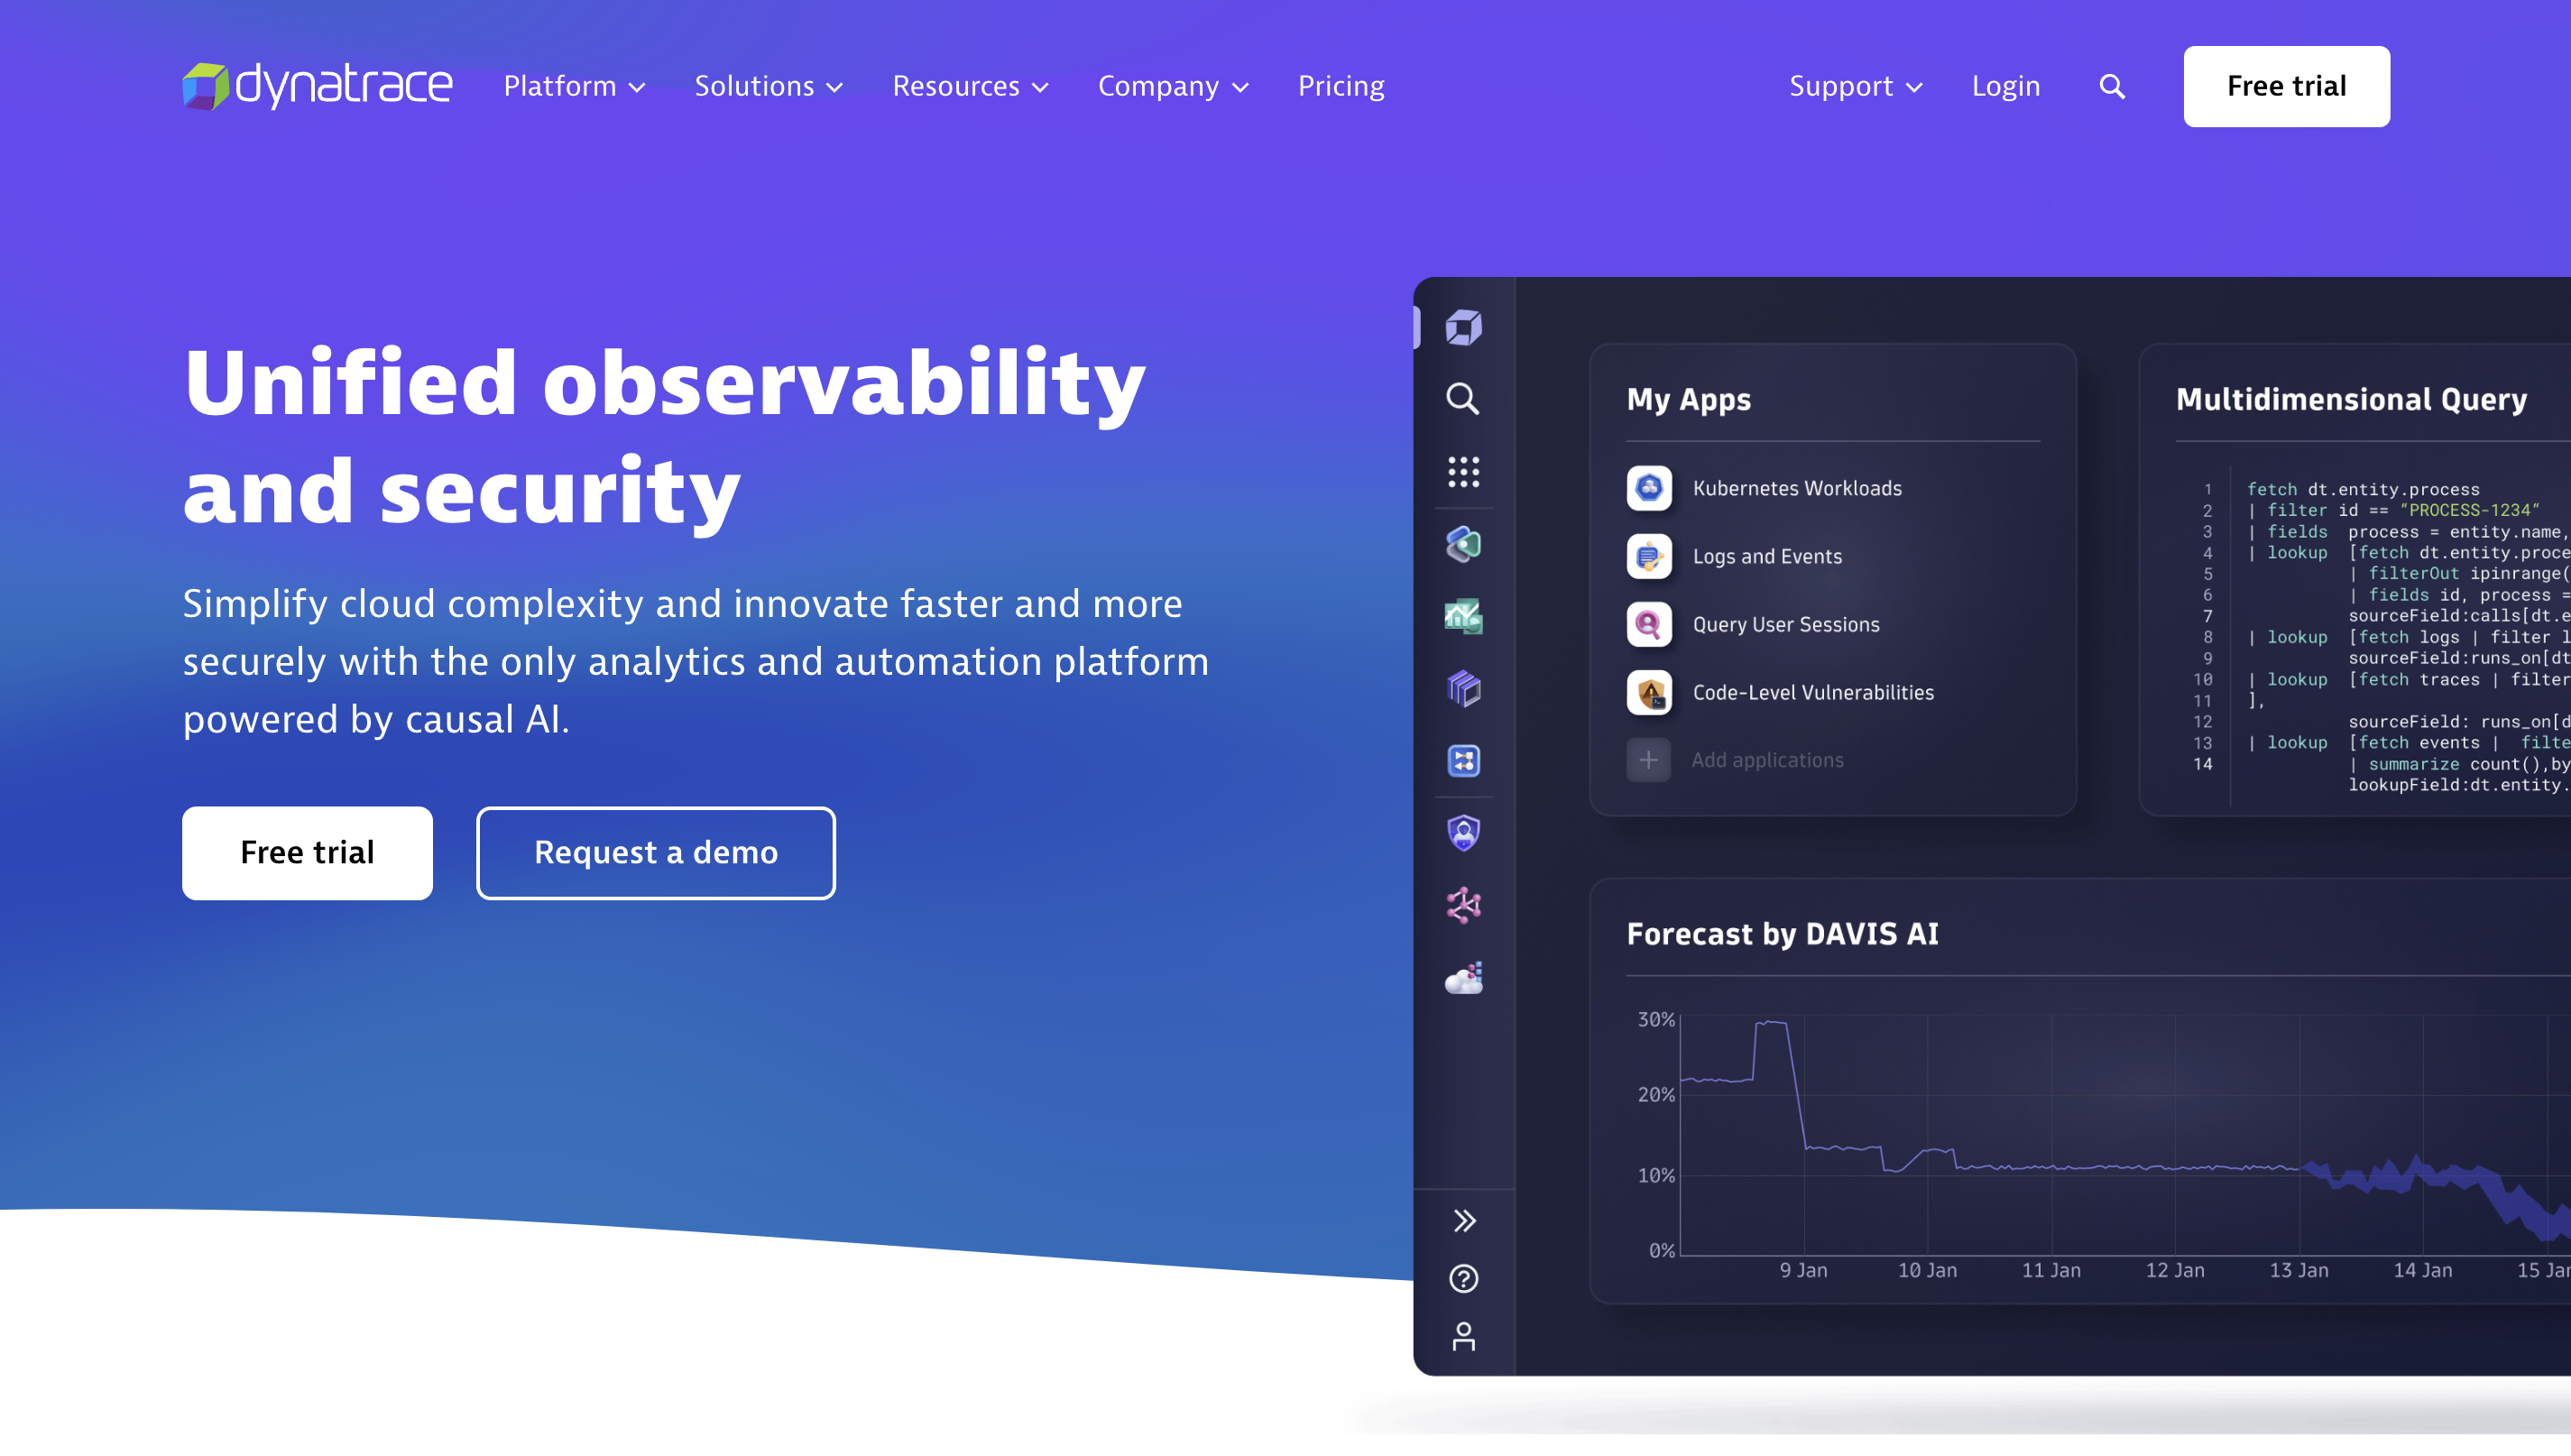
Dynatrace offers an all-encompassing observability solution, using artificial intelligence to automate the detection, analysis, and resolution of system issues.
It provides in-depth information about application performance, infrastructure health, and digital experience, supporting modern, dynamic cloud environments.
Best features
- Unified observability: Integrates logging, metrics, and APM within a single platform for easier management and correlation of data.
- Cloud-native support: Offers out-of-the-box support for cloud services, containers, and serverless functions, facilitating modern application monitoring.
- Advanced analytics: Features customizable dashboards and sophisticated analytics tools for detailed insights and data-driven decision-making.
- Automated anomaly detection: Utilizes machine learning to automatically detect and alert on anomalies, aiding in proactive issue identification.
- Extensive integration ecosystem: Boasts a broad array of integrations with various cloud services, development tools, and orchestration platforms.
Pricing
- 15-day free trial
- Custom pricing: Dynatrace offers tailored pricing based on your specific monitoring needs and scale of operations.
Consumer score
Users enjoy great customer service and love Dynatrace’s cloud-based model, earning the company a 4.5 on Capterra.
Pros and cons
Pros
- AI-driven insights greatly reduce manual troubleshooting effort.
- Comprehensive coverage across applications, infrastructure, and user experience.
- Extensive integrations facilitate a holistic observability strategy.
Cons
- Higher complexity and steep learning curve for new users.
- Pricing can be higher compared to other solutions, especially for small teams.
- Some users report underdeveloped monitoring capabilities
3. New Relic
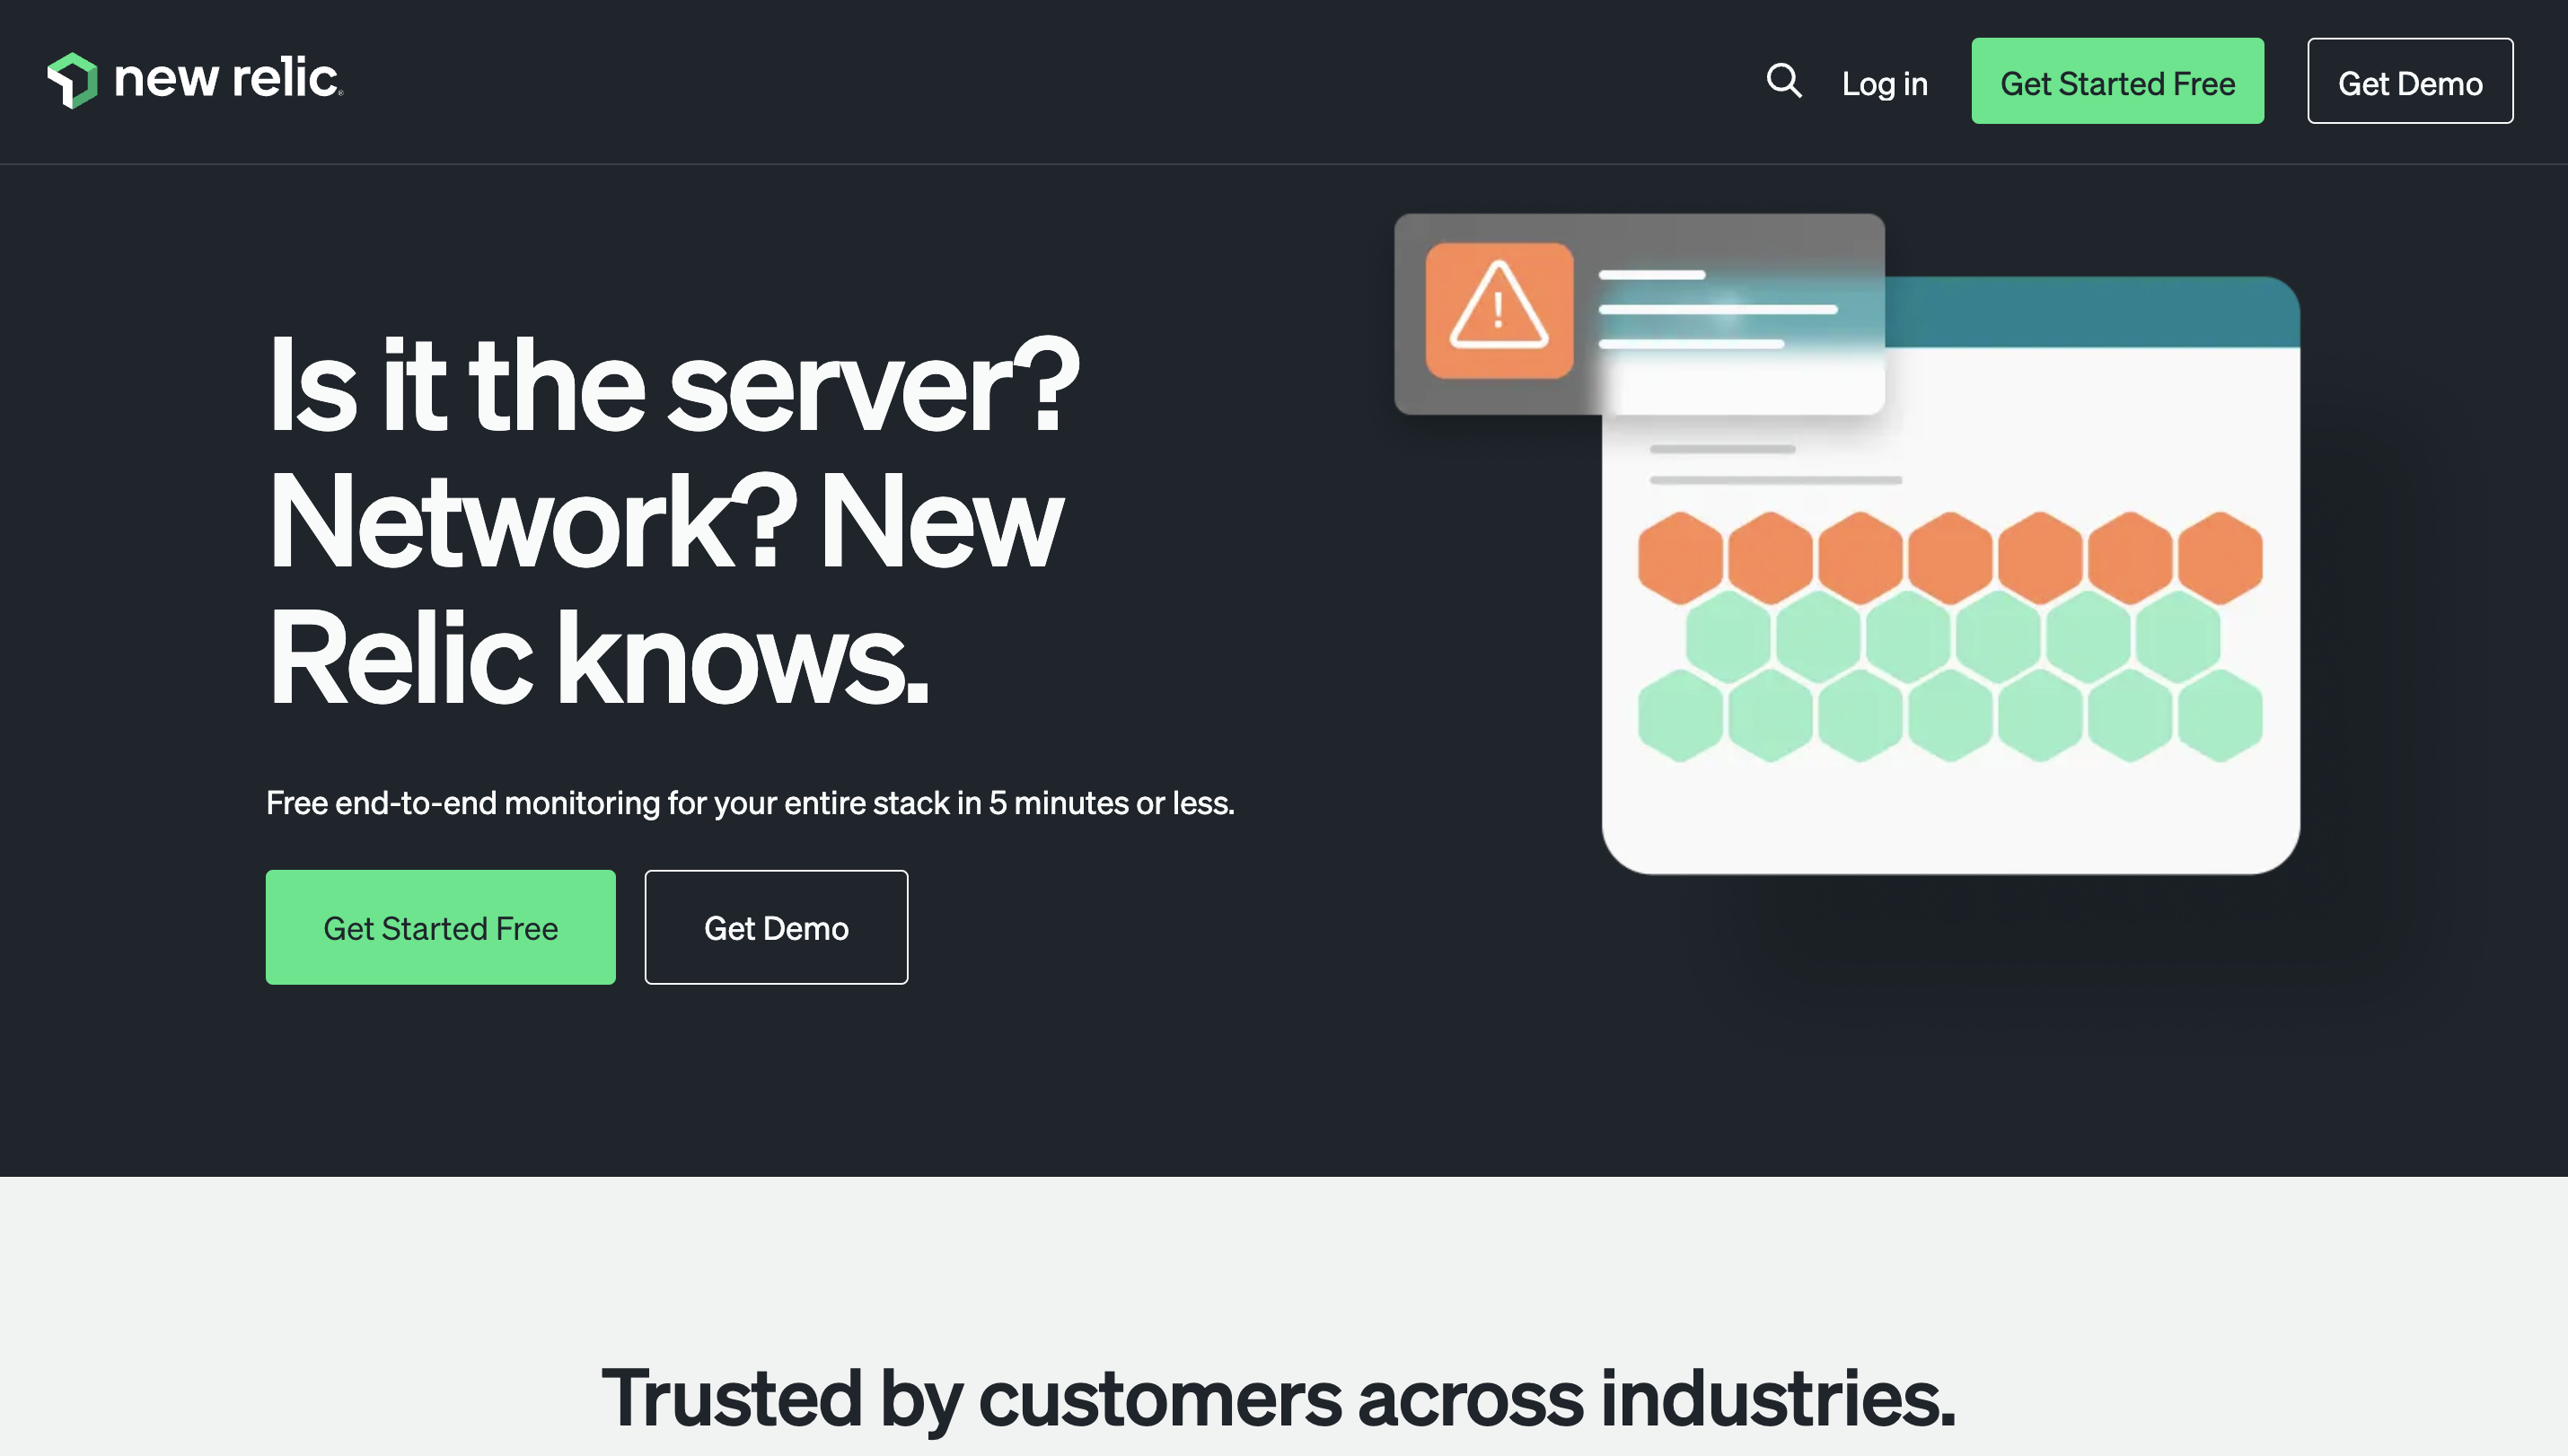
New Relic delivers a full-stack observability platform that enables teams to track, visualize, and analyze their software’s performance and health in real-time.
It is designed to support complex ecosystems, from applications to infrastructure and digital customer experiences.
Best features
- Full-stack observability: Offers insights across applications, infrastructure, end-user experience, and more in one unified platform.
- Real-time analytics: Empowers teams with real-time data and analytics to make faster, informed decisions.
- Customizable dashboards: Users can create tailored dashboards to focus on the metrics that matter most to them.
- Scalable architecture: Designed to support dynamic cloud environments, ensuring scalability and flexibility.
- Extensive ecosystem integration: Seamlessly integrates with a wide range of technologies and platforms for comprehensive monitoring.
Pricing
- Free tier: Provides basic features for small teams and projects.
- Priced based on usage and number of users, with more advanced features and support options. You’ll get 100 GB/month included and $.30/GB or usage above that.
Consumer score
With a score of 4.5 on Capterra, users note New Relic’s wide range of features, great debugging capabilities, and real-time tracking.
Pros and cons
Pros
- Full coverage of monitoring needs in a single platform.
- Highly customizable dashboards and powerful analytics capabilities.
- User session replay for easier debugging and understanding of user interactions.
Cons
- Complex pricing model can be difficult to predict and manage.
- Initial setup and learning curve can be hard to grasp.
- Some users report difficulties due to lack of guidance or resource materials.
4. Sentry

Sentry offers application monitoring that focuses on error tracking and performance monitoring, which makes it easier for developers to identify, diagnose, and fix issues in real time.
This tool is particularly well-suited for application developers looking to improve code quality and application reliability.
Best features
- Error tracking: Automatically captures exceptions and errors, providing detailed stack traces for faster debugging.
- Performance monitoring: Measures application performance, identifying bottlenecks and areas for optimization.
- Real-time alerts: Notifies teams immediately when issues are detected, allowing for quick response.
- SDK integration: Supports a wide range of programming languages and frameworks for easy integration into your development workflow.
- Code insights: Offers insights into the impact of errors and performance issues on users to prioritize fixes effectively.
Pricing
- Free plan includes basic error tracking and performance monitoring features.
- Team ($26/month) and Business ($80/month) plans offer more advanced features and greater event volume, with Enterprise pricing available upon request.
Consumer score
Having a large number of integrations and high degree of ease of use earned Sentry an impressive 4.8 score on Capterra.
Pros and cons
Pros
- Exceptional for tracking and diagnosing errors in real-time.
- Users report this service is extremely user friendly.
- Good value for price, according to users.
Cons
- Pricing can become costly as event volume and project size increase.
- Some feel that there aren’t enough integration options.
- Limited capabilities beyond error and performance monitoring compared to full-stack observability platforms.
5. BetterStack
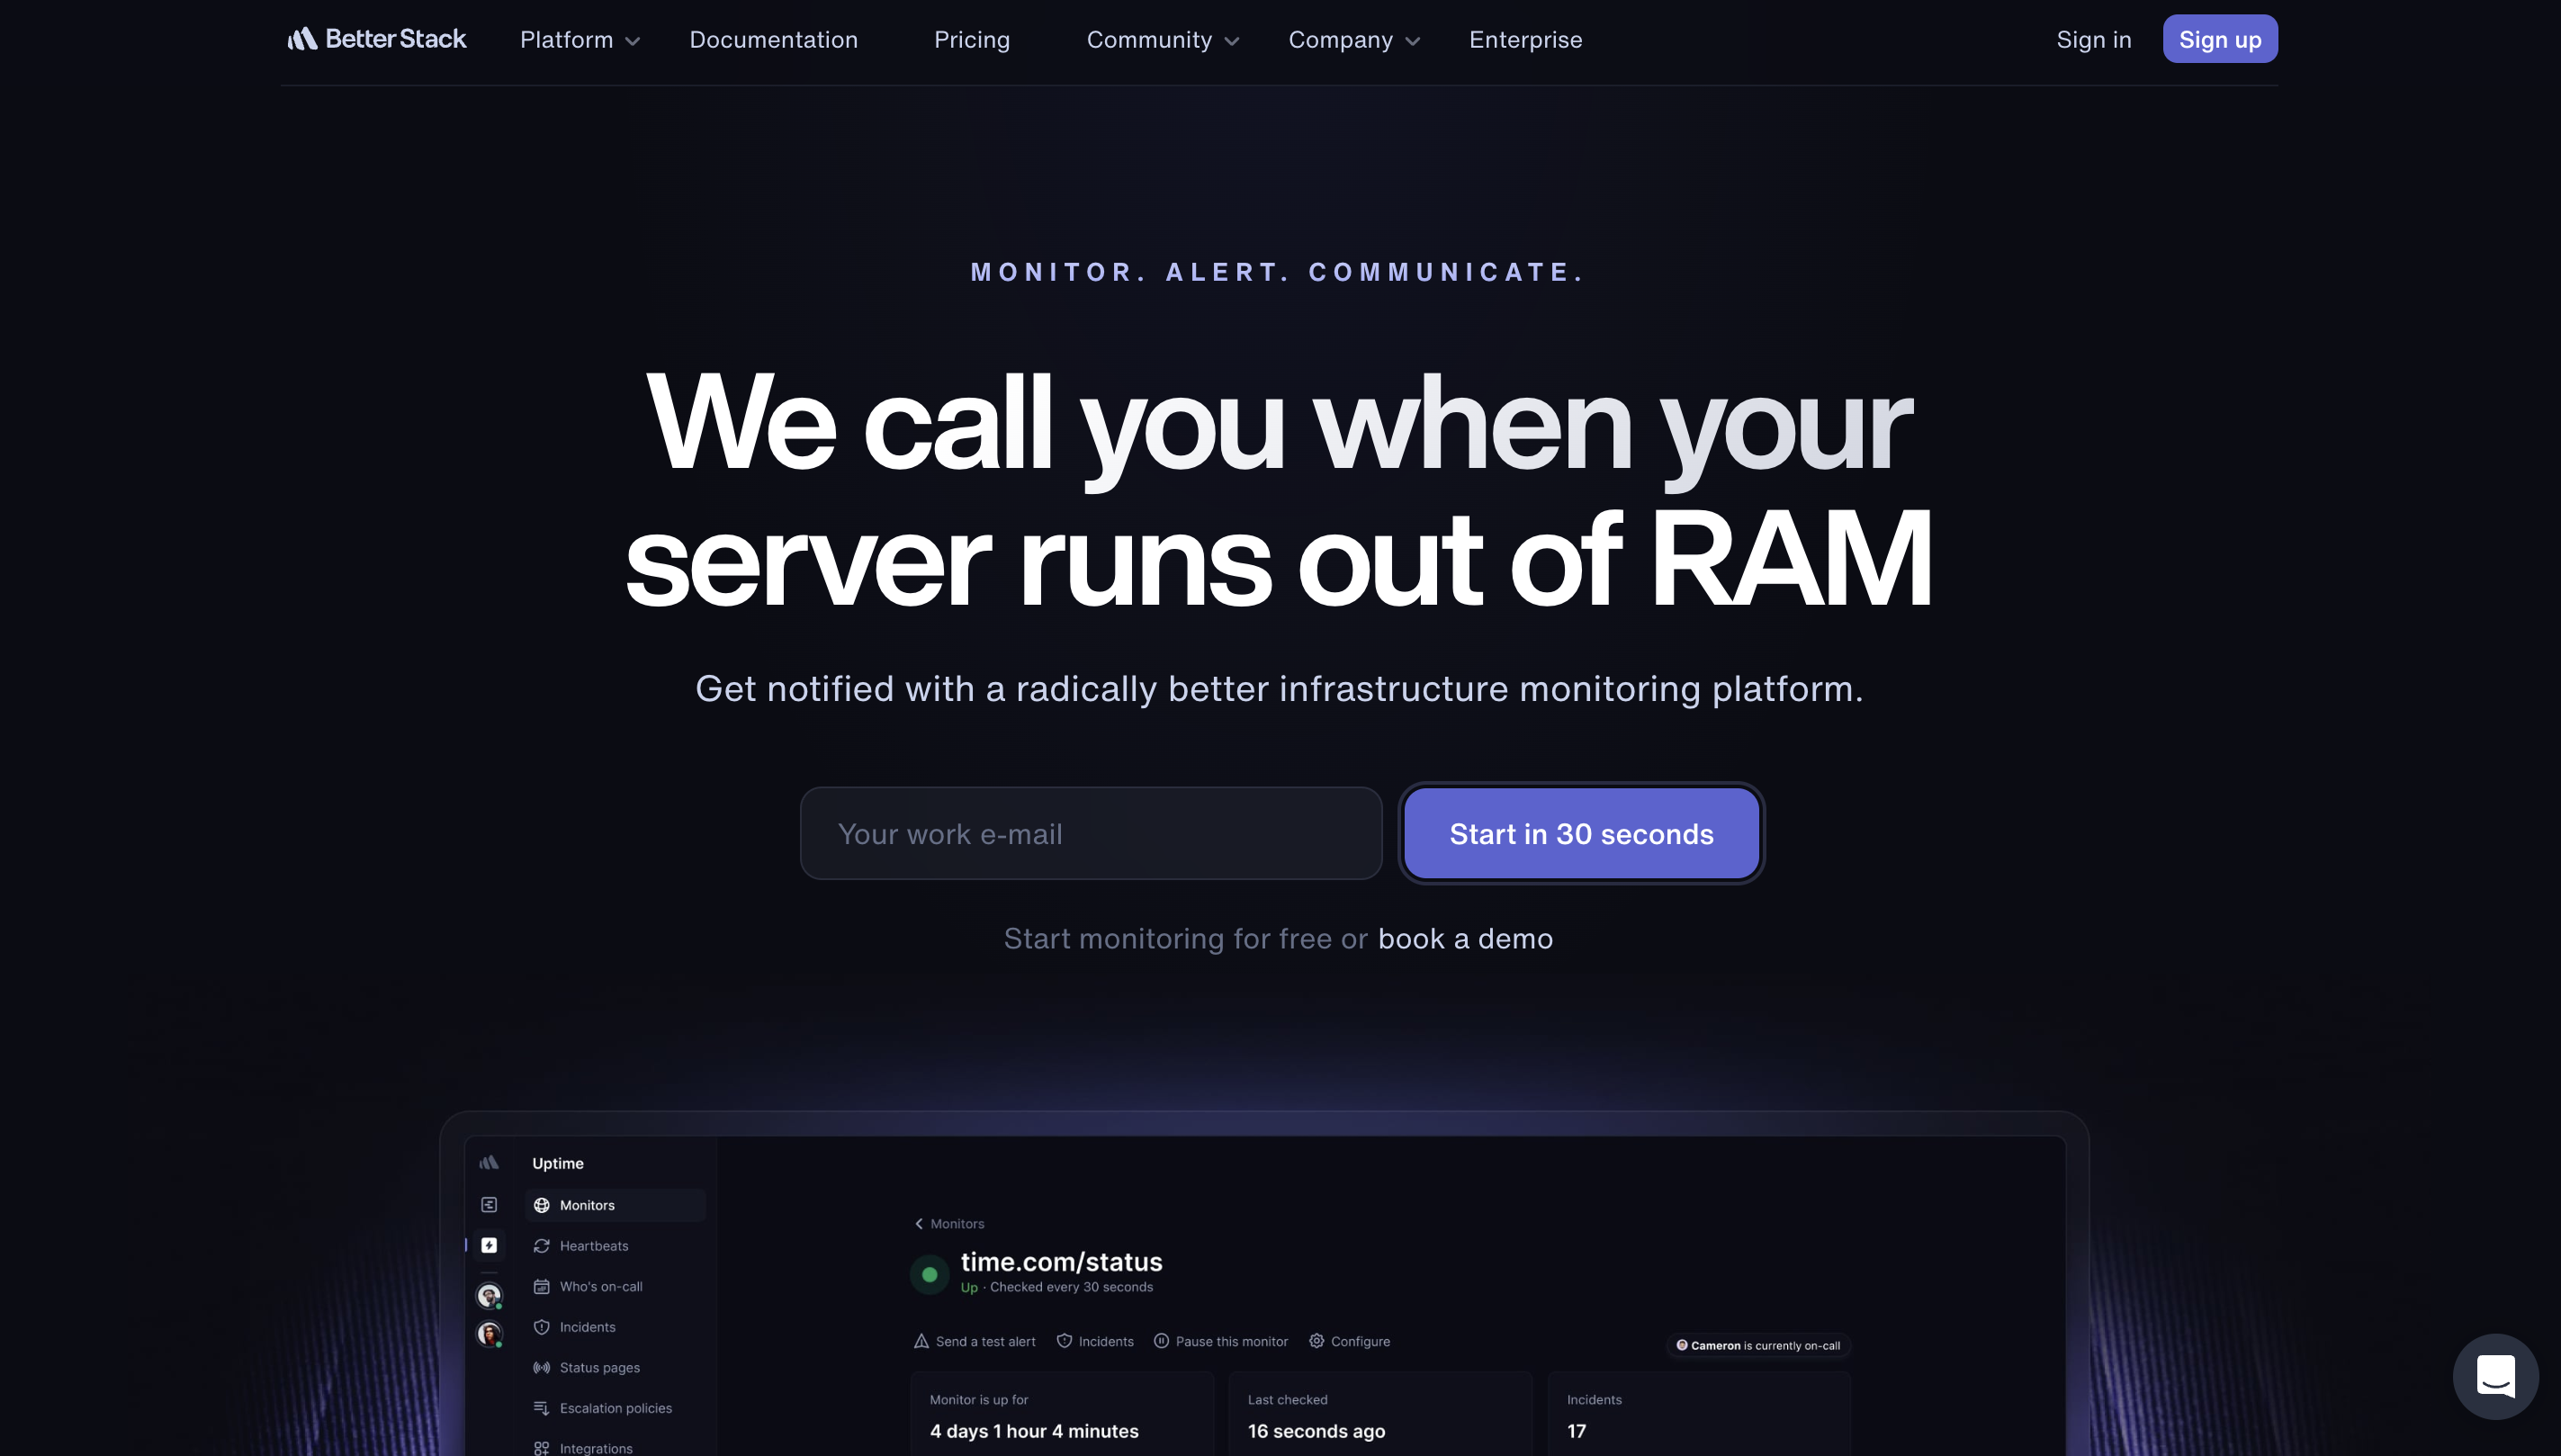
BetterStack provides a complete suite of tools designed to improve logging, monitoring, and incident management.
Its solutions are built to offer deep insights into system performance and user experiences, helping teams identify and resolve issues swiftly.
Best features
- Advanced log management: Efficiently collect, search, and analyze logs across your entire stack for quicker debugging and analysis.
- Real-time monitoring and alerts: Monitor system health and performance metrics in real-time, with instant alerts to notify you of potential issues.
- Incident management: Streamline incident response with integrated management features, ensuring quick resolution and minimal downtime.
- One-click integration: Easily integrates with a variety of tools and platforms, enabling a seamless observability workflow.
- Developer-centric UI: Offers a user-friendly interface designed with developers in mind, making it easier to access and understand critical data.
Pricing
- The free plan includes basic monitoring features for smaller teams and projects.
- The freelancer plan for $25/month includes more advanced features, with 50 monitors and 30-second checks.
- Small Team ($85/month) and Business ($170/month) offer more users, monitors, status pages, and better support.
Consumer score
Scoring a 4.8 G2, Better Stack users love its great interface and fair pricing.
Pros and cons
Pros
- Very smooth integration capabilities.
- Comprehensive monitoring solutions with actionable insights.
Cons
- Some advanced features may require a learning curve to use effectively.
- Some users have reported that they’d like more customization options.
- Intuitive developer interface.
6. Grafana
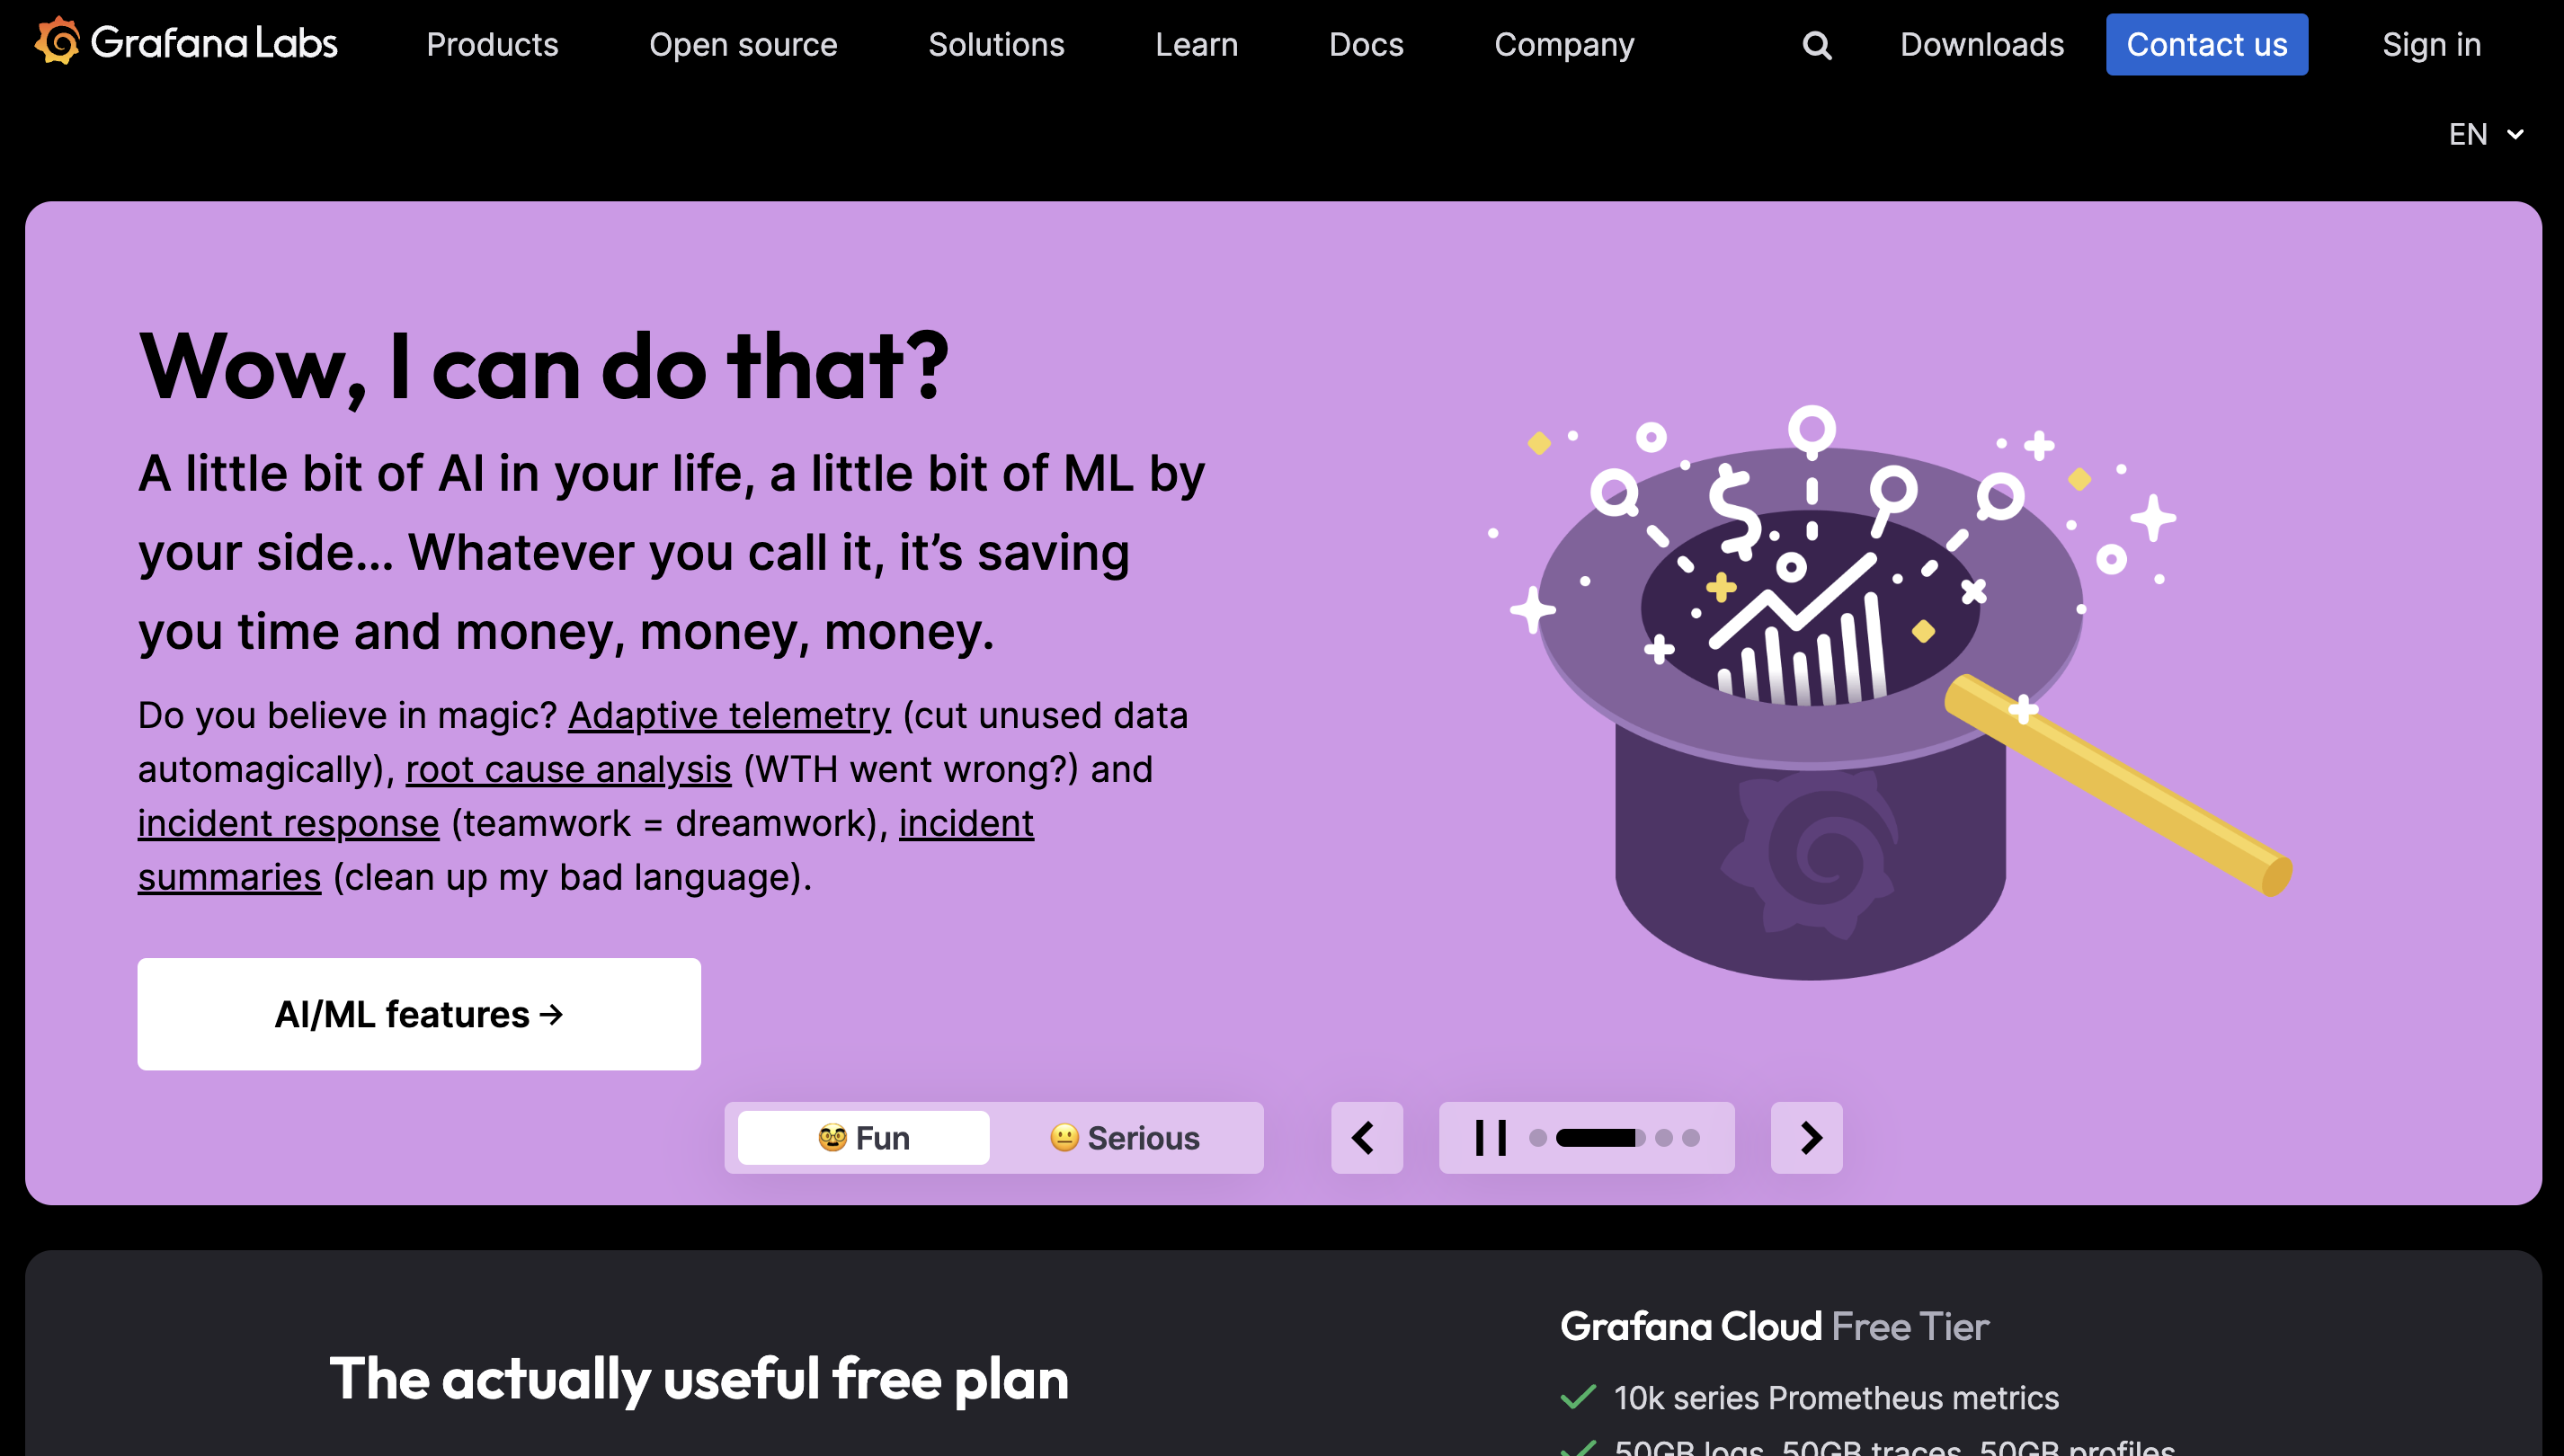
Grafana is renowned for its powerful analytics and visualization capabilities, offering a flexible platform for monitoring and exploring metrics from various data sources.
Grafana is particularly favored for its customization options and wide range of plugins.
Best features
- Customizable dashboards: Create highly customizable dashboards to visualize data exactly how you need.
- Broad data source support: Integrates with numerous databases and monitoring tools, allowing for versatile data visualization.
- Advanced analytics: Provides advanced analytics tools for deeper insights into your data.
- Alerting: Features extensive alerting capabilities to notify teams of identified issues.
- Extensive plugin ecosystem: Increases functionality with a wide range of community and official plugins.
Pricing
- Forever free plan gives access to all features, including 50k frontend observability sessions.
- Pay as You Go is the same as the free plan, but you simply pay for what you use beyond what’s included in the free tier.
- The Advanced plan at $299/month gives you twice the amount of usage, and 24/7 support, among other benefits.
Consumer score
Grafana users gave a rating of 4.6 on Capterra due to its attractive dashboard and interfaces, as well as its good integration capabilities.
Pros and cons
Pros
- Highly customizable and versatile for various data visualization needs.
- Strong community support and an extensive range of plugins.
Cons
- Some believe granular permissions could be improved.
- Some beginners find Grafana’s documentation confusing.
7. Splunk
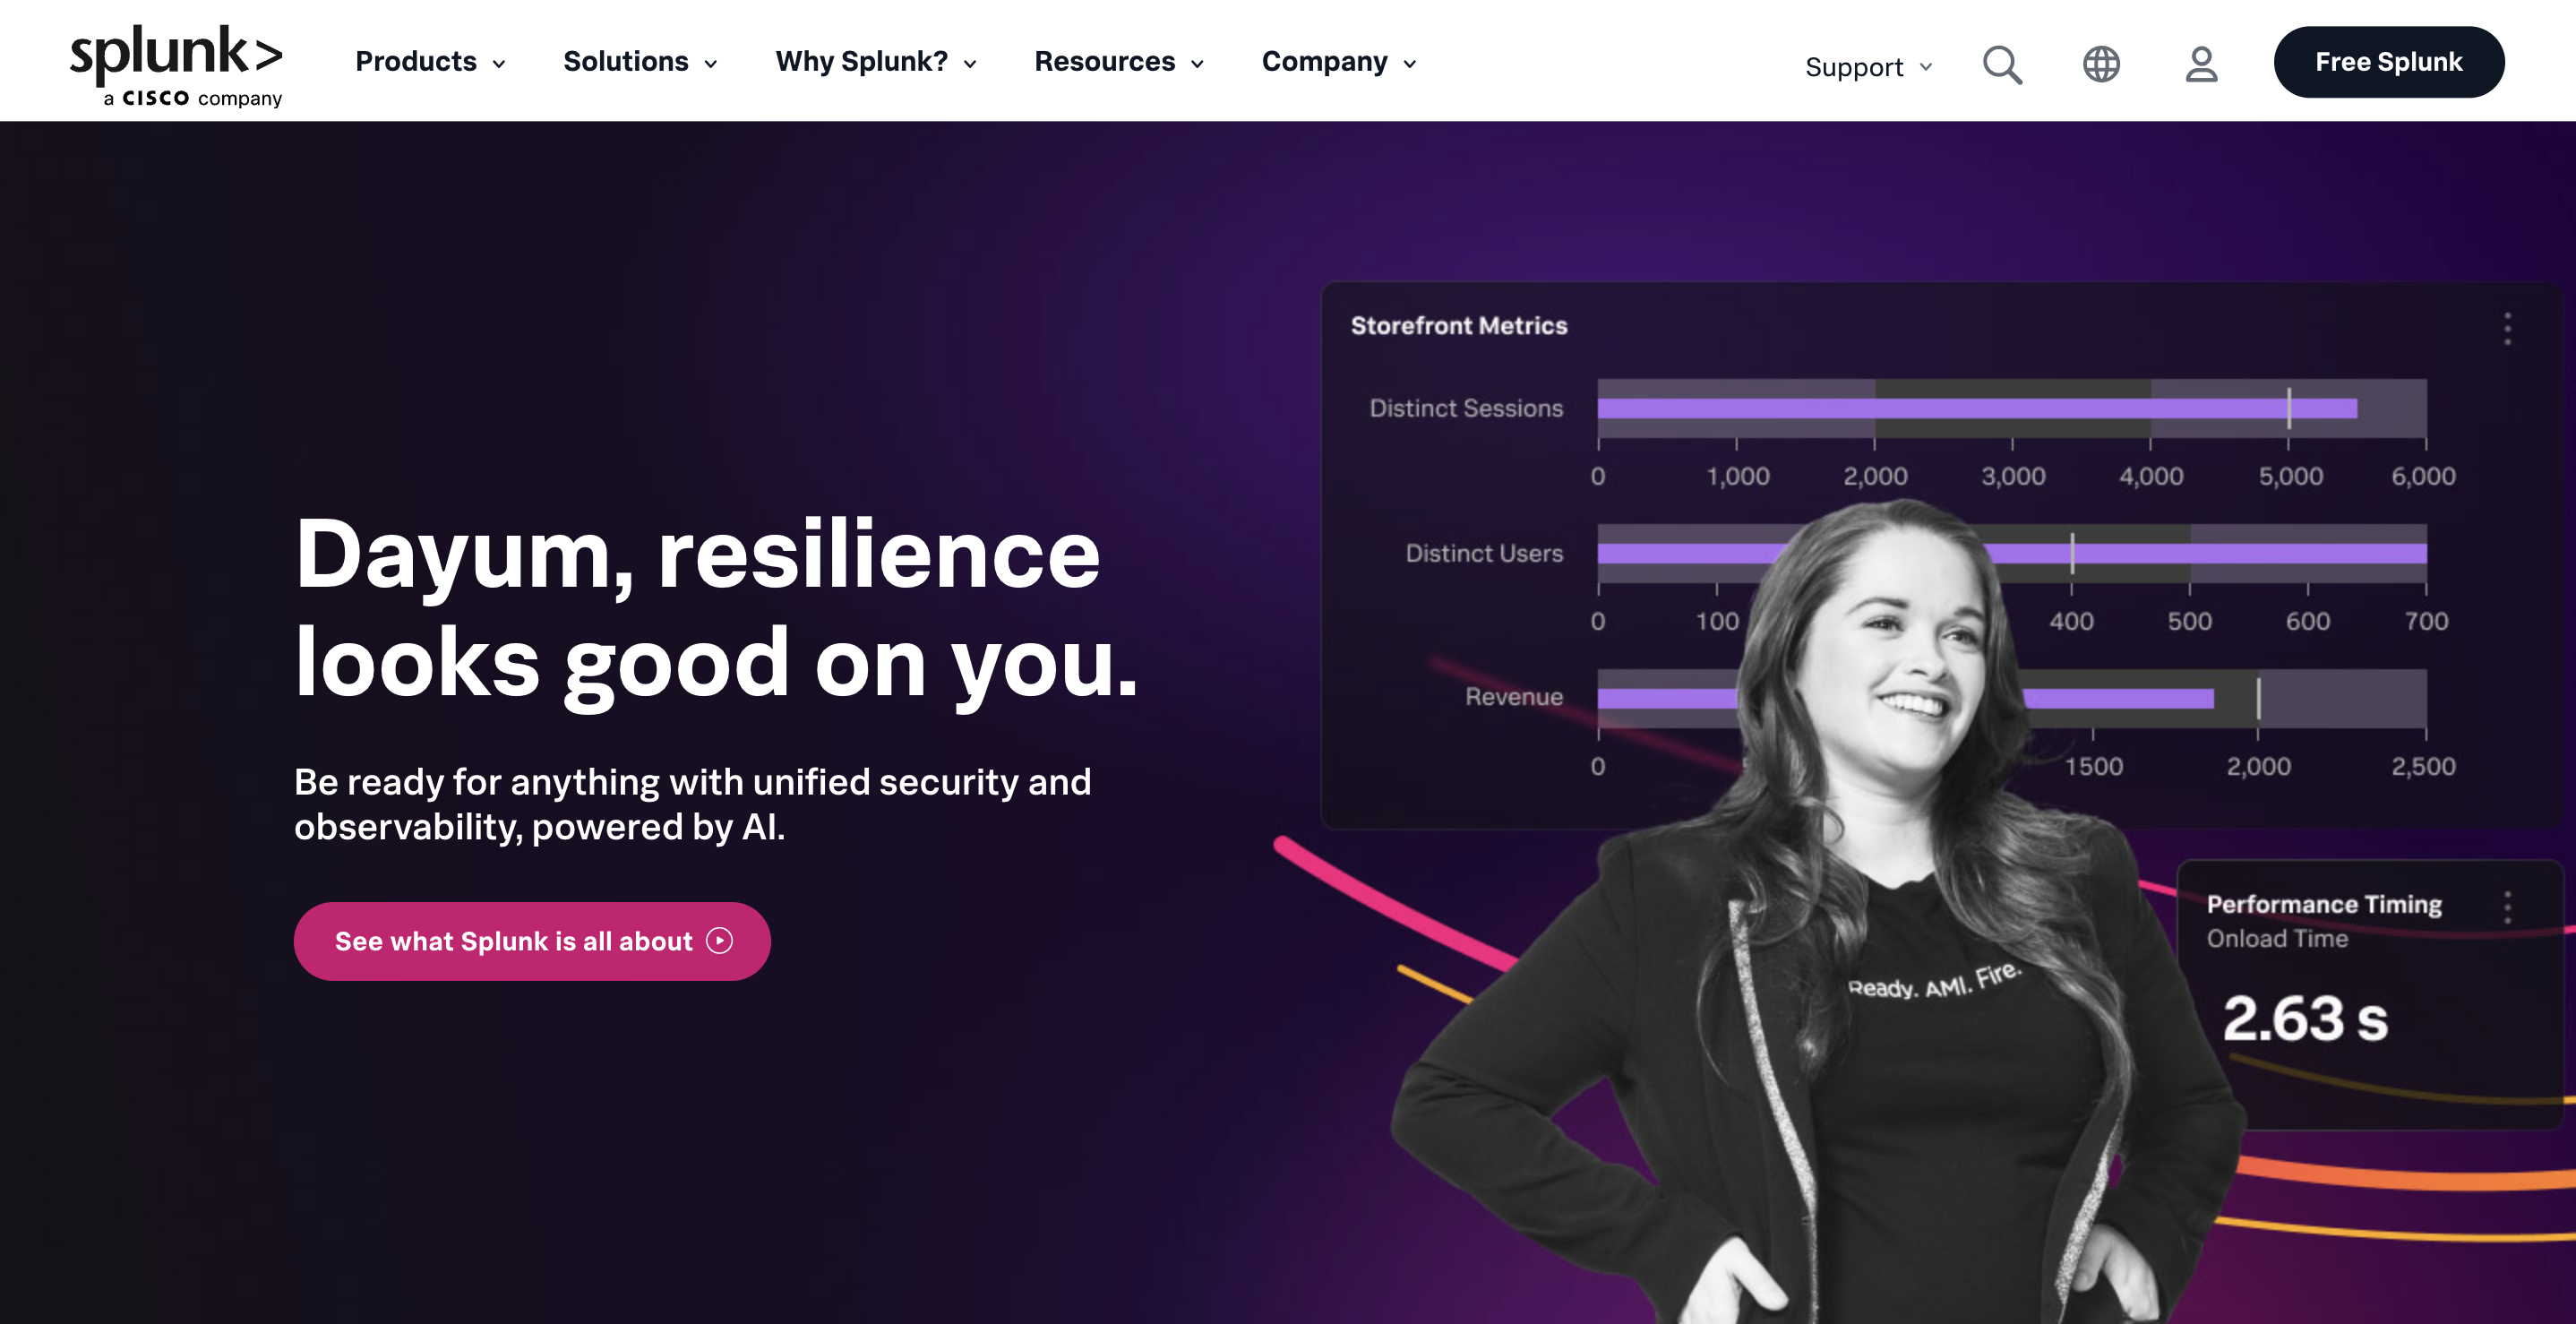
Splunk is a leading platform for searching, monitoring, and analyzing machine-generated big data via a web-based interface.
It’s designed to make machine data accessible across an organization and identifies data patterns, provides metrics, diagnoses problems, and provides intelligence for business operations.
Best features
- Powerful search and analysis: Enables complex searches, correlations, and analysis across large volumes of data.
- Real-time visibility: Provides real-time insights into application performance, security threats, and operational issues.
- Scalable architecture: Designed to scale from small to large volumes of data seamlessly.
- Extensive integration options: Offers a wide range of integrations with other tools and services for better functionality.
- Advanced security analytics: Features robust security capabilities for threat detection and compliance monitoring.
Pricing
- Free version: Offers limited features for smaller teams.
- Enterprise version: Pricing varies based on data usage and specific organizational needs.
Consumer score
Splunk earned its 4.6 Capterra score in part because of its reliability and extensive integration capabilities.
Pros and cons
Pros
- Highly flexible and capable of processing vast amounts of data efficiently.
- Intuitive interface with powerful search capabilities.
- Advance security features for full threat analysis and compliance.
Cons
- Can become expensive for large-scale deployments.
- Customization and advanced features require technical expertise.
8. Prometheus
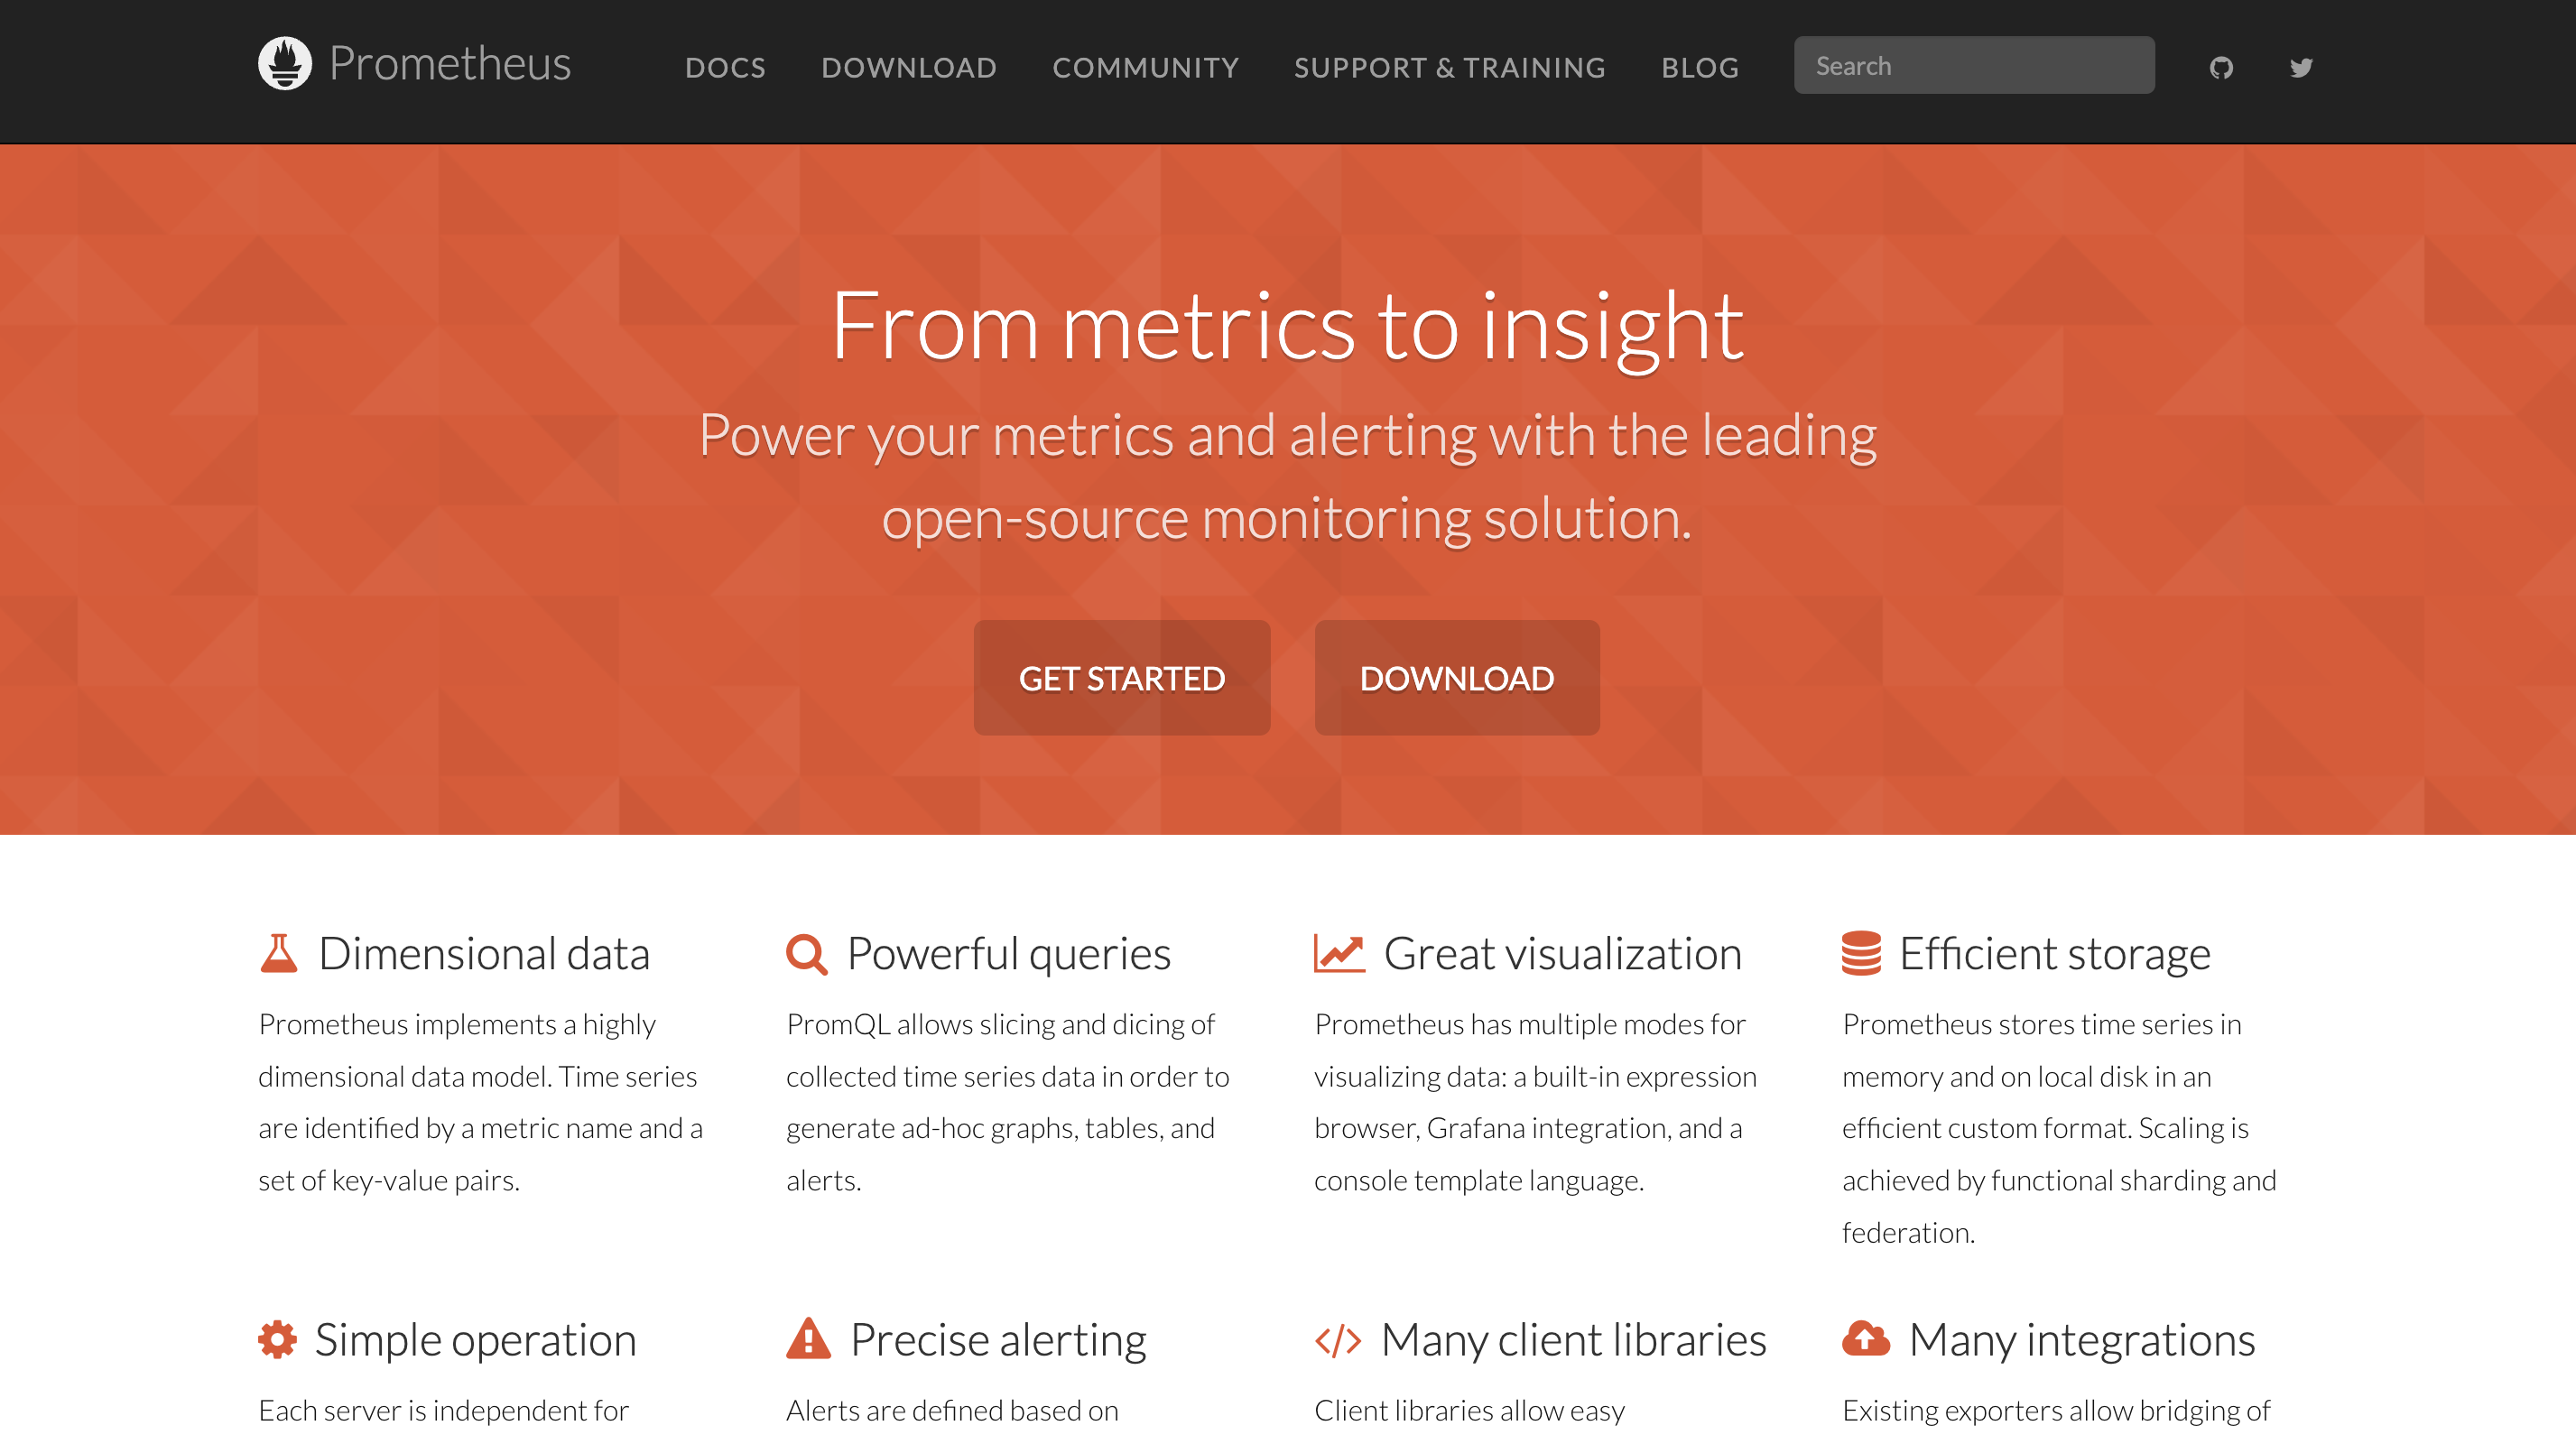
Prometheus is an open-source system monitoring and alerting toolkit originally built by SoundCloud. It’s now a standalone open source project and maintained independently of any company. Designed for reliability, it records real-time metrics in a time series database built using an HTTP pull model, with flexible queries and real-time alerting.
Best features
- Multi-dimensional data model: Uses time series data identified by metric name and key/value pairs for flexible and powerful querying.
- Powerful query language: PromQL allows for precise and complex queries to extract meaningful insights from your data.
- Efficient storage: Implements a highly efficient time series database to manage data.
- Active community: Benefits from a vibrant open-source community contributing to its ongoing development.
- Integrated alerting: Features an alerting system that integrates with external services for notifications.
Pricing
- Free to use, with costs associated with self-hosting or optional commercial support services.
Consumer score
Users report that Prometheus is a great value, and has a wide selection of features, earning it a 4.3 on Capterra.
Pros and cons
Pros
- Easy set up and free to use.
- Intuitive interface with powerful search capabilities.
- Highly efficient and reliable for large-scale deployments.
- Active development and community support ensure continual improvement and help.
Cons
- Some users find limitations in setting granular permissions.
- While powerful, the PromQL query language can be challenging for beginners.
9. ServiceNow (formerly) LightStep
ServiceNow delivers comprehensive observability with deep insights into system performance and behavior. It’s designed to help teams quickly diagnose and resolve issues in complex distributed systems.
Best features
- High-resolution traces: Provides detailed traces to understand system behavior and pinpoint issues.
- Real-time analysis: Offers instant insights and correlation across massive datasets for rapid problem resolution.
- Smooth integration: Easily integrates with existing tools and services for a cohesive observability strategy.
- Advanced analytics: Empowers users with advanced analytics tools for in-depth system analysis.
- Collaborative incident response: Features tools for effective team collaboration during incident response.
Pricing
- ServiceNow has customized pricing based on specific business needs and usage.
Consumer score
Users love the integrations on ServiceNow, and report excellent log monitoring functionality. It has a 4.6 on Capterra.
Pros and cons
Pros
- Provides insights with high-resolution data and real-time analytics.
- Intuitive interface simplifies navigation and analysis.
- Easy set up and customizable dashboards.
Cons
- Pricing transparency could be improved.
- Some users find it challenging to access basic APM data within LightStep.
10. Coralogix
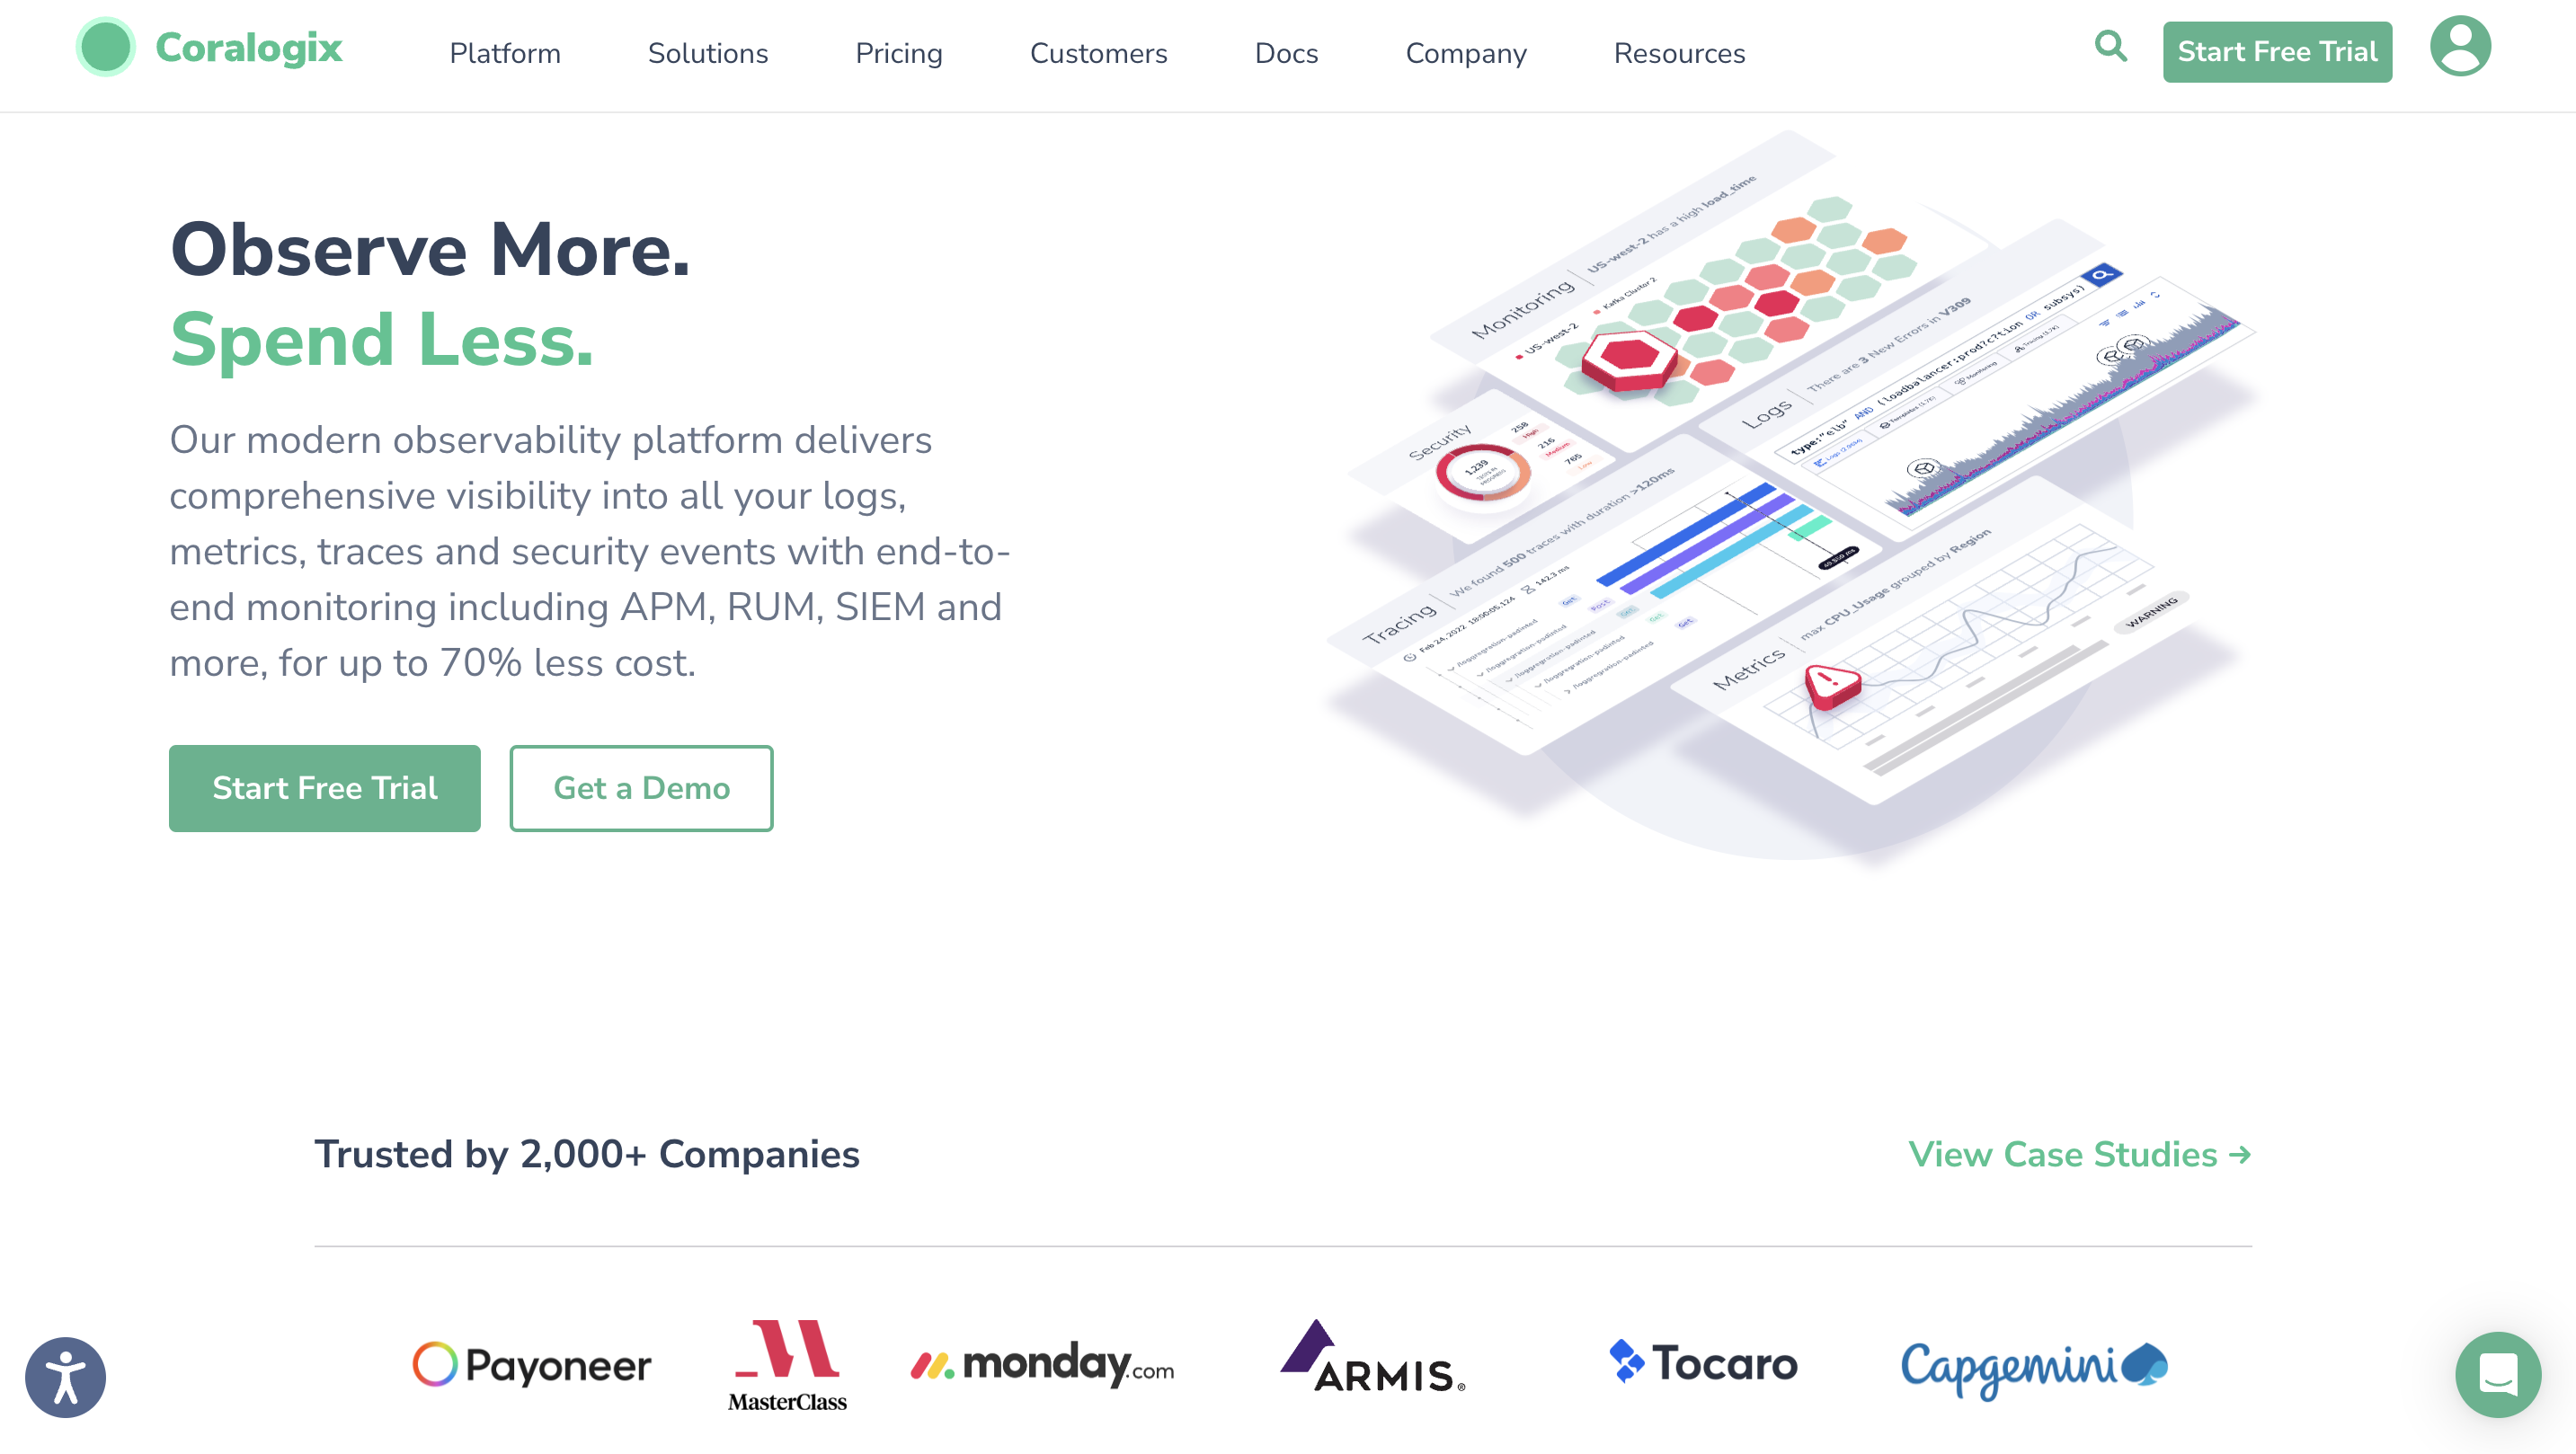
Coralogix is a comprehensive observability platform offering visibility into logs, metrics, traces, and security events.
It uses Streama technology to analyze data in-stream, eliminating the need for indexing and providing real-time insights.
Best features
- Logs: Centralize and analyze logs without indexing.
- Metrics: Monitor business logic with comprehensive metric data.
- Tracing: Correlate event flows and identify performance bottlenecks in distributed systems.
- Security: Automated posture and vulnerability assessments for end-to-end security.
Pricing
- Coralogix works on a scale model, with options for frequent search, monitoring, and compliance. Monitoring costs $0.50 per GB.
Consumer score
Boasting a 4.6 on G2, Coralogix is renowned for its price model, easy-to-read documentation, and integrations.
Pros and cons
Pros
- Easy to use.
- Intuitive interface simplifies navigation and analysis.
- Excellent customer support.
Cons
- Some features may be missing
How to choose the right observability tool
Start with the problem you need to solve first. Some teams need uptime checks and alerting. Others need deep tracing across services, log search, or infrastructure-level visibility. If you try to solve every observability problem in one pass, the rollout usually gets slower and the tool gets harder to evaluate.
Then decide whether you need a full platform or a smaller stack. A full platform makes correlation easier because logs, metrics, and traces live in one place. A smaller stack can make more sense when your team already has good tooling and only needs to fill one gap, such as tracing or log retention.
Integration fit matters early. Check how the tool handles your cloud provider, containers, databases, message queues, and alerting workflow. It also helps to verify OpenTelemetry support, since that gives you more flexibility if your stack changes later.
Pricing needs a closer look than the entry plan. Observability costs often grow with hosts, users, retention, cardinality, and data volume. A tool that looks affordable at the start can get expensive once traffic, services, and logs grow.
Team fit matters just as much as features. A smaller team may prefer a simpler product that is easy to deploy and easy to read during an incident. A larger platform or SRE team may accept more setup if the tool gives stronger tracing, richer queries, and better cross-system context.
Before you commit, test one real workflow. Trace a slow request, follow the logs, check the alert path, and confirm the result is useful to the people on call. That tells you more than a feature list ever will.
Observability vs. monitoring
Understanding how digital systems work requires getting to grips with two key ideas: observability and monitoring. Although people often mix these up, they’re just different ways of keeping an eye on your IT systems.
Monitoring is the older method of the two. It means watching over your systems by checking certain metrics and logs to see if everything’s working right. It’s mainly about spotting problems after they’ve happened.
Observability is the newer approach and it’s often seen as more proactive. It doesn’t just stick to a script of known issues. Instead, it lets teams explore their systems in-depth to figure out what’s going on inside, based on what they can see happening on the outside.
This is especially useful because today’s systems can become quite complicated, and new kinds of problems can pop up out of nowhere.
With observability, it’s not waiting for alarms to go off. Teams can actually get ahead of issues, understanding and fixing them before things go wrong. This needs a good set of tools that give a full picture of what’s happening inside the system, helping teams make smart decisions to keep everything running smoothly.
So, while monitoring alerts you to problems you already know might happen, observability gives you the tools to understand your systems better and stay one step ahead of potential issues.
This difference is crucial in today’s fast-moving world, where being able to quickly adapt and understand complex systems is key to keeping everything running reliably.
Conclusion
As systems become increasingly complex and distributed, the ability to gain more detailed insights into their behavior and performance is essential for improving reliability, optimizing resources, and delivering an overall pleasant user experience.
The observability tools discussed in this guide offer a range of capabilities designed to meet diverse needs, from comprehensive platforms like Dynatrace and New Relic, to specialized solutions like Prometheus for metric collection, and Grafana for data visualization.
Each tool has its strengths and is best suited to specific use cases, whether you’re looking for detailed analytics, extensive integration options, or a full litany of alerting mechanisms.
Looking ahead, the significance of observability in bolstering and streamlining IT systems is poised to escalate. Embracing observability practices and tools that match your organization’s needs enables you to efficiently resolve issues and proactively fine-tune your systems for forthcoming challenges.
This proactive stance equips you to adeptly manage the complexities of today’s IT environments, promoting continuous development and innovation within your organization.
-
Observability tools help teams understand how systems behave in production by collecting and correlating logs, metrics, and traces. They are used to detect issues faster, troubleshoot root causes, and see how applications, infrastructure, and dependencies perform under real traffic. The main goal is not just to know something failed, but to understand why.
-
Monitoring tools usually focus on predefined checks and alerts, such as uptime, latency, or resource thresholds. Observability tools go further by helping you explore unknown issues across complex systems using multiple data types and deeper context. In practice, monitoring tells you that something is wrong, while observability helps you investigate what changed.
-
The most important features depend on your environment, but core ones usually include support for logs, metrics, traces, alerting, dashboards, and integrations with your existing stack. You should also look at scalability, ease of use, pricing model, and how well the tool fits cloud-native or distributed systems. A strong tool is not the one with the longest feature list, but the one your team can actually use well.
-
An all-in-one platform is often easier to manage because it keeps data, dashboards, and alerting in one place. A multi-tool approach can give you more flexibility, but it also adds more setup, correlation, and maintenance work. The better choice depends on whether you value simplicity or deeper customization.