SNMP rarely fails loudly. A device keeps responding, but counters stop updating, thresholds drift, or alerts never fire when a link degrades. When teams don’t trust the data, network issues linger longer than they should.
This guide explains SNMP monitoring in practical terms. It covers how SNMP actually collects metrics, where implementations differ, and why common misconfigurations lead to blind spots. The focus is on how SNMP behaves in real networks, not protocol theory.
You’ll learn what SNMP is good at, what it struggles with, and how to use it to monitor network and infrastructure health with confidence. If SNMP is part of your stack, this will help you get clearer signals from it.

What is SNMP?
SNMP stands for Simple Network Management Protocol. It’s essentially the rulebook or language that devices on a network use to communicate with each other.
Think of your network as a small city. SNMP would be the municipal code that helps the city run smoothly, governing everything from traffic signals (your data packets) to water supply (your bandwidth).
Designed by the Internet Engineering Task Force (IETF), SNMP facilitates the exchange of information between network devices. It allows administrators to monitor and manage network performance, find and solve issues, and plan for network growth.
In short, SNMP is the Swiss Army knife for anyone who needs to keep tabs on network devices like routers, switches, servers, and firewalls.
Why is SNMP important?
These days, almost everything is connected, and managing a network can be like herding cats. That’s where SNMP comes in. It plays a crucial role in helping network administrators monitor network devices and manage data traffic more efficiently.
With simple network management protocol, you can capture various metrics to understand how well your network is functioning (or not).
- Simplifies network management: SNMP streamlines the complex tasks of monitoring and managing multiple network devices.
- Real-time monitoring: It allows network administrators to keep tabs on network performance metrics in real time.
- Efficient data traffic management: SNMP aids in optimizing the flow of data across the network, reducing bottlenecks and improving overall efficiency.
- Proactive problem detection: By capturing various metrics, SNMP helps in identifying issues before they become critical, allowing for quicker problem resolution.
SNMP metrics
SNMP isn’t just about detecting issues, it also gathers a ton of useful data. Metrics such as device uptime, throughput, temperature, CPU utilization, memory usage, and interface errors can be collected, giving you maximum visibility.
Collecting these metrics is helpful because they offer a glimpse into the health of the network. Check out these common SNMP metrics to get a better understanding of the full depth of this protocol:
- Device uptime: Measures how long a network device has been up and running. This is crucial for understanding the reliability of your network components.
- Throughput: Indicates the rate at which data packets are successfully transmitted over the network. Monitoring this helps you gauge network efficiency and spot potential bandwidth issues.
- Temperature: Provides insights into the operating conditions of network devices. High temperatures can be a red flag for potential hardware issues or inadequate cooling systems.
- CPU utilization: Tells you how much of the device’s processing power is being used. High CPU utilization can lead to bottlenecks, making this a key metric to monitor for maintaining efficient network operations.
- Memory usage: Shows the amount of RAM being used by the device. Excessive memory usage can cause the device to slow down or even crash, so it’s crucial for preventing downtime.
- Interface errors: Counts the number of errors that occur on the device’s interfaces, such as Ethernet ports. Monitoring this can help you detect faulty hardware or connection issues early on.
Collecting these SNMP metrics offers a comprehensive view into the health and performance of your network, enabling you to act proactively rather than reactively when issues arise.
How does SNMP work?
Alright, you get that SNMP is like the jack-of-all-trades in network management. But how does it actually do its magic? Let’s break it down.
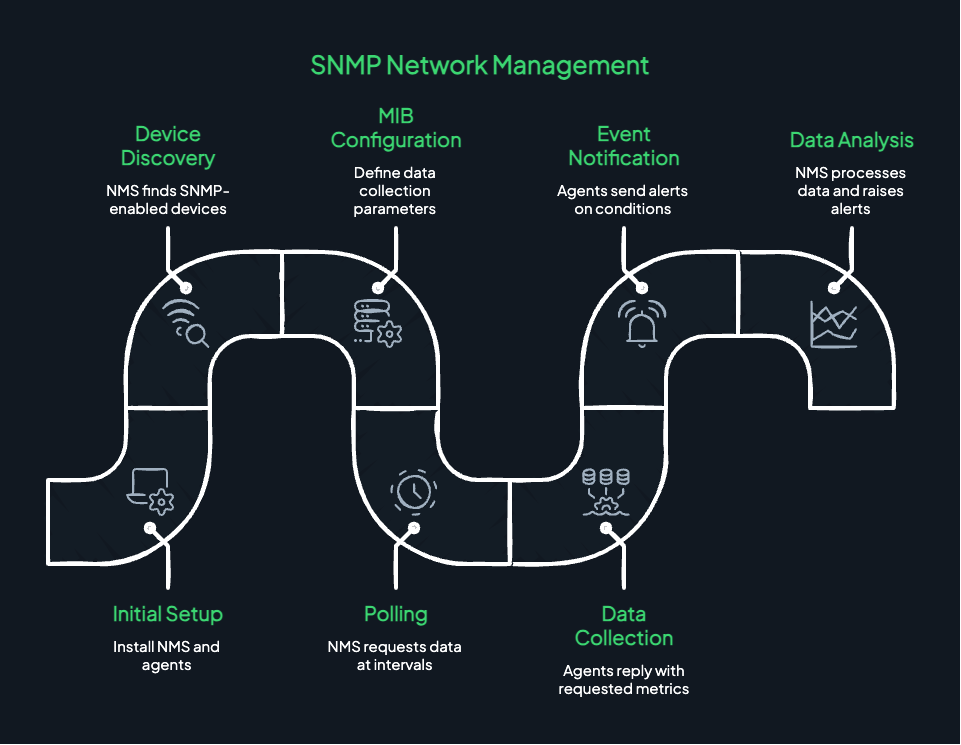
Step 1: Initial Setup
First, you’ll set up the Network Management System (NMS), a software application that will act as the central hub for managing your network. You’ll also need to install SNMP agents on the devices you want to monitor. These agents will collect data and send it to the NMS.
Step 2: Device Discovery
Once everything is installed, the NMS will discover the SNMP-enabled devices on your network. This is usually an automated process, but manual configuration is also possible.
Step 3: MIB Configuration
Next, you’ll configure the Management Information Base (MIB), a database that defines what kinds of information the SNMP agents can collect from the network devices. MIBs act like templates for data collection.
Step 4: Polling
The NMS starts the monitoring process by ‘polling’ SNMP agents at regular intervals. In this context, ‘polling’ means asking the agents for specific pieces of information based on the MIB.
Step 5: Data Collection
The SNMP agents respond to the polls by sending back the requested data to the NMS. This could include various metrics discussed above.
Step 6: Event Notification (Traps)
In addition to being polled, SNMP agents can also send unsolicited messages, known as ‘traps,’ to the NMS. Traps are sent when certain predefined conditions are met, like if a device overheats or experiences a sudden shutdown.
Step 7: Data Analysis
The NMS receives all this data and either stores it for later analysis or processes it in real-time. This can include generating alerts if certain thresholds are crossed or visualizing data for easier understanding.
Step 8: Action and Adjustment
Based on the analyzed data, network administrators can take appropriate actions. This could mean anything from altering device configurations to prevent bottlenecks, to replacing faulty hardware.
Types of SNMP configurations
There are two main ways SNMP can be set up. You can opt for a centralized model, where a single network management system (NMS) communicates with multiple SNMP agents. Alternatively, you could go for a hierarchical model, which involves multiple NMSs and SNMP agents at various levels, making it easier to manage large-scale networks.
- Centralized model: In this setup, a single Network Management System (NMS) communicates with multiple SNMP agents. This is often ideal for smaller networks where centralized control is sufficient.
- Hierarchical model: Suited for large-scale networks, this involves multiple NMSs and SNMP agents at different levels of the network hierarchy, making management more modular and scalable.
Understanding these elements and how they interact helps you choose the most effective SNMP configuration for your specific network needs.
SNMP protocol versions
Now, let’s touch on SNMP’s evolution over the years. It started off simply, but has grown over time to keep up with the changing landscape of network management.
- SNMPv1: The original, lacking advanced features and weak security via community strings.
- SNMPv2: An upgrade with enhanced security and added functionalities, but still not fully secure.
- SNMPv3: The latest version with strong security features like authentication and encryption.
These versions show SNMP’s evolution from a simple tool to a more secure and feature-rich solution for network management.
Port & Port Numbers
Ports and port numbers are like the street addresses for data packets in your SNMP city. They guide where information should go and how it should get there. SNMP typically uses the User Datagram Protocol (UDP) for its transport needs.
Here are some specific port numbers you should know:
- Port 161: Used by the SNMP manager for sending requests to agents.
- Port 162: Employed for the SNMP manager to receive traps or notifications from agents.
These ports ensure that SNMP messages reach their intended destinations without a hitch.
Basic SNMP commands
Just like you can’t get by in France without knowing a bit of French, you can’t really operate SNMP without knowing its basic commands.
- Get: This command is used by the NMS to request specific information from an SNMP agent. The agent replies with the requested data, which could be anything from CPU utilization to current temperature.
- GetNext: Similar to the ‘Get’ command, ‘GetNext’ is used to request the next variable in the Management Information Base (MIB). This is useful for scanning through available data points.
- GetBulk: This is like an advanced version of ‘GetNext,’ designed to minimize network traffic. It retrieves large chunks of data in a single go.
- Set: If you want to modify a setting on a managed device, the ‘Set’ command allows the NMS to do just that. For example, you could change the configuration of a router or update a password.
- Inform: This command allows for two-way notification between SNMP managers. One manager can inform another about specific events.
SNMP traps
One of the essential commands in the SNMP toolbox is ‘trap.’ Traps are basically emergency signals. If something out of the ordinary happens, let’s say a server overheats, the SNMP agent on that device sends a trap to the network management system, alerting it of the issue.
SNMP traps enable the proactive monitoring of network devices. Instead of waiting for the management system to request data, the agent sends crucial information automatically whenever a predefined event occurs.
SNMP Components & Architecture
Time to dig deeper. If SNMP were a building, it’d have some vital structural components that hold it up. Understanding these will help you get to grips with how SNMP makes your network tick.
The major players here are:
Network Management System (NMS): Consider this the command center of operations. It’s the software that communicates with SNMP agents to monitor and manage network devices.
SNMP agent: These are the embedded software components living within your managed devices. Agents collect information from their host devices and communicate it back to the NMS.
Management Information Base (MIB): This is a database of network object identifiers (OIDs) that define the properties of the managed device. Every SNMP agent has a MIB, and it’s what the NMS looks into when it wants to request or change information.
Managed devices: Last but not least, these are the actual network devices like routers, switches, and servers that the NMS manages through SNMP.
These components work in harmony. For example, an SNMP agent gathers CPU utilization data from a managed device and stores it in the MIB. The NMS can then request this information from the MIB to analyze how well the network is performing.
Why Do You Need SNMP Monitoring Tools?
In the grand scheme of things, SNMP by itself is just a set of rules. It needs a playground and players, which is where SNMP monitoring tools become quite useful. They are the best pals of network administrators, helping them manage network components and keep everything running smoothly. They help you stay proactive rather than reactive, making it easier to spot issues before they escalate into full-blown problems.
Discovery in SNMP Monitoring Tools
Discovery is the first step in the process where the SNMP monitoring tool scans the network and identifies all the devices connected to it. This sets the stage for what can be managed and monitored. Without discovery, you’d be flying blind.
Customization and Flexibility
One size doesn’t fit all when it comes to network monitoring. SNMP monitoring tools often offer customizable dashboards and alert settings, allowing you to focus on metrics that matter most to your organization.
The Importance of Granular Visibility
Granular visibility refers to the ability to dive into the metrics of individual network components. This is vital for troubleshooting and performance optimization. For example, you can examine bandwidth usage for a specific time period or view the error rate on a particular server.
Alerting Mechanisms
Alerts are an essential feature in SNMP monitoring tools. They can be configured to notify you via email, SMS, and automated phone calls. More than just an alarm they’re a call to action that helps you proactively manage your network health.
Analyzing and Visualizing Metrics Data
These monitoring tools often come with built-in data analytics capabilities. You can create graphs, charts, and reports to visualize the data, making it easier to interpret complex network metrics. This is a key asset for decision-making and strategic planning.
Simplifying Compliance and Audits
Many SNMP monitoring tools come equipped with features that assist in compliance with industry regulations. They can generate reports that prove your network is operating within the bounds of legal requirements, simplifying the audit process.
When SNMP Monitoring Is Worth the Effort (and When It Isn’t)
SNMP monitoring gives deep visibility into network devices and infrastructure, but it comes with tradeoffs. It is powerful when you need low-level data. It is frustrating when used without a clear goal.
SNMP shines in environments with dedicated hardware. Switches, routers, firewalls, load balancers, and storage systems expose rich metrics through SNMP. Interface errors, packet drops, temperature, fan speed, and capacity are all visible long before users notice problems.
This makes SNMP good for early warning. A network device rarely fails without signals. Error counters climb, buffers fill, or hardware sensors drift out of range. SNMP catches this slow degradation that basic uptime checks miss.
It also works well for capacity planning. SNMP counters show long-term trends in bandwidth, disk usage, and utilization. This helps teams plan upgrades based on data instead of guesswork.
Where SNMP struggles is application context. It tells you what a device is doing, not why users are affected. A switch can report clean metrics while an app is down due to config or dependency issues. SNMP alone cannot explain user-facing failures.
Setup and maintenance are another cost. SNMP requires configuration on every device, credential management, version choices, and polling intervals. Misconfigured SNMP leads to gaps or noisy data. In fast-changing environments, keeping this accurate takes effort.
Security also needs care. Exposing SNMP without proper controls is risky. Read-only access, strong community strings or credentials, and network restrictions are non-negotiable. SNMP is useful, but it should not be open by default.
Polling frequency matters too. Aggressive polling increases load and noise. Sparse polling delays detection. Finding the right balance depends on device type and failure impact. There is no universal setting that works everywhere.
The most effective use of SNMP is focused. Monitor the devices that form shared failure points and matter during incidents. Pair SNMP data with external uptime checks and application monitoring so hardware signals connect to real impact.
SNMP monitoring is not about collecting every metric available. It is about surfacing early, actionable signs that infrastructure is drifting toward failure.
How Does UptimeRobot Help with SNMP Monitoring?
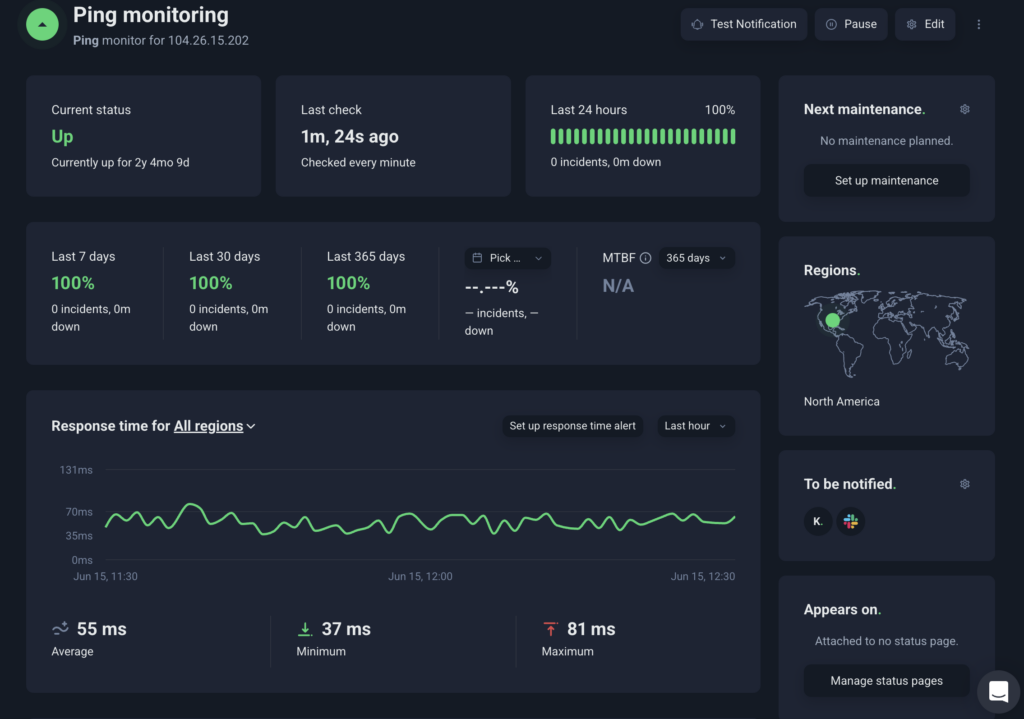
So you’re convinced that SNMP monitoring is the way to go. But how does UptimeRobot fit into the picture? Well, it takes the complex world of network monitoring and simplifies it, making your life a whole lot easier. Here’s how:
No Networking Degree Required
UptimeRobot is designed to be user-friendly. The setup is quick and straightforward, so you can start keeping tabs on your network right away, even if you’re not a technical wizard.
Alerts and Updates Tailored for You
With UptimeRobot, you’re in control. You can set your own criteria for alerts. If something isn’t right, you’ll know about it immediately, letting you take action before a small hiccup turns into a big problem.
In short, UptimeRobot puts you in the driver’s seat for network monitoring, making the process more manageable and less stressful. So what’re you waiting for? Create your free account today!
FAQ's
-
SNMP monitoring uses the Simple Network Management Protocol to collect metrics and status data from network devices. It lets you track things like interface traffic, device uptime, CPU load, and memory usage. This is commonly used for routers, switches, firewalls, and printers.
-
Most network hardware supports SNMP out of the box. This includes routers, switches, load balancers, UPS devices, and many servers. Support depends on the device firmware and whether SNMP is enabled.
-
SNMP can collect metrics such as bandwidth usage, error rates, CPU and memory utilization, and device health status. Data is exposed through object identifiers (OIDs). What you can monitor depends on the device’s MIB definitions.
-
Polling means the monitoring system regularly asks devices for metrics. Traps are event-based messages sent by the device when something changes, like an interface going down. Polling gives consistent visibility; traps provide faster alerts for specific events.
-
It can be, but only if configured correctly. Older versions like SNMPv1 and v2c use plaintext community strings and are not secure. SNMPv3 adds authentication and encryption and should be used in production environments.