Logs record everything from routine activity to critical failures, but not every event deserves the same response. Logging levels help separate normal operations from warnings, errors, and failures that need attention, making it easier to troubleshoot issues and prioritize what matters.
This article explains the standard logging levels, when to use each one, and how they fit into modern logging practices. It also covers practical topics like structured logging, filtering, alerting, and adding context to log data so your team can investigate problems faster without getting buried in noise.
Key takeaways
- Logging levels classify events by severity, making it easier to identify the issues that need immediate attention.
- Consistent use of log levels reduces noise and makes logs easier to search, filter, and troubleshoot.
- Most logging frameworks support standard severity levels such as Emergency, Error, Warning, Informational, and Debug.
- High-severity log levels can trigger alerts, helping teams detect and respond to critical issues more quickly.
- Combining log levels with structured logging and contextual data makes troubleshooting faster and improves visibility across modern applications.

What is a logging level?
A logging level, also known as log severity, indicates how important a log message is. It provides a consistent way to categorize application and system events based on their urgency.
This system is for developers and IT teams to prioritize incidents, configure alerts, and investigate problems more efficiently. It also makes large volumes of log data easier to search, filter, and analyze without treating every event the same.
The evolution of logging: From Syslog to modern frameworks
The concept of logging levels dates back to the early 1980s with the introduction of Syslog, a standard created for Unix systems that assigned a severity level to every log message.
Originally developed as part of the Sendmail project, Syslog provided a consistent way to collect, categorize, and prioritize log data across servers and network devices.
Although modern applications use a wide range of programming languages and logging frameworks, the basic idea remains the same. Popular frameworks such as Log4j and Logback for Java, Python’s logging module, Go’s slog package, and Microsoft’s ILogger all use severity levels to distinguish routine events from warnings, errors, and critical failures.
The naming and number of levels may vary slightly between frameworks, but the goal is always to help developers filter logs, troubleshoot issues, and decide which events require immediate attention.
Today, logging levels are a core part of modern observability. They feed centralized logging platforms, dashboards, and alerting systems, making it possible to manage large volumes of log data across distributed applications and cloud environments.
Types of logging levels
Many logging frameworks allow teams to customize how log messages are handled, but they still build on the standard Syslog severity hierarchy. The hierarchy defines eight log levels, ranging from Emergency to Debug, giving developers and IT teams a consistent way to classify events by severity.
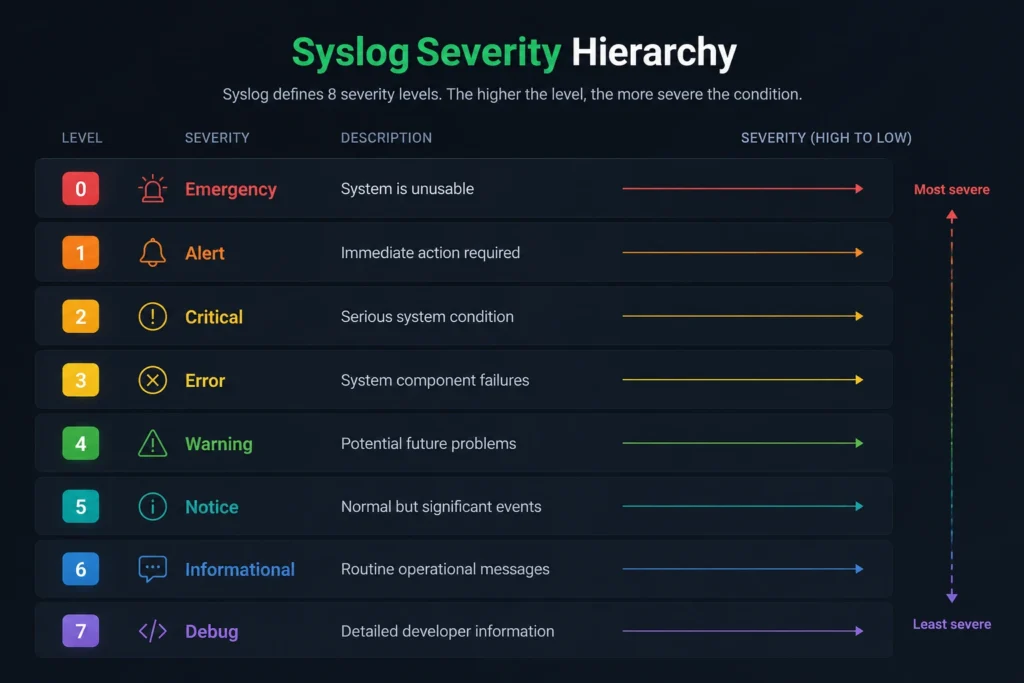
SysLog severity hierarchy
Understanding logging levels
Each logging level serves a different purpose. Here’s what they mean, generally.
Emergency/Fatal
Emergency (or Fatal in some logging frameworks) is reserved for unrecoverable failures that prevent an application or system from continuing to operate.
Examples include critical startup failures, missing configuration required for the application to run, or essential services becoming unavailable. These events typically require immediate intervention.
Alert
Alert indicates a condition that requires immediate attention before it develops into a critical failure. These could be the loss of a redundant service, a database reaching a critical threshold, or another issue that could soon affect availability if left unresolved.
Critical
Critical indicates a serious failure that disrupts an important function or service. Application crashes, failed background jobs, or services that can no longer process requests are common examples. These issues require prompt action to restore normal operation.
Error
The Error level indicates that an operation or request has failed, but the application or system can continue running. These can show up as failed API requests, unsuccessful database queries, or unexpected exceptions that affect specific functionality rather than the entire system.
Warning
Warning highlights unexpected behavior that doesn’t stop the application from working but could develop into a larger issue if ignored. High resource usage, repeated retries, configuration issues, and deprecated API calls are common examples.
Notice
Notice records significant events that fall outside routine operation without indicating a problem. Configuration changes, scheduled maintenance, or successful failovers often appear at this level to provide useful operational context.
Informational
Informational logs record normal application activity, such as successful requests, completed tasks, or service startup and shutdown events. They provide a record of expected system behavior without indicating a problem.
Debug
Debug logs provide detailed information about how an application is executing. They’re primarily used during development and troubleshooting to trace code execution and diagnose unexpected behavior.
Because they generate large volumes of data, they’re typically disabled in production environments.
How to implement log levels in your application code
Most logging frameworks let you assign a default logging level, often called the root level, which determines the minimum severity that gets recorded. During development, teams typically use lower thresholds such as Debug or Trace to capture detailed information while testing new features and troubleshooting issues. In production, the root level is usually raised to Info or Warning to reduce unnecessary log volume and improve performance.
Although frameworks vary, the same principles apply across Java, Python, Go, .NET, and other languages. Choose the lowest level that accurately reflects the event instead of logging everything as an error.
One common source of confusion is the difference between Trace and Debug. Trace logs capture highly detailed execution data, such as function calls, variable values, and code paths. Debug logs focus on information that’s useful for diagnosing issues without recording every step the application takes. In most production environments, both levels remain disabled unless teams are investigating a specific problem.
The importance of structured logging
Traditional log files store information as plain text, which is easy for humans to read but harder for software to process at scale. Structured logging records each log entry as a set of standardized fields, often using formats such as JSON.
This approach makes logs easier to search, filter, and analyze across centralized logging platforms. Instead of parsing free-form text, monitoring tools can reliably identify fields such as timestamps, log levels, services, users, and error codes.
Structured logging also builds a stronger foundation for automation. Modern observability platforms, analytics tools, and AI-powered systems can process structured log data much more accurately than unstructured text, making it easier to detect patterns, investigate incidents, and generate meaningful insights.
Adding context: Why the log level is only half the story
A log level tells you how serious an event is, but it doesn’t explain what happened or how it relates to the rest of the system. Modern applications often generate thousands of log entries during a single request, especially in distributed or microservices-based environments.
Adding contextual information makes those logs much more useful. Fields such as Trace IDs, Correlation IDs, user identifiers, service names, request paths, and environment details allow teams to follow a request as it moves between services and quickly identify where a failure occurred.
Combining consistent log levels with structured, contextual data gives developers and IT teams a much clearer picture during troubleshooting. Instead of investigating isolated log messages, they can reconstruct the full sequence of events that led to an issue and resolve problems more quickly.
How to use logging levels efficiently
Logging levels are most effective when they’re paired with a clear monitoring strategy. Filtering, alerting, and reporting based on log severity helps teams focus on the events that require attention while reducing unnecessary noise.
1. Filter logs by severity
Filtering logs by severity makes it easier to find the information you need during troubleshooting. For example, developers may focus on Debug logs while investigating an issue, whereas production dashboards often display only Warning, Error, and Critical events to highlight potential problems.
2. Configure alerts for high-severity events
Not every log message should generate an alert. Reserve notifications for high-severity events such as Critical or Emergency logs, and use lower-severity levels primarily for investigation and diagnostics. This reduces alert fatigue and helps teams respond more quickly when genuine incidents occur.
3. Monitor trends over time
Changes in log volume can reveal emerging problems before they affect users. A sudden increase in Warning or Error messages may point to performance issues, configuration problems, or failing dependencies. Tracking these trends alongside system metrics provides a more complete picture of application health.
The log management lifecycle: From collection to analytics
Logging doesn’t stop when an application writes a message. In most environments, log data moves through a pipeline that collects, processes, stores, and analyzes events from across the infrastructure.
A typical log management lifecycle includes:
- Instrument: Configure applications and services to generate meaningful log messages with consistent severity levels.
- Centralize: Send logs from multiple systems to a centralized logging platform instead of storing them locally.
- Search: Index log data so teams can quickly find events during troubleshooting or investigations.
- Alert: Trigger notifications when high-severity events or unusual patterns are detected.
- Report: Analyze trends, generate dashboards, and identify recurring issues to improve system reliability over time.
Using consistent logging levels throughout this lifecycle makes it easier to prioritize incidents, automate workflows, and focus on the events that matter most.
Scaling logs across distributed cloud systems
Modern applications often run across dozens or even hundreds of services, each generating its own stream of log data. Without a strategy, log volumes can grow quickly, increasing storage costs and making important events harder to find.
Many organizations manage this by combining logging levels with sampling and filtering. High-severity events are collected and retained, while lower-severity logs may be sampled, filtered, or stored for shorter periods.
Some teams also filter low-priority logs at the edge before they’re sent to a centralized logging platform, decreasing both network traffic and storage requirements.
Effective logging is about collecting information that’s actually useful. Logging levels, filtering, and sampling help teams keep important events while avoiding unnecessary storage costs and noise.
Log levels in cybersecurity and SIEM
Log data plays an important role in cybersecurity, where security teams use it to detect suspicious activity, investigate incidents, and support compliance requirements.
Many organizations forward logs to a Security Information and Event Management (SIEM) platform, where events from multiple systems can be correlated and analyzed together.
High-severity log messages often trigger automated security workflows or alerts. Examples include repeated failed login attempts, unexpected privilege changes, unauthorized access, or unusual activity across multiple systems.
Combined with other security telemetry, logging levels make suspicious activity easier to detect and investigate.
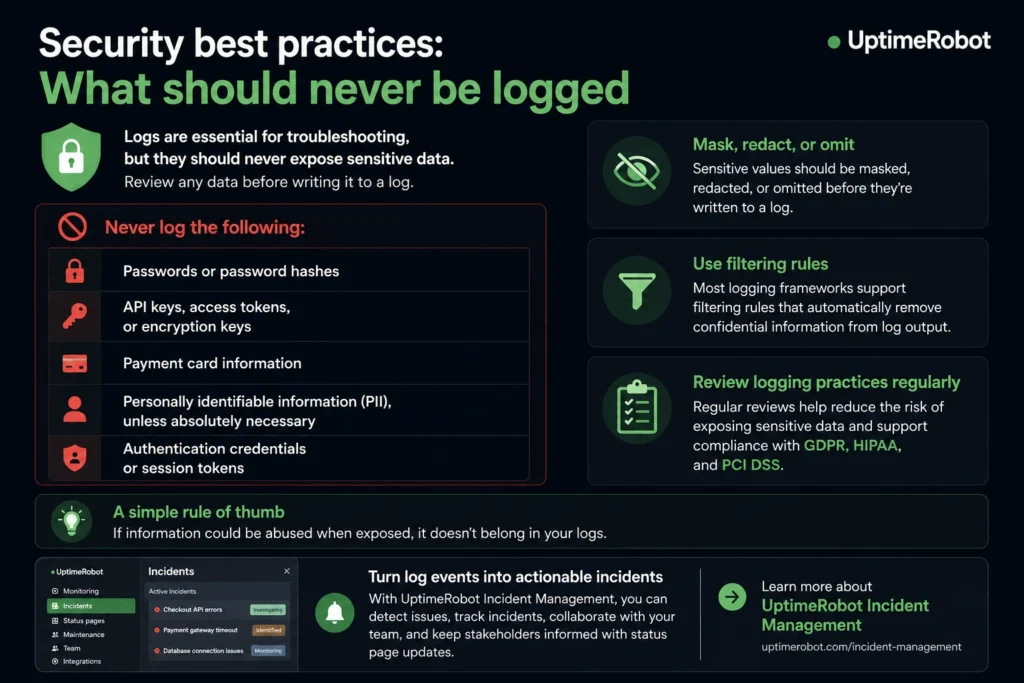
Security best practices: What should never be logged
Logs should never expose sensitive data. Before writing data to a log, review whether it could create security, privacy, or compliance risks if it were exposed.
Never log:
- Passwords or password hashes
- API keys, access tokens, or encryption keys
- Payment card information
- Personally identifiable information (PII), unless absolutely necessary
- Authentication credentials or session tokens
Sensitive values should be masked, redacted, or omitted before they’re written to a log. Most modern logging frameworks also support filtering rules that automatically remove confidential information from log output.
Regular reviews of logging practices help reduce the risk of exposing sensitive data and support compliance with regulations such as GDPR, HIPAA, and PCI DSS.
What not to monitor in logs
How to use log levels to reduce noise without losing signal
Logging levels are only useful when they’re applied consistently. Clear definitions help teams prioritize incidents, reduce alert fatigue, and find important events more quickly.
Assign a clear purpose to each level
Each logging level should represent a specific type of event. If routine activity is logged as an error, or critical failures are logged as informational messages, the distinction between normal and abnormal behavior quickly disappears.
Use lower-severity logs for troubleshooting
Debug and Trace logs provide detailed information during development and investigations, but they generate large volumes of data. Keep them disabled in production unless you’re troubleshooting a specific issue. Informational logs should record normal application activity without triggering alerts.
Reserve high-severity levels for actionable events
Warnings highlight unexpected but recoverable conditions, while Error, Critical, and Fatal logs should indicate failures that require investigation or immediate action. If high-severity events occur constantly, they lose their value as reliable indicators of real problems.
Keep severity levels consistent
Whether your team uses Fatal or Critical is less important than using the same definitions across every application and service. Consistent severity levels make logs easier to search, correlate, and interpret during incidents.
Match log levels to your alerting strategy
Not every log message needs to generate an alert. Reserve notifications for high-severity events and use lower-severity logs to provide context during investigations. This reduces unnecessary noise and helps teams respond more effectively when genuine incidents occur.
Conclusion: Logging with purpose
Effective logging starts with assigning the right severity to every event. From there, structured logging, contextual metadata, and consistent standards turn individual log messages into a valuable source of operational insight.
Logging levels support everything from day-to-day troubleshooting to production monitoring and security investigations. When every team follows the same severity definitions, log data becomes much easier to search, correlate, and understand.
Move from detection to resolution
Once high-severity log events trigger an alert, UptimeRobot’s Incident Management gives your team a central place to track incidents, coordinate responses, and keep stakeholders informed with status page updates.
Sign up for our Team plan or above to start managing incidents like a pro.
FAQ's
-
Log levels classify log messages by severity and purpose. They help you filter noise, focus on actionable events, and understand what’s happening in your system at different depths. Using consistent levels makes troubleshooting faster.
-
DEBUG logs are detailed and verbose, meant for development or deep troubleshooting. INFO logs record normal application behavior, like startup events or completed tasks. In production, INFO is usually enabled while DEBUG is turned off.
-
Use WARN when something unexpected happens but the system can still function. Use ERROR when an operation fails and requires attention. WARN signals potential risk; ERROR signals a real problem.
-
No. ERROR means a request or operation failed, but the application can usually continue running. FATAL indicates a critical failure that forces the application to stop or restart.
-
Excessive logging makes it harder to find real issues and increases storage and processing costs. It can also hide important signals in noise. Good logging is selective and intentional.