Imagine this: Every night at 2 AM, your server slows down. Apps lag, users start complaining, and your monitoring alerts won’t stop buzzing. You notice a spike in CPU and memory, but you’re not sure what’s causing it.
After some digging, you discover a cron job running at that exact time. It’s a script meant to quietly process logs, but instead, it’s eating up all your system’s resources. The script looks fine, so what’s going on?
Situations like this happen more often than you realize. This is exactly when you need access to crontab logs.
Crontab logs give you the visibility to make sure your scheduled tasks are running smoothly. They let you check whether a job ran successfully, when it ran, and what might have gone wrong.
In this article, you’ll learn more about crontab logs, how to find and read them, and how to fix common issues. We’ll also look at how monitoring tools like UptimeRobot can make it easier to track your cron jobs.
Key takeaways
- Crontab logs show when cron jobs run, if they succeed or fail, and help with debugging.
- You can find cron logs in
/var/log/syslog,/var/log/cron, or viajournalctlon systemd systems. - Use
>> logfile 2>&1in crontab to capture output and errors for better troubleshooting. - Missing environment variables and relative paths are common causes of cron job failures.
- Tools like UptimeRobot or Healthchecks.io monitor cron jobs with alerts if they don’t run.
- In Docker/Kubernetes/CI, redirect output to stdout/stderr or use job logs/artifacts for visibility.
What are crontab logs, and why do they matter?
Cron is a tool used in Unix-like systems (like Linux or macOS) to automatically run commands or scripts at specific times – for example, every hour, every night, or once a week. These scheduled tasks are called cron jobs.
You set up cron jobs in a special file called a crontab (short for “cron table”). The system has a background process, called the cron daemon, that keeps checking the crontab and runs the jobs when it’s time.
When cron runs a job, it creates a log entry. These entries are known as crontab logs. By default, crontab logs record when a scheduled command was run and what command was executed. However, they do not provide detailed information such as:
- When a job finished
- Whether it ran successfully or failed
- Any errors or warnings that occurred
- If a job was delayed or skipped
To capture this additional information, you need to wrap your cron jobs by redirecting output to log files or using monitoring tools to track execution status and results.
Why crontab logs matter
Crontab logs are important because they tell you when your scheduled commands were executed, which helps you confirm that your jobs are running at the expected times. While they do not show whether the command succeeded or failed by default, they still provide a crucial starting point for troubleshooting missed or mistimed jobs. For full visibility into job success, output, and errors, you should combine cron logs with additional logging in your scripts or use a dedicated cron monitoring tool.
Who uses crontab logs? Real-world scenarios
Crontab logs are essential for anyone responsible for keeping systems stable, secure, and compliant. Here’s how different roles rely on crontab logs in the real-world.
Sysadmins
Sysadmins use crontab logs to monitor the health of critical maintenance tasks like log rotation, security updates, disk cleanups, or reboots.
For example, a failed log rotation job could fill up disk space and crash services. By checking crontab logs, they can catch and resolve these issues before they escalate.
Developers
Developers often schedule background scripts for repetitive tasks like sending reminder emails to users, cleaning up temporary files, and generating daily reports.
If a script silently fails or behaves unexpectedly, cron logs are the first place to look. Logs show whether the job ran at all, and capture any error messages or runtime issues.
DevOps engineers
In large-scale environments with many servers or containers, DevOps teams use cron to automate database backups, service restarts, and log archival. Crontab logs help them track these jobs across the infrastructure.
Combined with monitoring tools and central logging (like ELK or Datadog), they ensure nothing gets missed.
Compliance teams
Compliance teams rely on crontab logs to verify that essential jobs like data backups, encryption routines, or audit trail exports ran successfully and on schedule.
For example, in a financial company, a missed data export job could lead to incomplete reporting or regulatory violations. Crontab logs provide the necessary evidence to prove these tasks were executed.
Where are crontab logs stored?
Cron logs are stored in different locations depending on your operating system:
- Ubuntu/Debian:
/var/log/syslog - CentOS/RHEL:
/var/log/cron - macOS:
/var/log/system.log
To confirm where your cron logs are written, check your system’s logging configuration files, such as /etc/rsyslog.d/ or /etc/syslog.conf. Some systems may use custom log files like /var/log/cron.log if redirected by the administrator.
You can also search all log files for recent cron activity using: grep -i cron /var/log/*
Note: Cron log files are usually rotated regularly using tools like logrotate to prevent them from growing too large. Rotated logs may be compressed or archived automatically, so you might find older logs with extensions like .1, .gz, etc.
How to view crontab logs
The location of your crontab logs may vary based on the operating system.
On systemd-based systems (Modern Linux)
Most modern Linux distributions (like Ubuntu 20.04+, CentOS 8+, Debian 10+) use systemd for service and log management. In these systems, cron job logs are stored in the systemd journal.
- To view all cron logs:
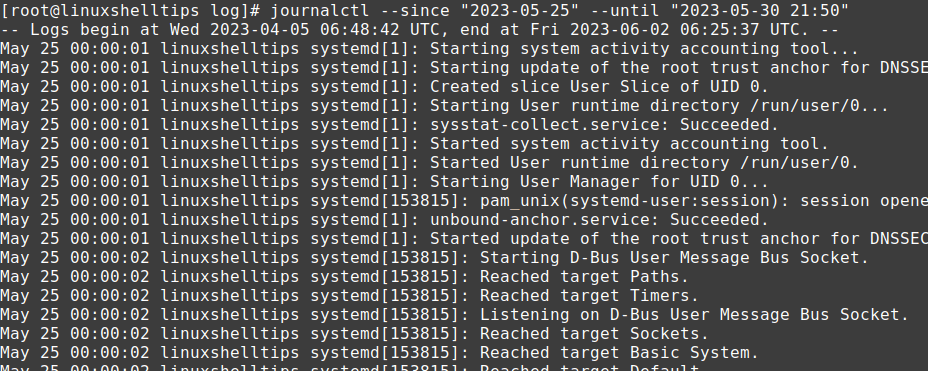
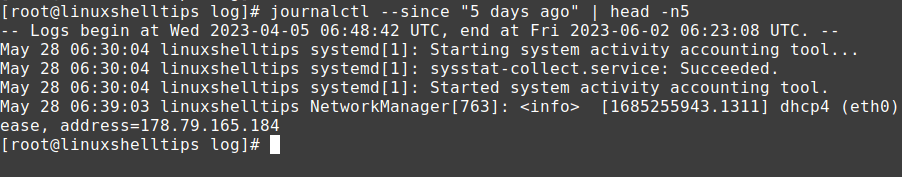
journalctl -u cron - To view logs for a specific time period:
journalctl -u cron --since "2025-06-01"
- If you want to follow live cron logs:
journalctl -u cron -f - On some systems, the service may be named crond. In that case, use:
journalctl -u crond
Note: Some systemd systems may not log user-level cron jobs by default unless the job outputs something (like errors or messages). If logs seem incomplete, check:
/var/log/syslog(Debian-based systems may duplicate cron logs here)- Your distro’s cron service and logging configuration
On non-systemd systems (Classis syslog/rsyslog)
Older Linux distributions and some Unix-like systems (like older CentOS, Ubuntu <15.04, or BSD variants) don’t use systemd. Instead, they rely on traditional log files written by syslog or rsyslog.
To view cron logs in these systems:
On Debian/Ubuntu
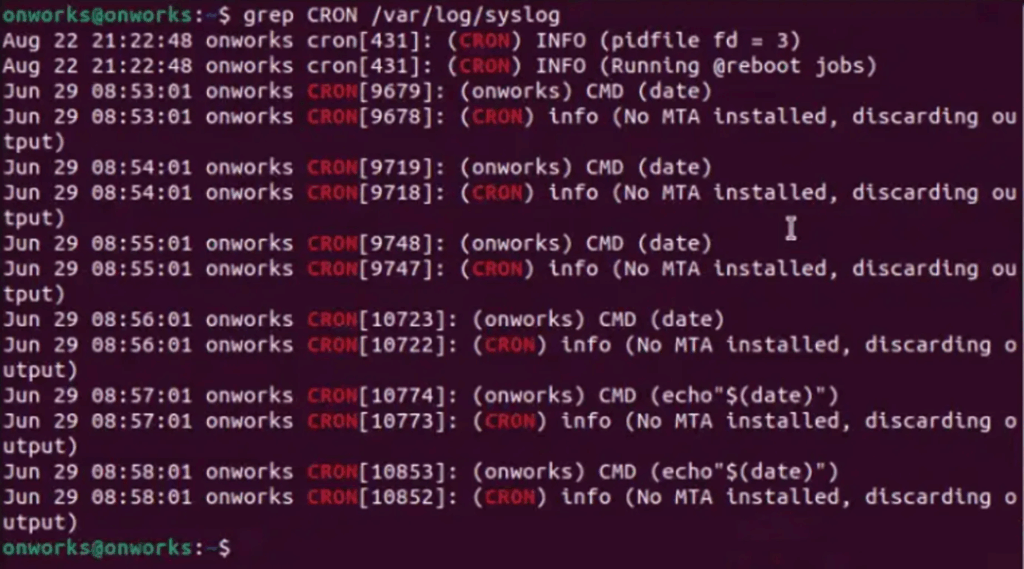
- View all cron job entries in syslog:
grep CRON /var/log/syslog
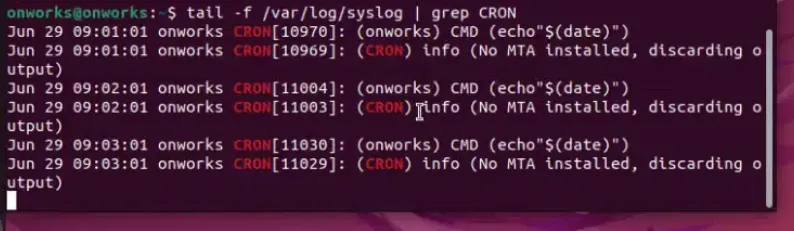
- Check out the latest cron log entries:
tail -f /var/log/syslog | grep CRON
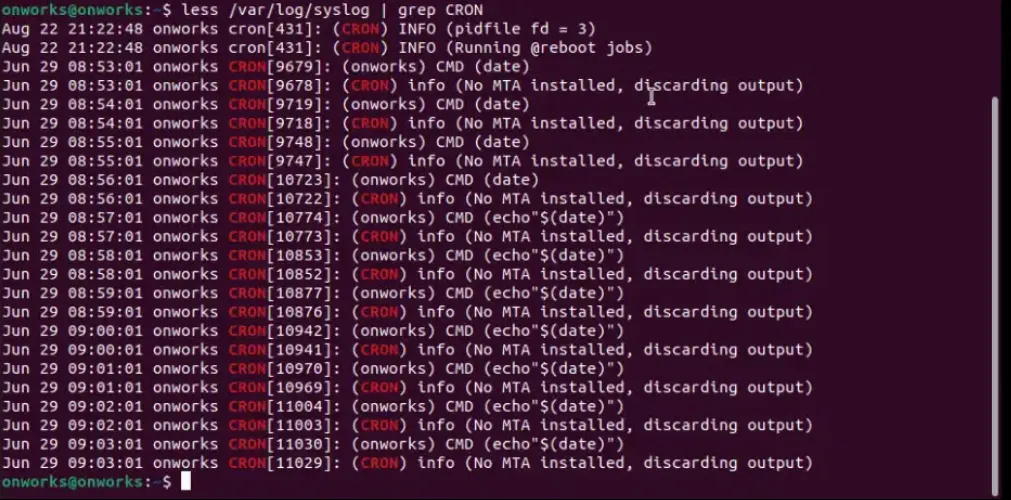
- View detailed log examination:
less /var/log/syslog | grep CRON
On CentOS/RHEL
You can use similar commands for CentOS/RHEL operating system by changing the file location. Let us see them below:
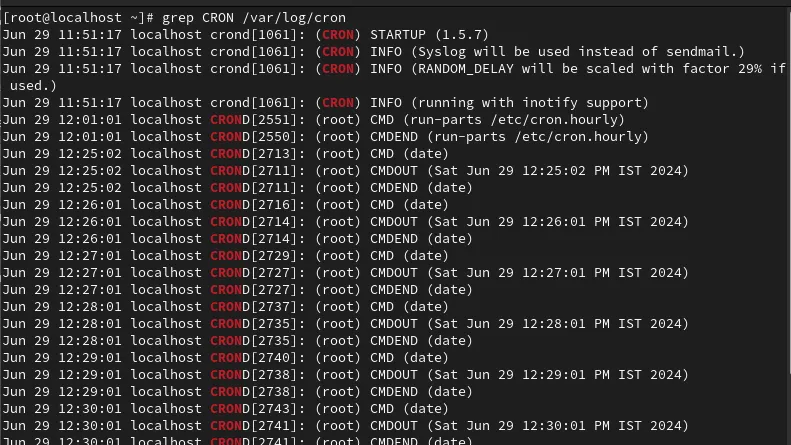
- View all cron job entries in the cron log:
grep CRON /var/log/cron
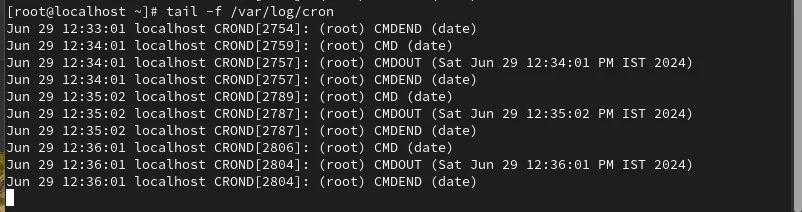
- Check out the latest cron log entries:
tail -f /var/log/cron
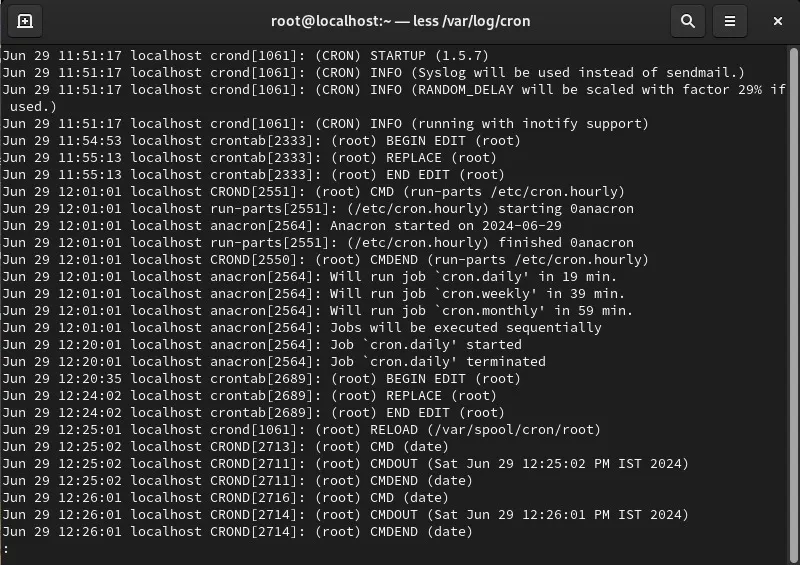
- View detailed log examination:
less /var/log/cron
On macOS
You can check cron logs on macOS using this command: tail -f /var/log/syslog | grep cron
How to view crontab logs on different operating systems
| Operating system type | Situation | Command to view cron logs |
| Systemd-based (like Ubuntu 20.04+, CentOS 8+, Debian 10+) | To view all logs | journalctl -u cron (or journalctl -u crond) |
| To view logs since a date | journalctl -u cron –since “2025-06-01” | |
| To follow live cron logs | journalctl -u cron -f | |
| Non-systemd (Debian/Ubuntu) | View all cron job entries | grep CRON /var/log/syslog |
| Follow latest cron logs | tail -f /var/log/syslog | grep CRON | |
| Browse detailed log history | less /var/log/syslog | grep CRON | |
| Non- systemd (CentOS/RHEL) | View all cron job entries | grep CRON /var/log/cron |
| Follow latest cron logs | tail -f /var/log/cron | |
| Browse detailed log history | less /var/log/cron | |
| macOS | View and follow cron logs | tail -f /var/log/system.log | grep cron |
How to enable cron logging (if missing)
If cron logging is not enabled on your system, you can enable it by configuring your system’s logging service (usually rsyslog or syslog-ng):
Check the config file:
- For rsyslog, the config is typically at
/etc/rsyslog.d/50-default.confor/etc/rsyslog.conf - For syslog-ng, check
/etc/syslog-ng/syslog-ng.conf
Enable cron logging:
Look for a line like this in your rsyslog config: cron.* /var/log/cron
Note: This configuration applies to CentOS/RHEL systems, where cron logs are typically stored in /var/log/cron.
If it’s missing or commented out, add or uncomment it to log cron messages to /var/log/cron.
Create the log file (if needed):
If /var/log/cron does not exist, create it and set appropriate permissions:
sudo touch /var/log/cron
sudo chmod 600 /var/log/cron
For Ubuntu/Debian systems, cron logs are usually stored in /var/log/syslog along with other system logs. You can view them with:
grep CRON /var/log/syslogAfter making changes, restart rsyslog and cron to apply them:
sudo systemctl restart rsyslog
sudo systemctl restart cron   # On Ubuntu/Debian
sudo systemctl restart crond  # On CentOS/RHEL
Once done:
- On CentOS/RHEL, cron logs should start appearing in
/var/log/cron(or your configured log file). - On Ubuntu/Debian, cron logs will continue to appear in
/var/log/syslog.

Redirecting cron output to custom log files
You can redirect both standard output and error from your cron job to a custom log file by modifying your crontab entry like this: * * * * * /path/to/script.sh >> /path/to/logfile.log 2>&1
The asterisks (* * * * *) in the above command are placeholders for the schedule and must be replaced (or left as-is intentionally) depending on when and how often you want the cron job to run. If you need help generating the correct cron syntax for your schedule, try using a free cron expressions generator to avoid syntax errors.
Here is what each asterisk means:
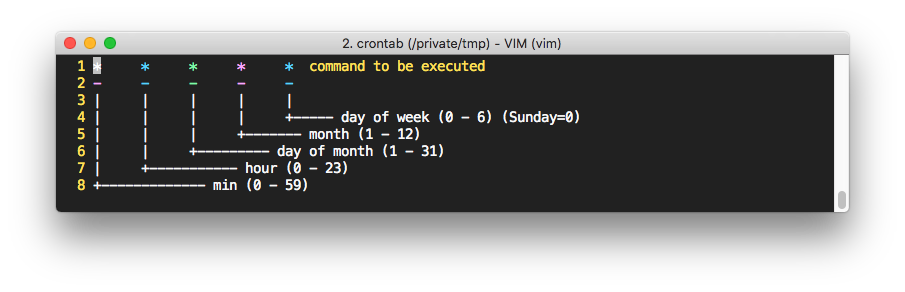
For example, when you run the command 0 3 * * * /path/to/backup.sh >> /var/log/backup.log 2>&1
This means: Run backup.sh every day at 3:00 AM and save both standard output and errors to /var/log/backup.log.
When should you use cron output redirection?
Use output redirection when you want full visibility into what your cron jobs are doing.
- You’re writing a custom script that might fail, produce warnings, or behave differently in cron than in the shell.
- You’re running critical jobs, like database backups, billing processes, or file transfers, where visibility is essential.
- You’re testing a new cron job and want to verify that it works as expected.
- You need per-job logs instead of searching through system-wide logs like
/var/log/syslog. - You work in a multi-user or multi-server environment, where centralized and job-specific logging improves maintainability.
Why output redirection matters
Logging your cron job output is important for reliability and helps identify issues quickly.
- Avoid missing errors: By default, cron does not log the output of your scripts, it only logs that the job ran. If something inside your script breaks or prints warnings, those messages are lost unless you explicitly capture them. Redirecting both standard output (
stdout) and standard error (stderr) ensures you don’t miss anything important.
- Debugging: If your script doesn’t behave as expected, having a log of what it actually did (or failed to do) helps pinpoint the issue. You’ll see any error messages, unexpected outputs, or missing variables right in the log. This is especially useful if your script runs fine manually but fails under cron.
- Auditing and traceability: Keeping a history of cron job runs, along with their output, creates a lightweight audit trail. You can look back to see when a task last ran, how long it took, and whether it produced the expected output. This is useful for system reviews, performance checks, and troubleshooting long-term trends.
- Customize log storage: You can choose a dedicated log file for each job (e.g.,
/var/log/db-backup.logor/var/log/cache-cleaner.log), making it easy to isolate and analyze logs per task instead of searching through a giant system log.
Advanced crontab debugging techniques
When a cron job silently fails or behaves unexpectedly, cron logs can help you figure out why. Here are some advanced crontab debugging techniques to help you troubleshoot and fix tricky cron problems.
1. Use full paths in scripts and commands
Problem: Cron runs in a limited environment and doesn’t load your user’s full shell profile.
Fix: Always use absolute paths for commands and files.
Instead of: python myscript.py
Use: /usr/bin/python3 /home/user/scripts/myscript.py
You can find the full path of a command by running which <command> (e.g., which python3).
2. Use env to check cron’s environment
Problem: Your script works in the terminal but not in cron.
Fix: Create a temporary cron job that outputs its environment variables: * * * * * env > /tmp/cron_env.txt
Then compare /tmp/cron_env.txt with env output from your terminal to spot missing variables like PATH, HOME, etc.
3. Redirect output for logging
Problem: You don’t see any output when something goes wrong.
Fix: Redirect both standard output and standard error to a file: 0 * * * * /path/to/script.sh >> /var/log/script.log 2>&1
This lets you capture error messages and debug prints directly.
4. Set up email notifications
Problem: You miss silent failures.
Fix: If your system has mail configured, cron can email output by default.
Set your email in the crontab: MAILTO="you@example.com"
Make sure mailutils or sendmail is installed and working.
5. Wrap your script with a debug-friendly wrapper
Problem: Your script is complex and hard to debug inside cron.
Fix: Create a wrapper shell script that:
- Logs timestamps
- Logs environment
- Captures errors
- Exits with status codes
#!/bin/bash
echo "=== Cron Run: $(date) ===" >> /var/log/myjob.log
env >> /var/log/myjob.log
/path/to/original-script.sh >> /var/log/myjob.log 2>&1
echo "Exit code: $?" >> /var/log/myjob.log
6. Check for permission issues
Problem: Your cron job fails silently because it doesn’t have the right permissions to access files, execute scripts, or write logs.
Fix: Ensure that the cron user has:
- Execute permissions on the script (
chmod +x script.sh) - Read/write access to any files or directories used by the script
- Write access to the custom log file (if using output redirection)
| Crontab log issue | Symptom | Debugging solution |
| Missing environment variables | Script runs manually but fails in cron | Set required variables explicitly inside the script or use a wrapper script to load them. |
| Relative paths not working | Files or directories not found | Always use absolute paths in your scripts. Cron runs with a minimal environment. |
| No output or errors logged | Cron runs but produces no visible result | Redirect stdout and stderr to a log file using >> /path/to/log.log 2>&1. |
| Can’t monitor all cron logs manually | You miss silent failures | Add MAILTO="your@email.com" at the top of the crontab to receive emails when something fails. |
| Complex script | Job fails silently, or is difficult to debug | Create a shell wrapper that logs environment, outputs errors, timestamps, etc. |
| Permission issues | Script fails silently or cannot access/write to resources | Ensure the cron user has correct permissions for script, files, and log locations. |
If you want to learn more about the world of Cron, make sure to read our complete cron job guide.
Crontab logs in Docker, Kubernetes, and CI/CD pipelines
In traditional server setups, cron logs are usually written to system log files like /var/log/cron or captured by systemd’s journal. However, in containerized environments like Docker and Kubernetes, this approach changes significantly.
Crontab logs in Docker
When running cron jobs inside Docker containers, logs behave differently compared to traditional servers. Docker captures and stores output only from the container’s main process (the one started by ENTRYPOINT or CMD). However, cron runs as a child process inside the container, so its output (stdout and stderr) does not automatically appear in Docker logs.
To make cron job outputs visible in Docker logs, you need to redirect the job’s output to the container’s main process stdout and stderr using these special file descriptors:
*/1 * * * * root /app1/test.sh > /proc/1/fd/1 2>/proc/1/fd/2This command sends the standard output (stdout) and error output (stderr) of your cron job to the Docker container’s main process (PID 1), which Docker tracks. As a result, your cron job logs become visible via the usual docker logs [container] command.
Crontab logs in Kubernetes
Kubernetes CronJobs run inside Pods. By default, Kubernetes keeps logs for terminated Pods from the last three successful runs and the most recent failed Job. You can adjust or disable this retention via CronJob history limits.
To see your CronJob history, list the Pods:
kubectl get pods -l job-name=demo-cronExample output:
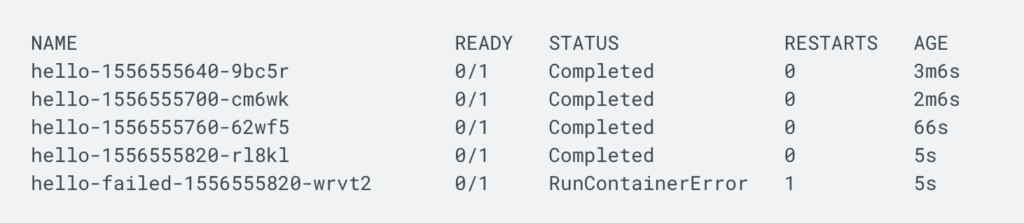
- Successful Jobs show status Completed.
- Failed Jobs may show statuses like RunContainerError or CrashLoopBackOff.
To inspect logs from a specific Pod, use:
kubectl logs POD_NAMEReplace POD_NAME with the Pod’s name from the list above.
Crontab logs in CI/CD pipelines
In CI/CD pipelines (like GitLab CI or GitHub Actions), scheduled jobs run inside temporary environments created for each pipeline execution. Unlike traditional cron jobs, logs are generated and stored within the CI/CD system during the run, and may be archived or deleted after the pipeline completes, depending on your settings.
How to manage logs effectively:
- View logs directly in your CI/CD platform’s interface for troubleshooting.
- Save important logs as pipeline artifacts to keep them beyond the job’s lifecycle.
- For advanced monitoring or compliance, export logs to external logging or alerting systems.
This setup ensures you can track job success or failure while adapting to the temporary nature of CI/CD environments.
Best practices for ephemeral logs
Follow these strategies to access ephemeral logs effectively.
- Avoid writing logs solely to local files inside containers or ephemeral runners, as these get deleted on restart.
- Redirect cron job output to stdout/stderr so container runtimes or CI/CD platforms can capture logs natively.
- Use persistent volumes if you need to keep logs on disk beyond the container lifecycle.
- Tag logs with metadata (e.g., job name, pod name, container ID) to make them easier to filter and analyze when centralized.
- Centralize your cron job logs using tools like Logstash, Fluentd, or Loki. Centralized logging makes it easier to search across multiple environments.
Using monitoring tools for cron logs
In traditional setups, cron jobs rely on log files for tracking. But as systems grow across servers, containers, or the cloud, logs alone may not be enough.
Monitoring tools offer real-time tracking, alerts, and dashboards. They help you see if cron jobs are running, finishing on time, and succeeding. This improves visibility and reduces the chance of missed or failed jobs going unnoticed.
Popular monitoring tools for cron logs:
1. UptimeRobot
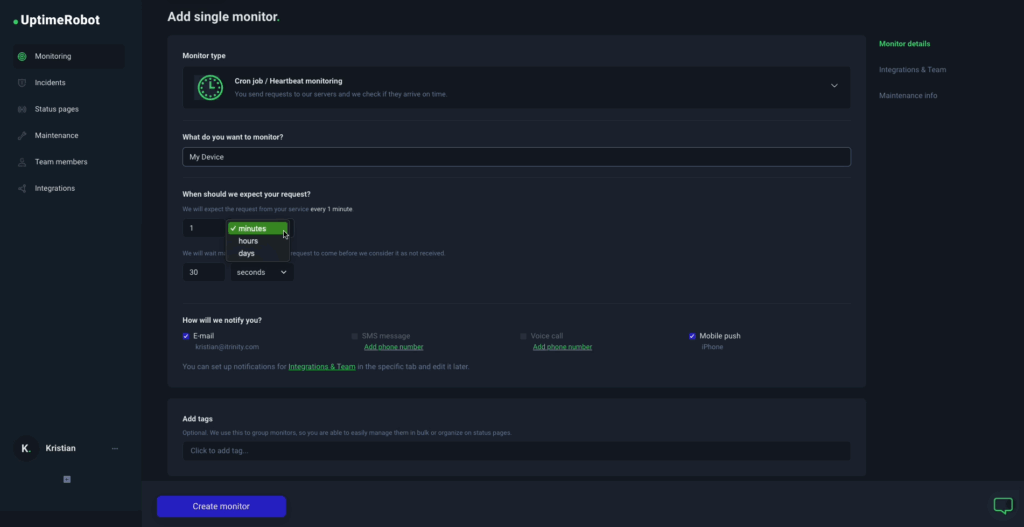
UptimeRobot is a reliable and beginner-friendly tool for monitoring cron jobs using its Heartbeat feature. It gives you a unique URL that your cron job “pings” once it finishes. If the ping doesn’t arrive on time, UptimeRobot marks the job as down and sends alerts via email, SMS, voice call, Slack, or other integrations, supporting up to 16 notification channels.
Key features:
- Heartbeat monitoring for cron jobs
- Recurring alerts until resolved
- Maintenance windows to avoid false alarms
- Incident tracking and response time monitoring
- Multi-location checks for global reliability
- SMS and voice-call notifications
The free plan allows up to 50 monitors with 5-minute intervals. Paid plans offer cron job monitoring along with more frequent checks, advanced settings, and additional alert types, making UptimeRobot a solid choice for lightweight cron monitoring without a complex setup.
2. Healthchecks.io
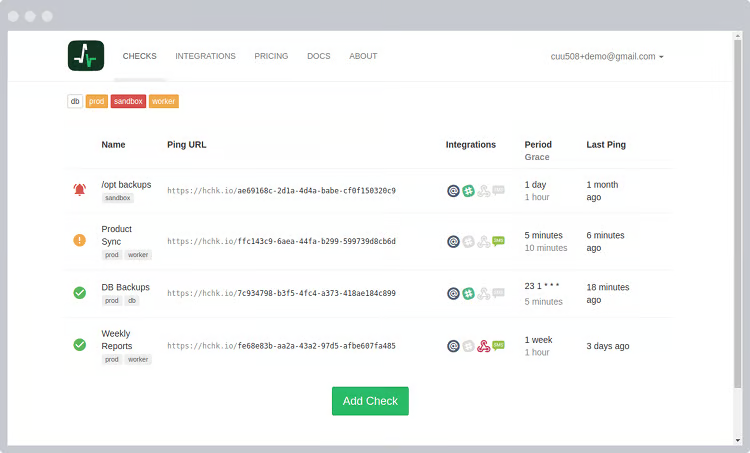
Healthchecks.io is a simple and reliable tool for monitoring cron jobs. It works by sending a “ping” (an HTTP request) from your job to a unique URL. If the system doesn’t receive the ping on time, it sends you an alert.
You get a live-updating dashboard, logs, and even a public status badge. It supports cron expressions, so you can set when to expect each job to run and how long to wait before triggering an alert.
It’s easy to set up, works well in Docker and other environments, and is free for up to 20 jobs. Paid plans are available if you need more.
3. Cronitor
Cronitor is a monitoring tool built specifically for cron jobs and scheduled tasks. It tracks whether your jobs run on time, how long they take, and whether they fail. You can monitor multiple jobs at once and get alerts through email or Slack.
Cronitor also provides charts, timelines, and historical data to help you spot patterns or delays. It’s easy to set up, with a CLI tool for quick integration and no extra software needed.
With flexible pricing—from a free plan to enterprise options—it fits teams of all sizes.
Note: For more advanced monitoring, you can use tools like Grafana and Prometheus to collect cron job metrics (using exporters or log shippers) and display them in customizable dashboards. Prometheus handles metric scraping, while Grafana provides powerful visualization and alerting features.
Crontab logs: best practices & pro tips
Let’s explore some best practices and pro tips for managing crontab logs effectively.
Log rotation policies
Cron log files can grow quickly, especially for jobs that run often. If left unchecked, they may fill up disk space and impact system performance. Use tools like logrotate to automatically archive, compress, and clean up old logs.
Here’s an example configuration:
/var/log/cron.log {
    weekly
    rotate 4
    compress
    missingok
    notifempty
}
This keeps only 4 weeks of logs, compresses old ones, and skips rotation if the log is empty or missing.
2. Retention for compliance
If your cron jobs handle sensitive or critical tasks (like database backups, billing scripts, or data transfers), you may need to retain logs for audit and compliance. Here are a few strategies:
- Use log rotation tools like logrotate to archive logs without losing them.
- Store older logs in secure, centralized storage (like S3, ELK, or a SIEM).
- Apply encryption and access control to protect log data.
- Define a retention policy based on regulations like HIPAA, SOX, or GDPR.
3. Centralizing logs with ELK Stack, Datadog, etc.
When you have multiple servers or containers running cron jobs, logs can quickly get scattered across systems. This makes it hard to track issues, monitor job performance, or meet compliance requirements.
Centralized logging solves this by collecting all cron (and system) logs in one place for easier search, alerting, and analysis.
Popular tools include:
- ELK Stack (Elasticsearch, Logstash, Kibana)
- Datadog
- Loki + Grafana
- Fluentd or Filebeat for log shipping
Redirect cron output to log files and use a log shipper to collect and forward them to your centralized system.
4. GitOps or IaC for scheduled jobs
Managing cron jobs manually can lead to inconsistencies, errors, or lost changes. That’s where GitOps and Infrastructure as Code (IaC) come in.
- GitOps: Define cron jobs in version-controlled files (like YAML or shell scripts) in a Git repository. Make changes through pull requests for better collaboration and auditability.
- IaC: Use tools like Terraform, Ansible, or Puppet to provision and maintain cron jobs as part of your infrastructure setup. This ensures consistency across environments (dev, staging, prod) and makes recovery easier.
FAQ
-
You can check the system’s cron logs, usually found at
/var/log/cron(CentOS/RHEL) or/var/log/syslog(Ubuntu/Debian). Use the grep command to search for entries related to your cron job.For example:
grep 'your-script-name' /var/log/cron or grep CRON /var/log/syslogA typical log entry might look like this:
Jun 11 19:17:01 penguin CRON[17799]: (root) CMD (cd / && run-parts --report /etc/cron.hourly) -
Make sure your cron job’s command includes output redirection for both standard output and errors, for example:
* * * * * /path/to/script.sh >> /path/to/logfile.log 2>&1Also, check that the cron daemon is running by using:
systemctl status cronAnd lastly, verify that your crontab syntax is correct. Sometimes, missing environment variables in cron can cause silent failures.
-
Yes! You can configure your system to keep cron logs long-term by rotating and archiving log files with tools like logrotate. Additionally, redirecting output to dedicated log files per job helps maintain detailed records for auditing.
-
Silent cron failures are usually caused by missing environment variables since cron jobs run with a minimal environment. To debug, run a shell script from cron that sets up the environment and logs output. For example, add this to your script:
{
  date
  env | sort
  set -x
  # your commands here
} >/tmp/cron.jobname.$$ 2>&1
Check the generated log file to identify issues like missing paths or environment variables. Also, remember that cron’s working directory is usually your home folder, so avoid relative paths or set the correct directory in your script.
-
By default, cron emails output to the user defined in the crontab. To ensure emails are sent, set the
MAILTOvariable at the top of your crontab:MAILTO="your@email.com" * * * * * /path/to/script.shMake sure your system has a mail transfer agent (like
postfixorsendmail) configured to send emails externally. -
o separate standard output and error output into different files:
* * * * * /path/to/script.sh >> /path/to/stdout.log 2>> /path/to/stderr.log>>appends standard output.2>>appends standard error.
-
This usually happens because cron runs with a minimal environment. Fixes include:
- Using absolute paths in commands and scripts.
- Defining necessary environment variables in your script or crontab.
- Checking file permissions, as cron jobs may run as a different user.
-
Yes. Tools like UptimeRobot Cron Monitoring can ping an endpoint when your cron job runs. If the expected ping isn’t received, you get an alert, ensuring you know immediately if a job fails or doesn’t run.