Infrastructure problems don’t usually show up as a single alert. CPU pressure builds, disks fill slowly, networks jitter, and dependencies strain long before anything is marked “down.” Without visibility at this layer, outages feel sudden and hard to explain.
This guide breaks infrastructure monitoring down to how it works in real environments. It looks at what to monitor across servers, networks, containers, and cloud resources, plus where teams commonly miss early warning signs. The focus is on signals that help you act, not dashboards that look busy.
You’ll learn which metrics matter most, how to interpret them together, and how to catch infrastructure issues before they cascade into downtime. If reliability depends on your stack staying healthy, this is where monitoring needs to start.
In this guide, we’ll break down:
✅ How infrastructure monitoring works – A step-by-step look at how monitoring tools collect, analyze, and visualize system data.
✅ Key components & metrics – The most critical aspects of infrastructure to monitor, from CPU usage to network latency.
✅ The role of AI & automation – How AI-driven monitoring and predictive analytics are transforming IT operations.
✅ Best practices & common pitfalls – Practical tips to implement effective monitoring while avoiding data overload and false alerts.
✅ Choosing the right tools – A comparison of top infrastructure monitoring solutions, including UptimeRobot, Datadog, New Relic, and Dynatrace.
Whether you’re managing a small business website or a large-scale enterprise IT system, understanding how to monitor and optimize infrastructure effectively will help you improve performance, reduce downtime, and ramp-up security.
What is infrastructure monitoring?
Infrastructure monitoring refers to the continuous tracking of IT systems – servers, networks, applications, and databases – to detect issues, optimize performance, and prevent downtime.
Pro Tip: Ensuring uptime Ping monitoring is a critical part of infrastructure monitoring. By continuously tracking website and server availability, businesses can detect failures early and minimize downtime, ensuring smooth operations for users.
At its core, infrastructure monitoring is about keeping IT systems healthy and running efficiently. It involves continuously tracking servers, networks, applications, and databases to detect issues, optimize performance, and prevent downtime. This real-time visibility allows IT teams to spot problems before they spiral into system failures, security vulnerabilities, or costly outages.
The need for infrastructure monitoring has never been greater. IT environments are no longer simple, standalone systems—they are increasingly complex, dynamic, and distributed. Businesses today rely on a mix of on-premise servers, cloud computing, microservices, and third-party integrations to power their operations.
Without a clear way to track performance, resource usage, and security, small issues can quickly become major disruptions.
A single undetected failure in a mission-critical system can lead to lost revenue, security breaches, and frustrated customers.
The evolution of infrastructure monitoring
Infrastructure monitoring has changed drastically over the years, evolving from manual, reactive processes to intelligent, automated systems.
Early days: Basic on-premise monitoring
In the early days of IT, infrastructure monitoring was a manual, server-focused task. IT teams relied on simple tools to track basic performance metrics like CPU usage, memory consumption, and disk space. These tools would provide alerts when a server hit critical thresholds, but they were largely reactive—problems were only addressed after they had already caused disruptions.
The lack of real-time visibility and predictive capabilities meant that outages were often unavoidable.
One of the earliest monitoring solutions, Nagios, introduced basic network and server health checks, allowing administrators to track uptime and system performance. While this was a step forward, monitoring still required constant manual intervention.
The cloud computing era: Remote & scalable monitoring
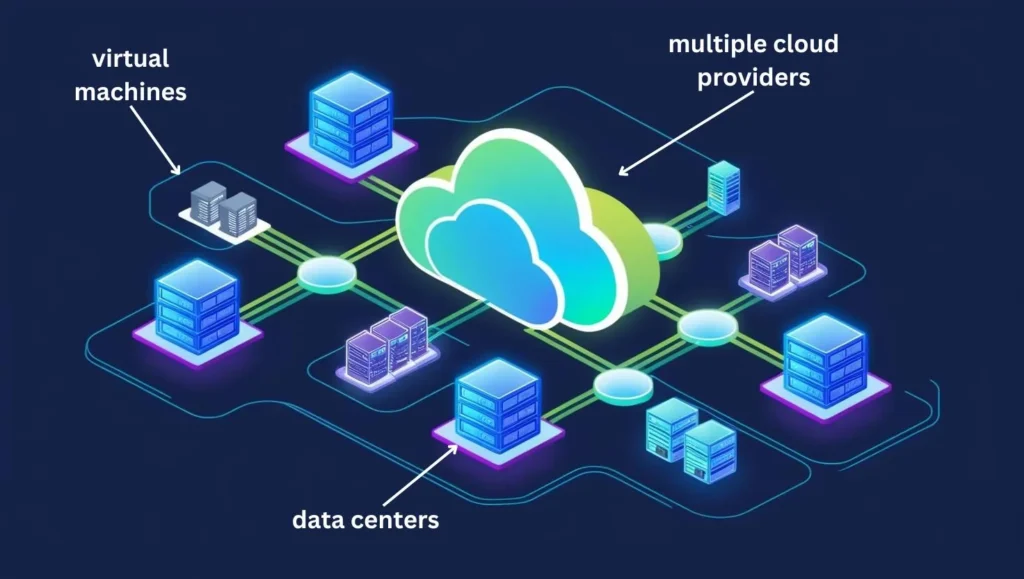
The shift to cloud computing brought new challenges. Businesses no longer relied solely on physical servers housed in a single location—instead, IT infrastructure became distributed across multiple cloud providers, data centers, and virtual machines. This shift made traditional monitoring tools inadequate, as they weren’t designed to track cloud-based workloads that could scale up or down on demand.
In response, new cloud-native monitoring platforms emerged. New tools started to offer real-time dashboards, automated alerts, and integrations with cloud providers like AWS and Azure. IT teams could now remotely track performance, receive instant notifications about system failures, and analyze historical data to identify trends.
A major example of this transformation is seen in Netflix, which operates one of the world’s most complex cloud infrastructures. Instead of waiting for issues to occur, Netflix uses real-time monitoring and automated failover systems to detect and address problems before users experience disruptions. This level of automation has become the standard for modern IT operations.
The AI-driven future: Predictive & self-healing systems
Today, infrastructure monitoring is no longer just about tracking system health—it’s about predicting and preventing failures before they happen. This is where artificial intelligence (AI) and machine learning (ML) are changing the game.
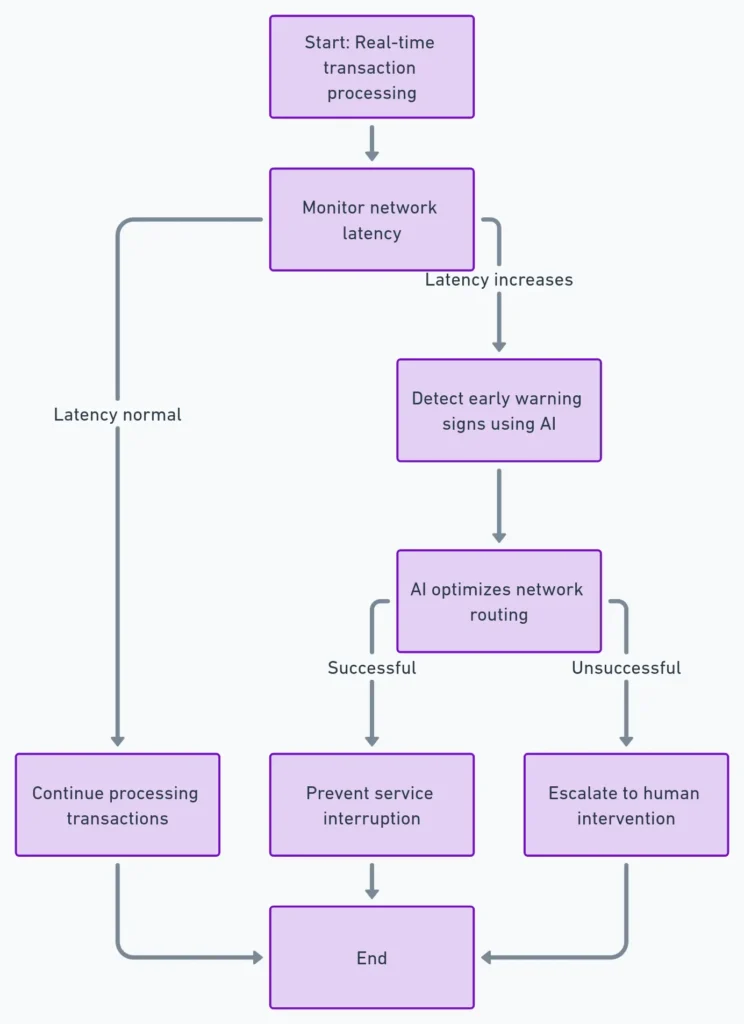
AI-powered monitoring tools like Dynatrace and Moogsoft use anomaly detection and predictive analytics to identify patterns in system behavior. Instead of IT teams reacting to alerts, the system itself can recognize early warning signs—such as unusual memory spikes or increased network latency—and take preventive actions automatically.
For example, an AI-driven monitoring system might notice that a cloud database is consistently slowing down at peak traffic hours. Instead of waiting for the issue to cause an outage, the system could dynamically allocate more resources or suggest configuration changes to improve performance.
As IT environments continue to grow in complexity—with the rise of multi-cloud architectures, edge computing, and IoT devices—predictive, automated monitoring will become the industry standard. The future isn’t just about identifying issues—it’s about solving them before they impact users.
How infrastructure monitoring works
At a high level, infrastructure monitoring is about gathering real-time data, analyzing it for anomalies, and responding to issues before they escalate. This process allows IT teams to detect failures early, optimize performance, and ensure system reliability—all while reducing operational costs.

In modern IT environments, manual monitoring is no longer practical. Infrastructure today is spread across on-premise servers, cloud platforms, containers, and microservices, creating a highly dynamic landscape. Monitoring tools have adapted to this complexity through the use of automation, AI-driven analytics, and real-time alerting.
Key steps in infrastructure monitoring
- Data Collection
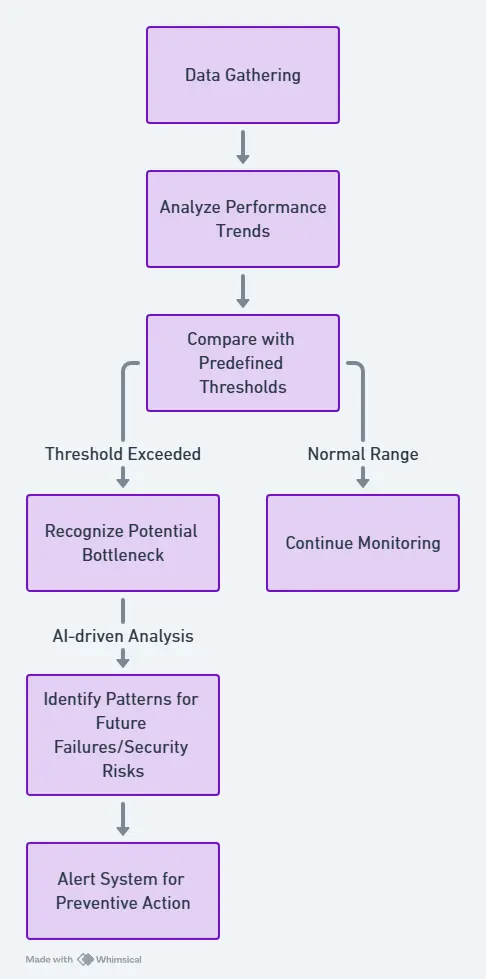
Infrastructure monitoring tools continuously collect data from servers, applications, networks, storage, and cloud environments. Metrics like CPU utilization, memory usage, network traffic, and response times provide insights into overall system health. - Metric Analysis & Pattern Recognition
Once data is gathered, the system analyzes performance trends and compares them against predefined thresholds. For example, if CPU usage spikes to 95% for an extended period, the monitoring tool will recognize this as a potential bottleneck. Advanced solutions use AI-driven analytics to identify patterns that might indicate future failures or security risks.
- Automated Alerts & Notifications
When an issue is detected, real-time alerts are sent to IT teams through email, Slack, SMS, or integrated dashboards. These alerts prioritize critical issues—such as server crashes or application failures—so teams can respond quickly. Configurable alert thresholds help reduce “alert fatigue” by filtering out minor fluctuations that don’t require immediate action. - Visualization & Dashboards
Instead of manually sifting through logs, modern monitoring platforms offer intuitive dashboards that provide a live view of system health. These dashboards highlight key performance indicators (KPIs), system trends, and potential issues—helping IT teams make data-driven decisions rather than reacting blindly to incidents.
Reactive vs. Proactive monitoring
Traditionally, IT teams relied on reactive monitoring, meaning they would fix problems only after they caused system failures. However, modern proactive monitoring aims to detect and resolve issues before they impact users.
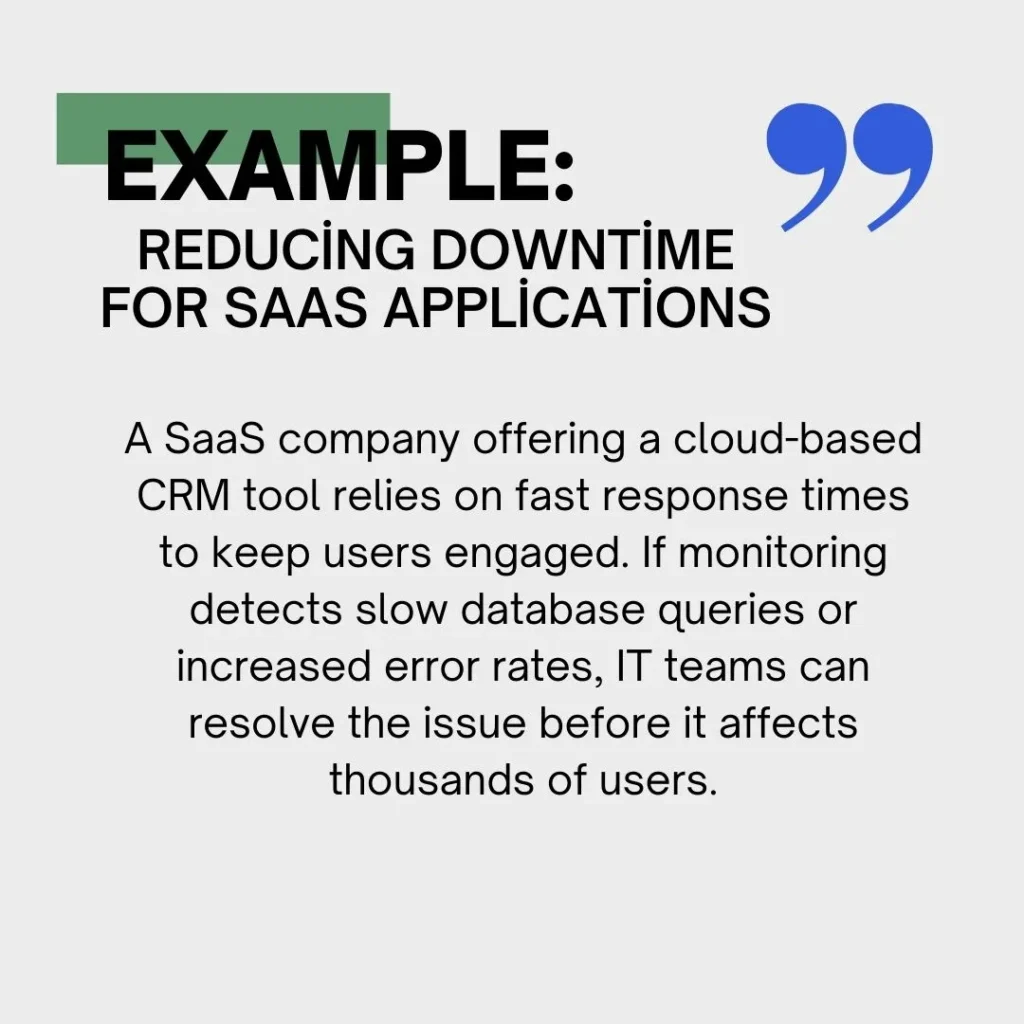
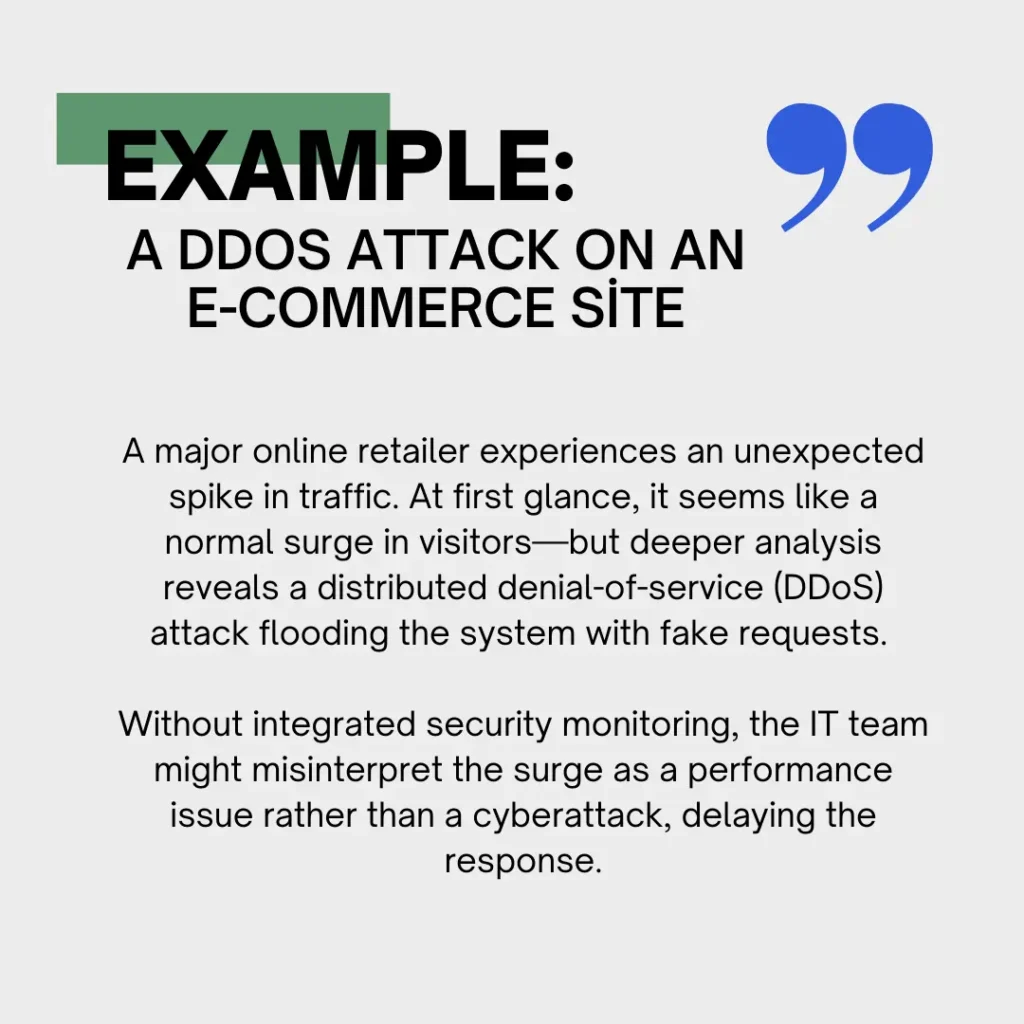
Example: The Cost of Reactive Monitoring
Imagine an e-commerce website that experiences an unexpected surge in traffic during a holiday sale. If the infrastructure isn’t monitored properly, server overload could lead to site crashes and lost sales. With reactive monitoring, the team would only notice after customers start complaining—resulting in revenue loss and damage to the brand’s reputation.
With proactive monitoring, the system detects the traffic spike in real time and automatically scales up resources to handle the load. By predicting and preventing failures, proactive monitoring keeps services running smoothly, enhances user experience, and reduces downtime costs.
Why infrastructure monitoring matters
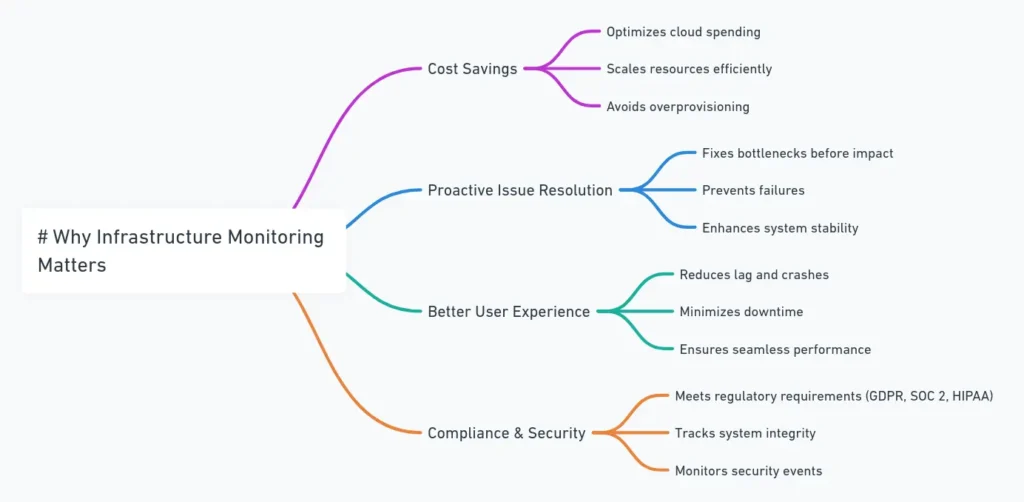
Beyond just keeping servers online, infrastructure monitoring drives business success by improving performance, security, and cost-efficiency. Here’s why it’s essential:
- Cost Savings: Helps optimize cloud spending by scaling resources efficiently instead of overprovisioning.
- Proactive Issue Resolution: Fixes performance bottlenecks and failures before they impact users.
- Better User Experience: Ensures websites and applications run without lag, crashes, or downtime.
- Compliance & Security: Meets regulatory requirements (e.g., GDPR, SOC 2, HIPAA) by tracking system integrity and security events.
Looking ahead
Infrastructure monitoring is about both fixing problems and preventing them from happening in the first place. With AI, automation, and predictive analytics, IT teams can identify risks before they escalate, optimize performance, and improve business continuity.
The role of infrastructure monitoring in modern IT
IT systems today are more dynamic and complex than ever. Businesses rely on a mix of on-premise servers, cloud environments, microservices, and third-party integrations to keep their operations running smoothly. But as infrastructure grows, so do the risks—server failures, network slowdowns, security vulnerabilities, and unexpected resource bottlenecks can all lead to costly downtime.
This is where infrastructure monitoring plays a critical role. It supports performance, uptime, and resource optimization by providing IT teams with real-time visibility into system health, allowing them to detect and resolve issues before they impact business operations.
Keeping systems running: Performance, uptime & optimization
By implementing real-time tracking, automated alerts, and AI-driven insights, companies can prevent failures before they happen. Below are the key aspects of infrastructure monitoring that keep IT environments running smoothly.
Performance Monitoring: Preventing slowdowns before they happen
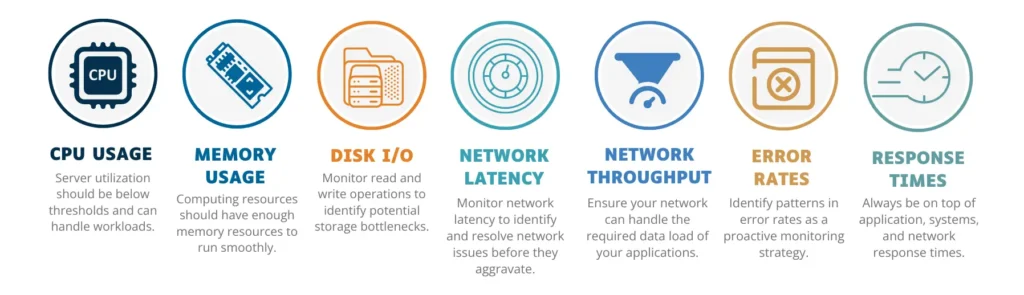
Infrastructure monitoring continuously tracks CPU usage, memory consumption, disk I/O, and network activity to detect performance bottlenecks. When a critical resource—such as a cloud database or web server—approaches capacity limits, the system can trigger alerts or automatically allocate additional resources to maintain performance.
For example, in a high-traffic e-commerce platform, infrastructure monitoring can detect a sudden surge in visitors and dynamically scale resources to prevent website slowdowns or crashes. Without monitoring, an unplanned spike in traffic could overload servers, leading to lost sales and frustrated customers.
Uptime Monitoring: Reducing downtime & preventing outages
Downtime is one of the biggest threats to any business. A single hour of downtime can cost companies anywhere from $100,000 to over $1 million, depending on the industry. Infrastructure monitoring minimizes downtime by detecting failures early, allowing IT teams to fix problems before they lead to service interruptions.
Resource optimization: Avoiding overprovisioning & cutting costs
One of the biggest financial challenges in IT is balancing resource availability with cost efficiency. Businesses often overprovision resources to prevent outages, but this leads to wasted cloud spending. Infrastructure monitoring solves this issue by providing real-time insights into resource utilization, allowing IT teams to scale up or down based on actual demand.
For example, a SaaS company running applications on AWS or Google Cloud could use infrastructure monitoring to track cloud usage. If servers are consistently underutilized, the company can downsize instances or adjust configurations, reducing cloud costs without impacting performance.
Proactive issue detection: Stopping problems before they impact users
Modern proactive monitoring detects issues before they escalate, allowing businesses to address risks without disrupting operations.
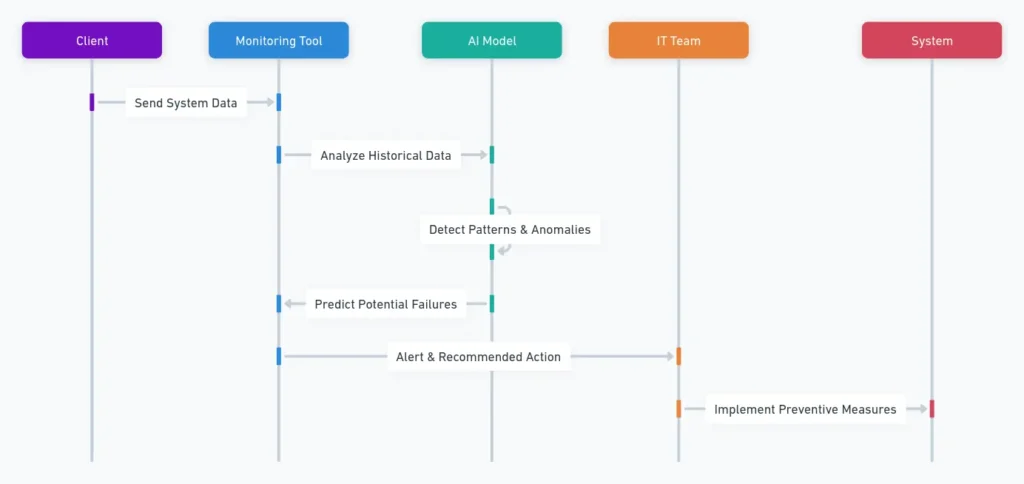
Some organizations are taking it a step further with AI-driven predictive analytics. For example, Dynatrace and Datadog use machine learning algorithms to analyze historical data and detect patterns that indicate an impending failure. This allows IT teams to prevent system failures before they even happen, significantly improving system reliability.
How infrastructure monitoring supports business goals
Infrastructure monitoring directly impacts business success by improving stability, efficiency, and customer satisfaction.
💰 Cost Savings: Prevents wasteful spending on unnecessary resources while avoiding costly downtime.
🚀 Better User Experience: Keeps applications and websites running smoothly for customers.
🔒 Improved Security & Compliance: Helps meet industry regulations by tracking system health and anomalies.
For businesses operating in e-commerce, finance, healthcare, and SaaS, infrastructure monitoring isn’t optional—it’s a competitive advantage. Companies that invest in proactive monitoring reduce downtime, cut costs, and provide a superior digital experience to their users.
| Feature | Reactive Monitoring | Proactive Monitoring |
| Approach | Fixes issues after they occur | Detects and prevents issues before they escalate |
| Issue Detection | Relies on manual troubleshooting after an outage or performance drop | Uses real-time monitoring, AI, and predictive analytics to identify risks early |
| Response Time | Delayed—teams react once an issue has been reported | Instant—automated alerts notify IT teams before users are affected |
| Impact on Downtime | High – Failures and outages can last minutes or hours before resolution | Low – Problems are resolved before they lead to downtime |
| Data Usage | Uses historical logs to investigate past failures | Uses real-time and predictive data to prevent future incidents |
| Efficiency | Inefficient – IT teams spend time reacting to problems rather than improving systems | Highly efficient – IT teams focus on optimization and strategic improvements |
| Automation | Minimal – Requires manual intervention to diagnose and fix issues | High – Uses AI and machine learning to automate issue detection and resolution |
| End-User Experience | Users experience disruptions, slow performance, or outages before IT reacts | Users experience minimal disruptions as issues are resolved before they notice |
| Example Scenario | A website crashes during peak traffic hours, and IT teams rush to troubleshoot the cause | Monitoring detects increasing CPU load and automatically scales resources to prevent a crash |
Key components of infrastructure monitoring
A strong infrastructure monitoring strategy goes beyond just tracking whether a system is up or down—it provides a deep, real-time view of system health, performance trends, and security threats. Without the right monitoring components in place, businesses risk performance slowdowns, network bottlenecks, and security breaches that could disrupt operations and impact user experience.
To fully optimize IT infrastructure, monitoring must cover multiple layers—from physical hardware to cloud services, applications, and network performance.
Below are the five essential components of a strong infrastructure monitoring system.
1. Server monitoring: Keeping the core systems healthy
Servers are the foundation of IT infrastructure, hosting applications, databases, and critical business processes. Monitoring servers ensures that hardware and virtual machines operate efficiently, without hitting performance bottlenecks.
Key Metrics Tracked in Server Monitoring:
- CPU Utilization: Measures how much processing power is in use. High CPU usage for prolonged periods can indicate performance issues.
- Memory Usage: Tracks available and consumed memory to prevent crashes due to memory leaks or excessive load.
- Disk I/O Performance: Monitors read/write speeds and disk capacity to detect storage failures or bottlenecks.
2. Network monitoring: Fast & reliable connections
A slow or unstable network can cripple an otherwise well-functioning IT system. Network monitoring provides real-time insights into bandwidth usage, latency, and packet loss, helping teams optimize data flow and prevent outages.
Key Network Metrics:
- Latency: Measures delay in network requests—critical for streaming services and cloud applications.
- Bandwidth Utilization: Tracks network traffic to identify congestion points.
- Packet Loss: Detects issues in data transmission that could cause delays or failed transactions.
🔍 Example: Maintaining Real-Time Streaming Quality
For video streaming platforms like Netflix or YouTube, low latency and minimal packet loss are essential. A minor network issue can cause buffering, lag, or quality drops. Network monitoring tools help identify congestion early, allowing teams to optimize traffic routing before users notice interruptions.
3. Application monitoring: Keeping software performance smooth
Infrastructure monitoring isn’t just about hardware and networks—applications also need continuous performance tracking. Application monitoring focuses on software behavior, response times, error rates, and user interactions to ensure smooth functionality.
Key Application Monitoring Metrics:
- Response Time: Measures how quickly an app processes user requests.
- Error Rate: Tracks failed transactions or crashes affecting user experience.
- Database Performance: Ensures queries run efficiently without long delays.
4. Cloud Monitoring: Managing Multi-Cloud & Hybrid Environments
With more companies moving to AWS, Azure, and Google Cloud, infrastructure monitoring has expanded to include cloud resource tracking. Unlike traditional on-premise servers, cloud environments scale dynamically, making real-time monitoring essential.
Key Cloud Monitoring Features:
- Instance Performance Tracking: Monitors cloud server health, CPU/memory use, and storage capacity.
- Cost Optimization: Prevents cloud overspending by analyzing resource usage.
- Service Availability: Ensures cloud-based applications stay online across different regions.
🔍 Example: Preventing Cloud Overspending
A company using AWS Auto Scaling may notice unused instances consuming resources. Cloud monitoring tools detect this and automatically scale down resources, reducing costs without sacrificing performance. Many cloud professionals also explore AWS courses to strengthen their understanding of resource management and monitoring concepts, which are crucial in dynamic cloud environments.
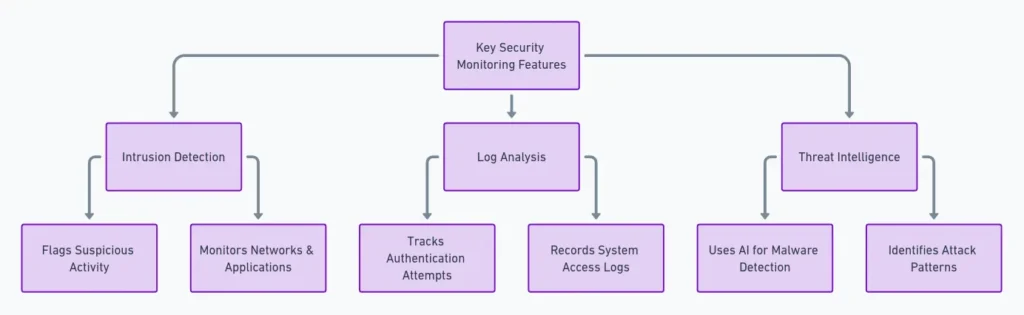
5. Security monitoring: Detecting anomalies & preventing threats
With cyberattacks increasing by 75% since last year, security monitoring is a critical layer of infrastructure monitoring. It identifies unauthorized access, detects anomalies, and prevents security breaches before they compromise sensitive data.
Key security monitoring features:
- Intrusion Detection: Flags suspicious activity in networks and applications.
- Log Analysis: Tracks authentication attempts and system access.
- Threat Intelligence: Uses AI to detect malware or attack patterns.
A strong infrastructure monitoring strategy requires more than just uptime checks—it involves tracking performance, network health, application behavior, cloud resources, and security threats in real time. Without these core monitoring components, IT teams risk unexpected failures, security breaches, and excessive costs.
Core metrics to monitor
Infrastructure monitoring tools track a wide range of performance indicators, but not all metrics are equally important. Monitoring the right metrics ensures IT teams stay ahead of potential failures, optimize resource usage, and maintain system stability.
The key to effective infrastructure monitoring is balancing real-time tracking with predictive analytics—monitoring both immediate performance issues and long-term trends that could indicate future failures.
Real-time monitoring
Real-time monitoring provides instant visibility into system performance, allowing IT teams to react to sudden spikes in usage, hardware failures, or network slowdowns before they impact users.
Key Metrics Tracked in Real-Time Monitoring:
- CPU Utilization: Measures how much processing power is in use. If a system runs at 90%+ CPU usage for extended periods, it could indicate a performance bottleneck or inefficient workload distribution.
- Memory Usage: Tracks available vs. used memory to prevent crashes caused by memory leaks or excessive demand.
- Disk I/O Performance: Measures read/write speeds to detect storage slowdowns that could impact application performance.
- Network Latency & Bandwidth Usage: Helps identify slow connections, congestion, or unusual traffic spikes that could indicate security threats.
For example, imagine an online collaboration tool like Slack or Microsoft Teams experiencing an unexpected surge in usage. Without real-time monitoring, a sudden CPU overload on cloud servers could cause lagging message deliveries or full application crashes.
But with real-time alerts, IT teams would be notified the moment CPU utilization exceeds safe limits, allowing them to allocate additional cloud resources automatically before users notice performance issues.
Predictive analytics
Instead of reacting to an outage after it happens, predictive monitoring identifies warning signs—such as gradual increases in response time, recurring network slowdowns, or CPU overuse trends—and provides proactive recommendations to prevent failures.
How AI/ML enhances infrastructure monitoring:
🔹 Anomaly Detection: Identifies unusual behavior, such as sudden traffic spikes or unexplained memory consumption.
🔹 Failure Prediction: Uses historical performance data to forecast when a server, disk, or application may fail.
🔹 Automated Remediation: Some advanced monitoring tools automatically take action to resolve issues before they escalate.
Popular infrastructure monitoring tools
Choosing the right monitoring tool depends on your business size, infrastructure complexity, and budget. Here’s how some of the top tools compare:
| Tool | Best For | Key Features | Pricing |
| UptimeRobot | Website & server monitoring | Uptime alerts, response time tracking | Free & paid plans |
| Datadog | Enterprise cloud monitoring | AI-powered analytics, multi-cloud support | Paid |
| New Relic | Full-stack observability | APM, logs, and metrics in one | Free & paid plans |
| Dynatrace | Large-scale automation | AI-driven root cause analysis | Paid |
| Nagios | Open-source monitoring | Customizable plugins, server tracking | Free & paid |
Emerging trends in infrastructure monitoring
Businesses now operate across multi-cloud architectures, hybrid infrastructures, and edge computing environments, making system monitoring more complex than ever. To keep up, AI-driven automation, IoT-based tracking, and predictive analytics are becoming essential tools for modern infrastructure monitoring.
Here’s how AI, machine learning, and IoT are shaping the future of monitoring, along with the key challenges of multi-cloud and hybrid cloud environments—and how companies are overcoming them.
The role of AI and machine learning in infrastructure monitoring
Artificial intelligence (AI) and machine learning (ML) are revolutionizing IT monitoring by automating complex tasks, detecting anomalies, and predicting failures before they happen. Unlike traditional monitoring, which relies on static thresholds (e.g., sending an alert when CPU usage exceeds 90%), AI-powered systems learn from historical data and identify patterns that humans might miss.
Key benefits of AI-driven monitoring:
🔹 Anomaly Detection: AI continuously monitors performance data and flags unusual activity—such as unexpected traffic spikes, memory leaks, or latency issues.
🔹 Predictive Maintenance: Instead of waiting for failures to occur, AI analyzes past system behavior to predict when components are likely to fail—allowing teams to fix issues before they cause downtime.
🔹 Automated Remediation: Some AI-powered monitoring tools don’t just detect issues—they automatically adjust resources or reroute traffic to maintain optimal performance.
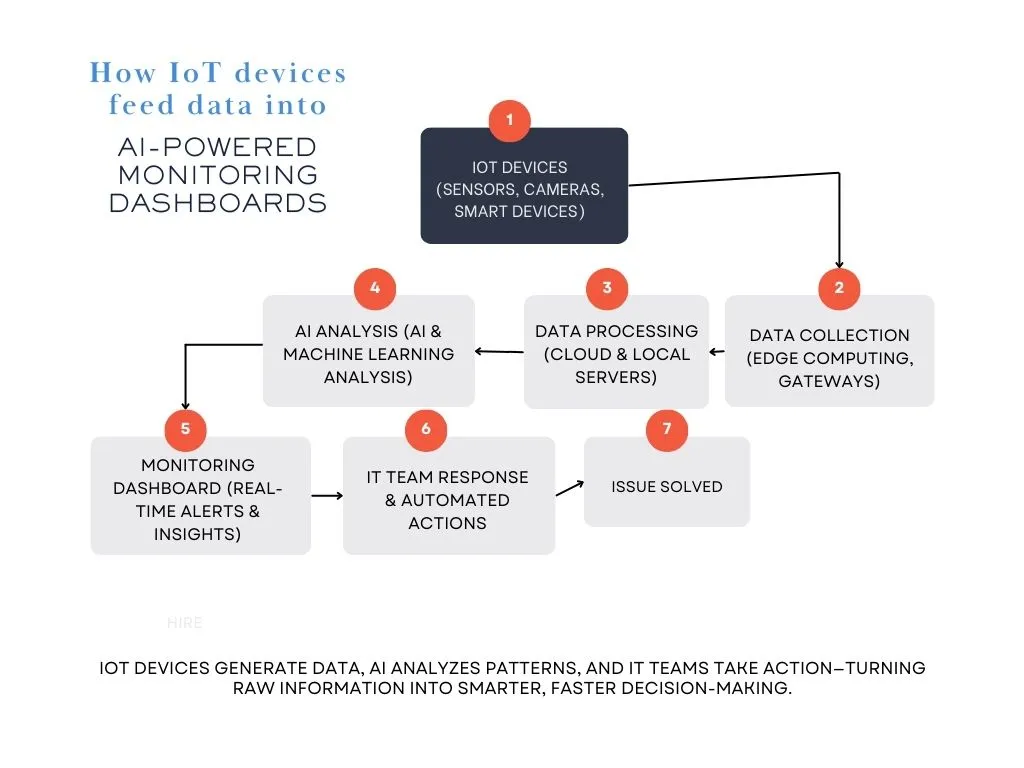
How IoT is expanding infrastructure monitoring
The rise of Internet of Things (IoT) devices has introduced an entirely new layer of infrastructure to monitor. Unlike traditional IT environments that focus on servers and cloud resources, IoT-based monitoring extends to connected devices, sensors, and edge computing.
Challenges of IoT infrastructure monitoring
- Massive Data Volume: With billions of IoT devices generating data, traditional monitoring tools struggle to process real-time analytics at scale.
- Security Risks: IoT devices lack built-in security compared to enterprise IT systems, making them prime targets for cyberattacks.
- Edge Computing Complexity: Many IoT systems process data at the edge (closer to the source) instead of in centralized data centers—requiring new monitoring approaches.
For example, let’s say a smart factory uses thousands of IoT-connected sensors to track machine performance, temperature, and energy consumption. If a sensor detects abnormal vibrations in a production line machine, predictive monitoring can alert engineers to perform maintenance before the machine breaks down—preventing costly delays and downtime.
The Rise of multi-cloud & hybrid cloud monitoring
As companies move beyond single-cloud environments, multi-cloud (using multiple cloud providers) and hybrid cloud (combining cloud and on-prem infrastructure) architectures have become the norm.
However, these environments come with unique challenges that traditional monitoring tools struggle to address.
Challenges of multi-cloud & hybrid cloud monitoring:
🚀 Lack of Unified Visibility: Monitoring AWS, Azure, Google Cloud, and on-prem systems separately creates gaps in visibility.
🚀 Data Synchronization Issues: Hybrid cloud setups require constant data syncing between on-prem and cloud resources—delays or inconsistencies can cause failures.
🚀 Compliance & Security Risks: Different clouds have different security policies—monitoring tools must track compliance across all platforms.
Solutions: How modern monitoring tools solve these issues
✅ Unified Dashboards: New monitoring platforms provide one centralized interface for tracking all cloud and on-prem resources in real time.
✅ AI-Powered Analytics: Advanced tools correlate data from multiple clouds, detecting performance trends and optimizing resource allocation automatically.
✅ Policy-Based Security Monitoring: Compliance-focused monitoring checks that security policies remain consistent across cloud providers, preventing misconfigurations and security gaps.
Looking ahead: What’s next for infrastructure monitoring?
With AI, IoT, and hybrid cloud monitoring becoming more advanced, the future of infrastructure monitoring will focus on:
🔹 Self-Healing IT Systems: AI-powered monitoring will not only predict failures but automatically fix them without human intervention.
🔹 Deeper Security Integration: AI-based security monitoring will automatically detect and prevent cyberattacks in real time.
🔹 Automated Multi-Cloud Optimization: Cloud monitoring tools will become smarter, dynamically allocating resources across providers to reduce costs and improve performance.
As IT infrastructure grows more distributed and complex, businesses will need AI-driven, automated monitoring to keep systems running efficiently without increasing operational overhead.
Integrating security into monitoring
Modern IT infrastructure is more interconnected than ever, making security and performance monitoring inseparable. While traditional monitoring tools focus on uptime, resource allocation, and system performance, they often overlook security threats that can compromise entire networks.
By combining security monitoring with infrastructure monitoring, businesses can detect and mitigate threats before they cause system failures, data breaches, or service disruptions.
Why security & performance monitoring go hand in hand
In the past, IT teams treated infrastructure monitoring and security monitoring as separate functions. Performance-focused monitoring ensured that systems ran smoothly and efficiently, while security teams handled firewall logs, authentication tracking, and threat analysis.
Today, this separation no longer works—cyber threats don’t just target data. They also impact performance, uptime, and system stability.
By monitoring both performance anomalies and security events in one system, IT teams can identify the real source of a problem faster and respond accordingly.
How security threats affect system performance
🔹 Malware Infections: Hidden malware running on a server can consume CPU, memory, and bandwidth, degrading application performance.
🔹 Unauthorized Access: Repeated login attempts or unusual access requests can trigger server slowdowns and indicate a potential security breach.
🔹 Data Exfiltration Attacks: If an attacker is stealing data in real time, it can cause unexpected bandwidth usage spikes, impacting legitimate traffic.
Using SIEM tools to strengthen infrastructure monitoring
One of the most effective ways to combine security and performance monitoring is by integrating Security Information and Event Management (SIEM) tools into existing infrastructure monitoring platforms.
What are SIEM tools?
SIEM (Security Information and Event Management) platforms collect, analyze, and correlate security data from multiple sources—including firewalls, intrusion detection systems (IDS), network logs, and cloud services—to detect and respond to threats in real time.
When SIEM is integrated with infrastructure monitoring, IT teams gain a full picture of both performance-related issues and security risks in a single dashboard.
Best practices for implementing infrastructure monitoring
Setting up infrastructure monitoring isn’t just about installing tools and collecting data—it requires a well-planned strategy for efficiency, scalability, and long-term reliability. Without a structured approach, IT teams may drown in data without extracting meaningful insights, leading to missed issues, false alerts, or wasted resources.
A well-designed infrastructure monitoring strategy should match business goals, integrate easily into existing systems, and evolve over time. Here are some of the key best practices to follow for effective implementation.
1. Define goals and key performance indicators (KPIs)
Before deploying a monitoring solution, organizations must define clear objectives. What are the critical components that need to be monitored? What constitutes normal vs. abnormal system behavior? Without predefined goals, monitoring can generate excessive noise, leading to alert fatigue and inefficient responses.
Key KPIs to Track:
📊 Uptime & Availability – Ensure servers and applications meet 99.9%+ availability benchmarks.
📊 Response Time & Latency – Measure how quickly applications process user requests.
📊 Resource Utilization – Track CPU, memory, storage, and bandwidth usage to optimize costs.
📊 Error Rates & Failures – Detect increasing error rates or repeated service crashes before they escalate.
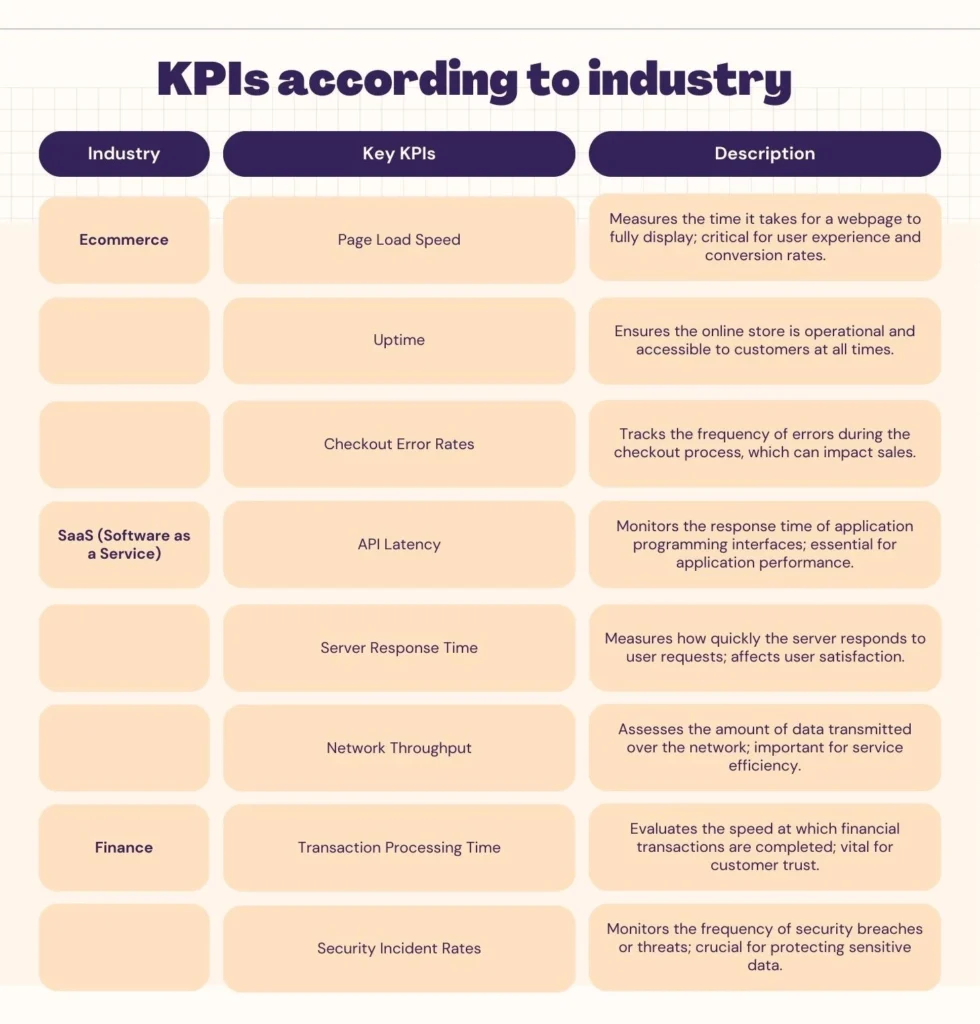
KPIs should always align with business goals. For example, an e-commerce business may prioritize page load speed, uptime, and checkout error rates, while a cloud service provider might focus on API latency, server response time, and network throughput. Choosing relevant KPIs ensures monitoring aligns with business objectives rather than just collecting data for the sake of it.
2. Make sure you can scale and integrate with existing systems
As businesses grow, their IT infrastructure expands across cloud providers, data centers, and third-party applications. If a monitoring solution doesn’t scale properly, it can create blind spots in visibility, making it harder to troubleshoot system failures across complex environments.
Best practices for scalability & integration:
🔹 Use a Centralized Monitoring Platform – Avoid siloed monitoring tools and instead choose a platform that provides full-stack observability across cloud, on-prem, and hybrid environments.
🔹 Leverage Automation & AI – As infrastructure scales, manual monitoring becomes impractical. AI-driven monitoring can automate anomaly detection and issue resolution.
🔹 Integrate with DevOps & ITSM Tools – Connect monitoring with tools like Slack, Jira, PagerDuty, and ServiceNow for faster incident response and automated workflows.
3. Regularly review and update monitoring strategies
Infrastructure monitoring is not a “set-it-and-forget-it” process. As IT environments evolve, monitoring strategies must be updated to reflect new technologies, workloads, and business needs.
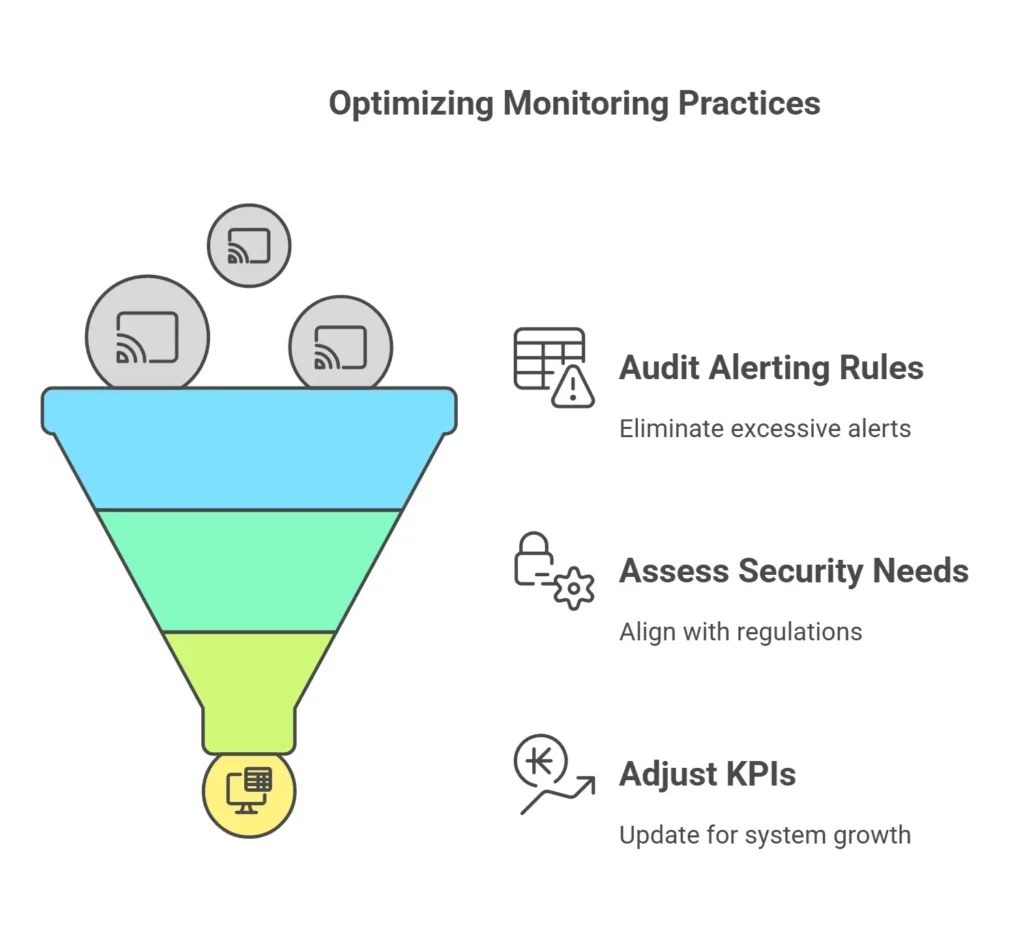
Key review & optimization steps:
🔹 Audit & Refine Alerting Rules – Avoid excessive or redundant alerts that overwhelm IT teams.
🔹 Assess New Security & Compliance Needs – Update monitoring practices to align with evolving security regulations (GDPR, SOC 2, HIPAA).
🔹 Adjust KPIs Based on System Growth – What was relevant six months ago may no longer be applicable—regular reviews prevent outdated monitoring configurations.
Common pitfalls to avoid
Even with the best tools, poor implementation can lead to data overload, inefficiencies, and missed incidents. Here are critical mistakes to watch out for:
🚨 1. Overlooking integration with existing systems
A common mistake is implementing a standalone monitoring tool that doesn’t integrate with existing IT systems, DevOps workflows, or security platforms. This results in disconnected data, forcing teams to manually piece together information from multiple dashboards—which slows down incident response.
✅ Solution: Choose monitoring solutions with APIs that integrate with ticketing systems, automation tools, and cloud providers.
🚨 2. Ignoring end-user experience in favor of raw metrics
Many IT teams focus on server uptime, CPU usage, and network speed—but fail to monitor how these affect the end-user experience. A website that is technically “up” but loads slowly for users still results in lost revenue and poor customer satisfaction.
✅ Solution: Implement user experience monitoring (UXM) alongside infrastructure monitoring to track real-world application performance.
How infrastructure monitoring fails when it stops at metrics
Infrastructure monitoring often starts strong and then quietly loses value. CPU, memory, disk, and network charts look fine, but incidents still surprise teams. The gap is not missing data. It is missing interpretation.
Raw metrics are symptoms, not answers. High CPU does not explain whether traffic spiked, a deploy leaked memory, or a background job ran wild. Infrastructure monitoring becomes useful only when metrics connect to behavior. Without that link, teams react late or chase the wrong cause.
One common failure is treating servers as static. Modern infrastructure is dynamic. Instances scale up and down, containers restart, and roles change constantly. Monitoring that relies on manual host lists or fixed thresholds drifts out of date fast. Gaps appear without anyone noticing.
Another issue is isolated signals. Infrastructure metrics in one dashboard, deploys in another, incidents somewhere else. When something breaks, responders waste time stitching context together. Monitoring should show what changed near the time performance degraded, not just that it degraded.
Alerting is where trust is won or lost. Threshold-based alerts fire during normal load shifts and stay silent during slow failures. This trains teams to ignore alerts. Infrastructure monitoring needs alerts based on sustained behavior, rate of change, and correlated metrics, not single spikes.
Infrastructure health also does not equal service health. A fleet can look stable while users experience errors due to config issues, dependency failures, or network routing problems. External checks and application-level signals keep infrastructure data grounded in real impact.
Ownership clarity matters too. When an alert fires, someone should immediately know whether it is theirs to act on. Vague infrastructure alerts with no service or owner attached slow response and increase handoffs during incidents.
Finally, infrastructure monitoring should support learning. Trends over weeks and months reveal capacity limits, cost waste, and risk buildup. If data is only used during outages, half its value is lost.
Good infrastructure monitoring does not aim to collect everything. It aims to answer two questions quickly: what changed, and does it explain what users are feeling?
When monitoring does that reliably, infrastructure stops being a black box and starts being a signal.
Conclusion
As systems become more complex, with multi-cloud environments, microservices, and IoT devices, real-time visibility and proactive monitoring are critical to maintaining performance, security, and uptime.
Without a strong monitoring strategy, businesses risk downtime, security breaches, and inefficient resource usage, all of which can lead to financial losses and poor user experiences.
To stay ahead, IT teams must adopt best practices—tracking key metrics, integrating AI-driven analytics, automating alerts, and ensuring scalability. The future of infrastructure monitoring is about continuous innovation—leveraging AI, automation, and predictive analytics to build self-healing, intelligent IT systems. By embracing proactive monitoring, organizations can reduce risk, improve system reliability, and create a more resilient IT infrastructure for the years ahead.
FAQ's
-
Infrastructure monitoring tracks the health and performance of core components like servers, networks, storage, and virtual machines. It focuses on resource usage and availability across your stack. The goal is to detect issues before they impact applications or users.
-
Key metrics include CPU, memory, disk I/O, disk space, network latency, and packet loss. Depending on your setup, you may also monitor load averages, interface errors, or node availability. Prioritize signals that indicate saturation or failure.
-
Infrastructure monitoring shows whether the underlying systems are healthy. Application monitoring shows how code behaves and how users are affected. You need both—healthy infrastructure doesn’t guarantee a healthy app, and vice versa.
-
Many failures start as gradual resource pressure rather than hard outages. Without thresholds and trends, slow leaks or spikes can be missed. Single-point checks also hide regional or partial failures.
-
Most teams collect metrics every 30-60 seconds for critical systems. Shorter intervals improve detection but increase overhead. Consistent intervals and retention matter more than extreme granularity.