Slow response time is often the first sign something is wrong, even when uptime looks perfect. Pages load, but users wait, conversions drop, and complaints start before any alert fires. Treating speed as a secondary metric makes these issues harder to catch.
This guide breaks response time monitoring down to what actually matters in production. It looks at where latency comes from, how it shows up across regions, and why averages hide the spikes users feel most. The focus is on interpreting data, not just collecting it.
You’ll learn how to measure response time correctly, spot early performance degradation, and tie slowdowns back to real causes. If speed impacts user experience or revenue, this is where to start fixing it.

Key points:
- What response time monitoring is and why it matters
- Methods for monitoring response time
- Common causes of slow response times
- Strategies to improve response times, including how UptimeRobot can help
Tip: Not sure how your site is performing? Take a look at our guide to the best website speed testing tools.
What is response time monitoring?
Response time monitoring is the process of tracking how long it takes for your website or server to respond to a request.
Regularly monitoring your response time helps maintain a great user experience, boosts your site’s SEO performance, and allows you to catch and fix potential issues before they affect your business.
How to monitor response time
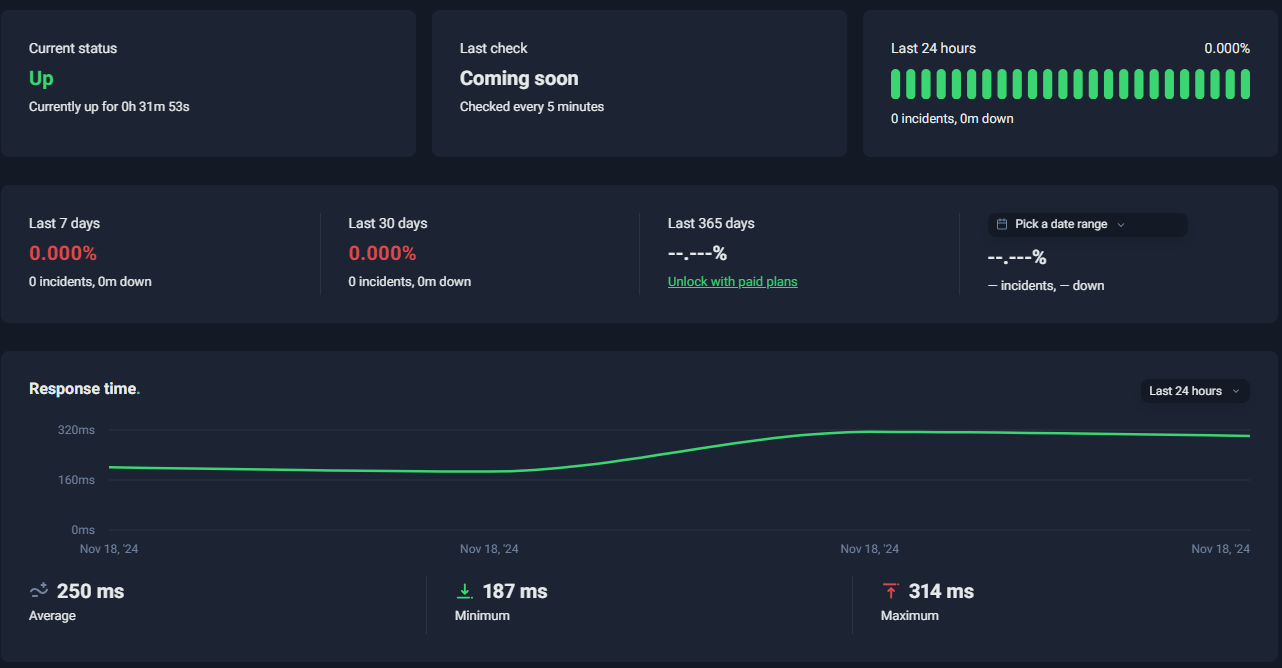
Monitoring response time involves using tools like UptimeRobot, which automatically tracks your site’s performance by sending regular requests and measuring how long it takes for your server to respond.
Monitoring tools typically log average, max, and min response times, allowing you to analyze performance trends and identify any issues.
Pro tip: If you’re automating scheduled checks or timed scripts as part of your performance workflow, you can generate valid cron schedules using our free Cron Expression Generator.
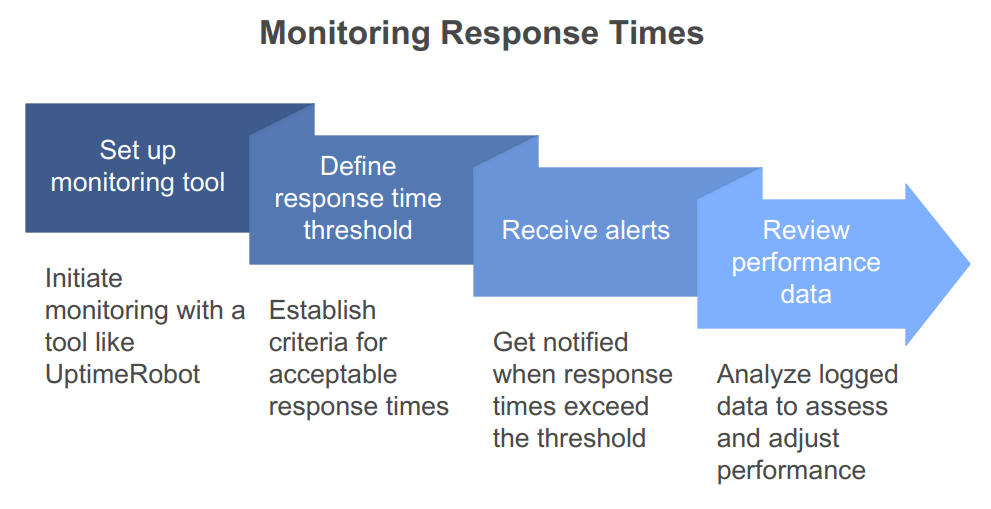
Steps to monitor response time:
- Set up a monitoring tool (such as UptimeRobot).
- Define your threshold for acceptable response times.
- Receive alerts when response times exceed the threshold.
- Use logged data to review performance and adjust accordingly.
How to read response time metrics without chasing the wrong problem
Response time numbers are easy to collect and easy to misinterpret. A single slow data point does not always mean a real issue. The goal is to spot patterns that affect users, not to react to every spike.
Start by separating averages from extremes. Average response time smooths data, which hides short but painful slowdowns. Percentiles tell a clearer story. The ninety-fifth or ninety-ninth percentile shows how slow things get for real users during peak or degraded conditions.
Context matters as much as the number. A two-second response might be fine for a background report but unacceptable for a login page. Response time thresholds should reflect what users expect from that specific action, not a global standard.
Watch trends, not snapshots. Gradual increases over days or weeks often signal capacity limits, inefficient queries, or creeping dependency latency. These slowdowns rarely trigger uptime alerts, but they are early warnings of future outages.
Correlate response time with changes. Deploys, config updates, traffic shifts, and dependency incidents often explain sudden jumps. If response time spikes line up with a release, you have a faster path to rollback or mitigation.
Geography can distort the picture. A service may be fast from one region and slow from another due to routing, CDN behavior, or regional infrastructure issues. Multi-location checks help confirm whether slowness is global or isolated.
Do not ignore “fast failures.” A sudden drop in response time paired with errors can mean requests are failing early. That looks good on latency charts but feels broken to users. Always read latency alongside status codes.
Alerting should focus on sustained degradation, not momentary noise. Require response times to exceed thresholds for a defined window before alerting. This avoids paging on brief blips while still catching real performance issues.
Finally, tie response time back to experience. Ask what users can do when latency increases. Can they still log in, check out, or load content? When response time monitoring answers that question, it becomes actionable instead of cosmetic.
Response time metrics are most useful when they help you act before users complain, not after.
Common causes of slow response times & how to manage them
Understanding why your website might be slow is the first step to fixing the issue. These are some common causes of slow response times:
Server overload
When your server receives more requests than it can handle, response times increase as it struggles to keep up. This is especially true for shared hosting plans where multiple users share resources.
Consider upgrading to a more robust hosting plan or using a dedicated server. For some advice on choosing the best hosting provider, check out our guide on hosting providers.
Poor server infrastructure
Outdated or underpowered servers can drastically hinder performance, especially during peak traffic.
Upgrading to modern, scalable server solutions can significantly improve response times. If you’re using a provider, ensure their services meet high-performance standards.
Network issues
Latency often results from inefficient routing, slow DNS resolution, or connectivity problems. Using a reliable Content Delivery Network (CDN) helps reduce latency by caching content closer to users, which speeds up delivery.
Unoptimized code or database queries
Inefficient code and slow database queries can also greatly impact response times. Regularly review and refactor your code and optimize your database by using proper indexing and efficient query structures.
Large or uncompressed media files
High-resolution images and videos that aren’t optimized put more stress on load times. Compress images and use modern formats like WebP to maintain visual quality while minimizing file size.
Too many HTTP requests
Each element on your webpage, such as images, scripts, and stylesheets, requires an HTTP request.
Having too many of these can slow down page loads. Combine files where possible and use techniques like image sprites to reduce HTTP requests.
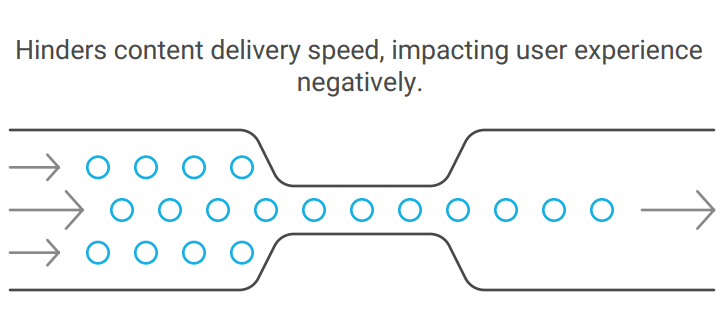
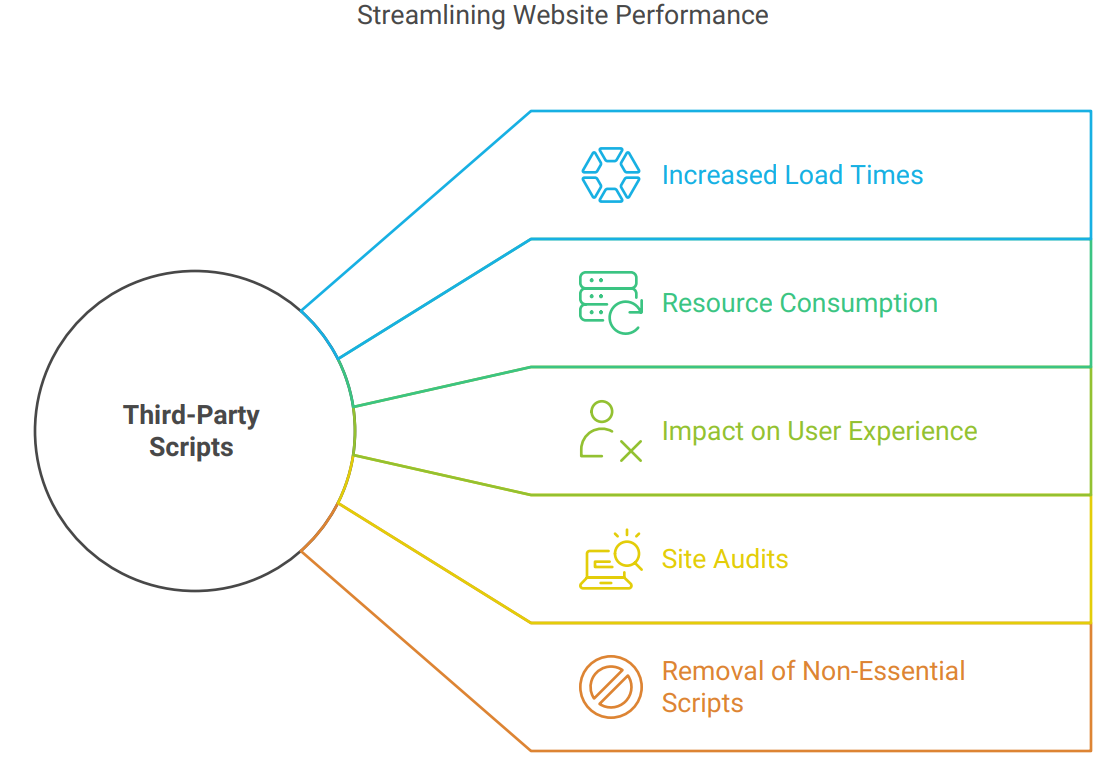
Heavy third-party scripts
Third-party tools, plugins, ads, and analytics scripts can add extra load time. Audit your site regularly and remove non-essential third-party scripts that don’t contribute to your site’s primary goals.
Inefficient caching strategies
Without effective caching, visitors may have to load all elements of a page each time they visit. Implementing browser and server-side caching can reduce load times for returning visitors.
Content Management System (CMS) optimization
If you’re using platforms like WordPress, poorly configured themes or plugins can slow down your site.
You can keep your CMS optimized by using lightweight themes, minimizing plugins, and keeping everything updated.
Outdated software and security measures
Using outdated software, such as old PHP versions, can contribute to slower response times. Keep your CMS, plugins, and server software up-to-date for optimal performance and security.
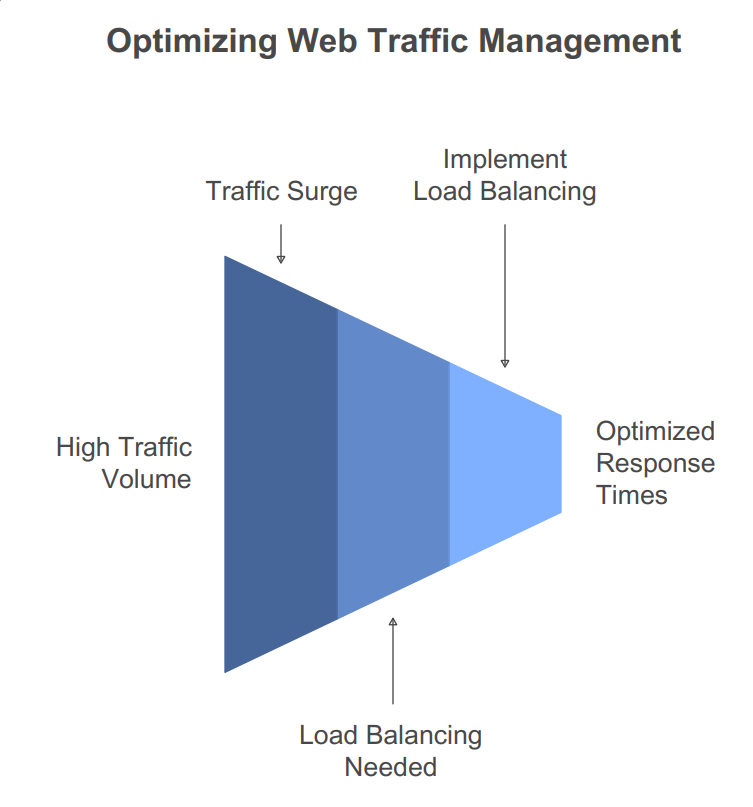
High traffic spikes without load balancing
Traffic surges without adequate load balancing can slow response times dramatically. Using load balancing distributes incoming traffic across multiple servers, ensuring your site can handle more visitors properly.
Strategies for effective response time monitoring
To make the most out of response time monitoring, these strategies will help the most.
Monitor regularly
Continuous, real-time monitoring is the best way to catch performance issues before they become bigger problems or lead to downtime.
Regular monitoring helps identify sudden spikes in response times or unexpected downtimes, letting your team respond quickly to problems.
Automated tools like UptimeRobot that provide 24/7 tracking can keep you aware of any issues the moment they occur.
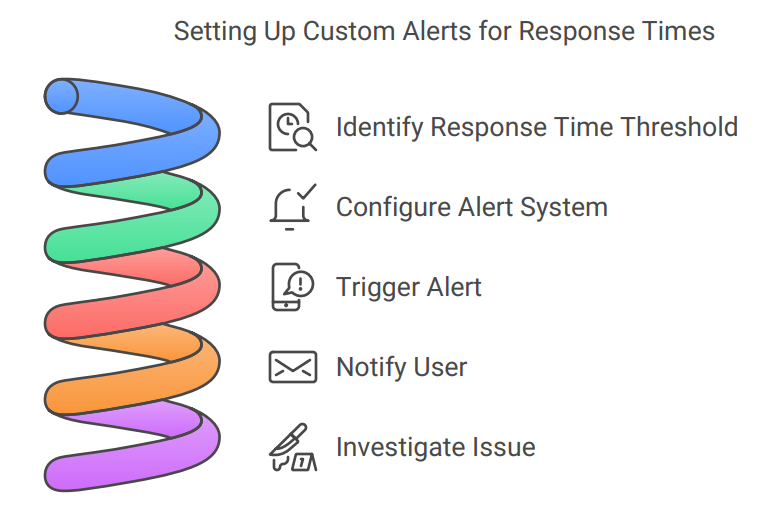
Use threshold alerts
Setting up custom alerts that notify you when response times exceed predetermined levels is another must-have in maintaining optimal performance.
For instance, you can configure alerts to trigger when response times exceed 200ms, prompting immediate investigation.
Different thresholds for various site pages or services can help you prioritize which issues need urgent attention.
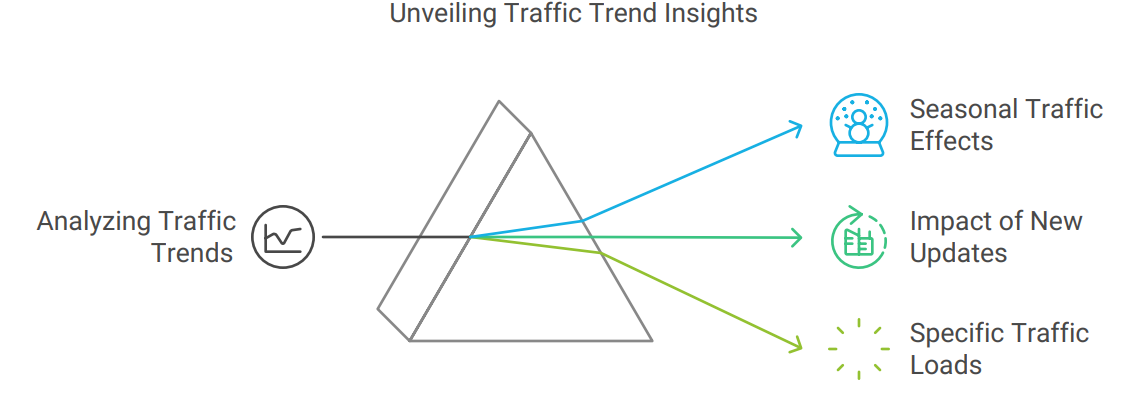
Track trends over time
Analyzing data over extended periods allows you to identify patterns and recurring performance issues.
By examining trends such as gradual slowdowns or periodic spikes, you can determine if problems are related to seasonal traffic, new updates, or specific traffic loads.
Tools that provide historical data reports make trend analysis more effective and help you take proactive measures.
Monitor from different locations
Monitoring response times from various regions keeps your site running well for users around the globe.
Disparities in response times can occur due to differences in server locations, CDN distribution, or regional internet infrastructure.
Multi-location monitoring helps pinpoint areas where performance improvements or additional server support may be necessary.
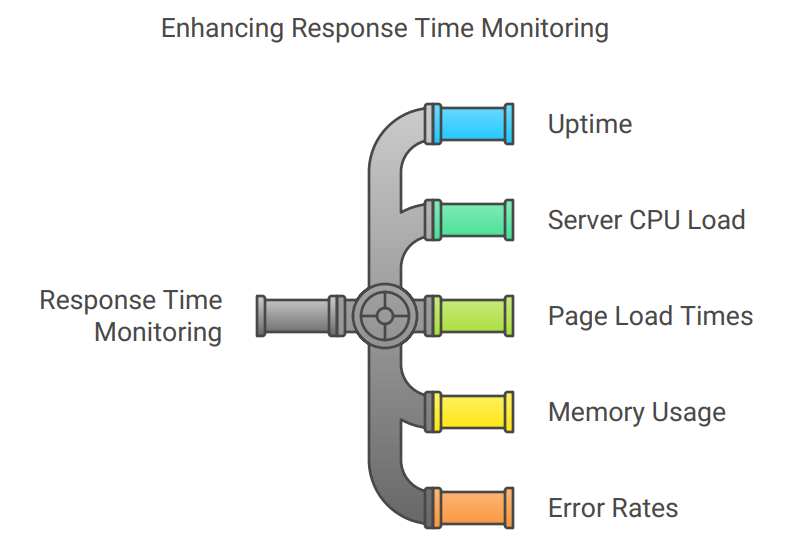
Combine metrics for a holistic view
Response time should not be monitored in isolation. Complement it with other performance indicators like uptime, server CPU load, page load times, memory usage, and error rates.
This combination helps paint a complete picture of your site’s health, which makes it easier to correlate data and quickly diagnose root causes of slow response times.
Utilize synthetic monitoring
Shortly put, synthetic monitoring simulates user interactions and tracks response times for different site elements and user journeys.
This method is best for identifying issues users might encounter during critical processes, such as completing a purchase or submitting a form, and it ensures these key pathways are always optimized for speed and reliability.
Implement Real User Monitoring (RUM)
While synthetic monitoring simulates interactions, RUM captures real-time data from actual users.
RUM gives information on how real-world users experience response times, revealing any performance discrepancies that synthetic testing might miss.
Set tiered alerting systems
Not all response time deviations require immediate intervention. Tiered alert levels allow you to prioritize issues based on severity.
For example, you can set a warning alert at 300ms and a critical alert at 500ms or higher, letting you address the most pressing issues first.
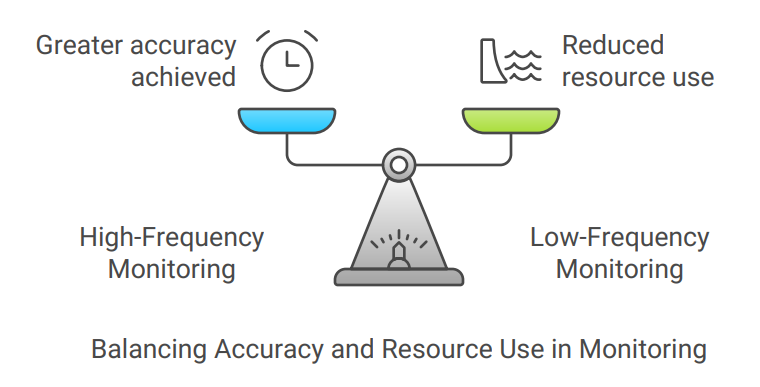
Optimize data collection frequency
Choosing the right frequency for data collection helps balance accuracy and resource use. For mission-critical applications, high-frequency monitoring (like every minute) is ideal, while lower-frequency checks (every five minutes, for example) may suffice for less intensive services.
Incorporate load testing
Performing regular load tests helps assess how your site performs under increased traffic. This type of testing prepares you for high-demand situations and reveals response time issues that only surface under stress.
Load testing can also help you identify the maximum capacity of your infrastructure, allowing you to scale resources accordingly.
Use automated reporting
Automated reporting tools compile information from monitoring data over time. Regular reports on response times and related metrics make it easy to communicate your website’s performance status to stakeholders, and highlight trends that require further attention.
Automated reports streamline data presentation and keep everyone involved informed while saving time.
Tips on improving response times
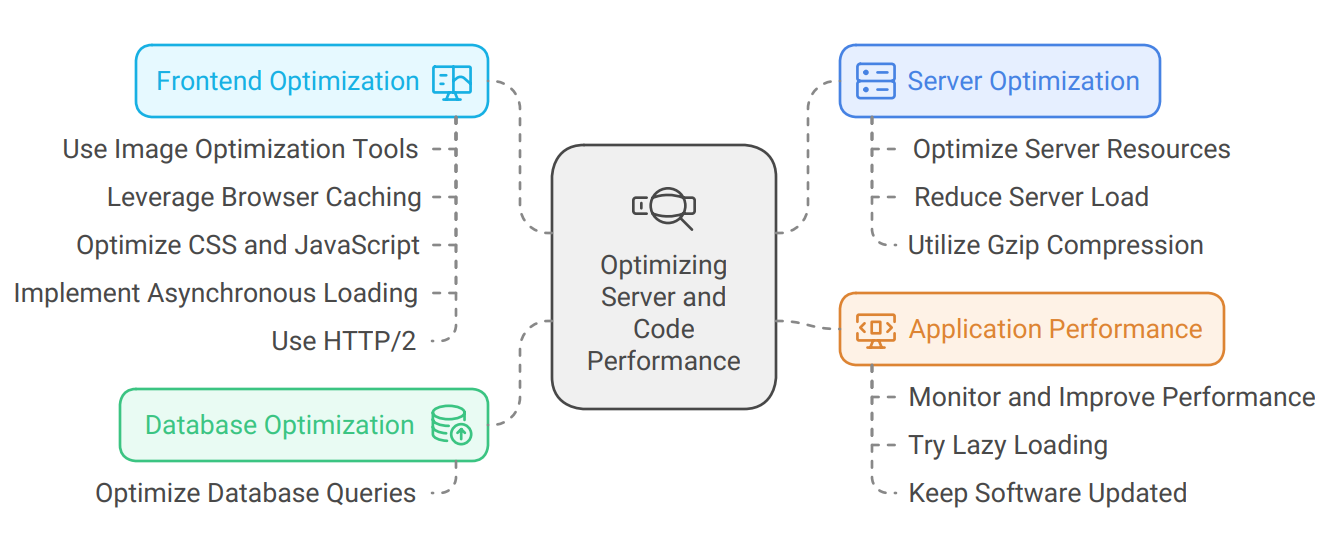
Improving response time is about optimizing both your server and your code. Here are some practical tips:
- Optimize server resources: Upgrade to faster servers or use a Content Delivery Network (CDN) to reduce load times.
- Reduce server load: Compress files, minimize HTTP requests, and enable caching to lighten the load on your server.
- Optimize database queries: Make sure your database queries are as efficient as possible to prevent bottlenecks.
- Monitor and improve application performance: Use tools to continuously monitor and optimize your code.
- Try lazy loading: Delay loading non-critical elements until they are needed, which reduces initial load time and speeds up response times.
- Use image optimization tools: Compress and format images properly to decrease file sizes without compromising quality. This can significantly reduce the load time of your site.
- Leverage browser caching: Enable browser caching so returning visitors don’t need to reload the entire page each time they visit, improving speed and user experience.
- Utilize Gzip compression: Enable Gzip compression on your server to reduce the size of your files and make them faster to load.
- Keep software updated: Make sure your CMS, plugins, and server software are up-to-date for optimal performance and security. Outdated software can slow down response times.
- Minimize third-party scripts: Reduce the number of external scripts and third-party integrations on your site.
- Optimize CSS and JavaScript: Minify and defer non-essential CSS and JavaScript to make your page load faster and smoother.
- Implement asynchronous loading: Load scripts asynchronously so they don’t block the rendering of other elements on the page.
- Use HTTP/2: Upgrade to HTTP/2, which allows for multiplexing and can handle multiple requests at the same time, speeding up page loading.
- Optimize DNS resolution time: Use a reliable DNS provider with fast response times to minimize the time it takes for DNS lookups.
How can UptimeRobot help with improving response times?
UptimeRobot offers a powerful range of monitoring tools designed to keep your website performing at its best. Here’s how UptimeRobot can help you improve response times and maintain a reliable online presence:
Real-time alerts for quick action
UptimeRobot keeps a constant eye on your site and sends instant alerts using your favorite integrations whenever response times cross your set limits. This means you can act quickly to resolve issues before they impact your visitors’ experience.
Comprehensive response time analytics
With UptimeRobot, you’ll get graphs showing your response times. These insights help you spot trends, identify potential issues, and make informed decisions to optimize your site’s performance.
Global monitoring coverage
Make sure your website performs well for users across the world. UptimeRobot checks your site from multiple global locations, avoiding false positives and making sure your website is available.
User-friendly dashboards
Our easy-to-navigate dashboards give you a clear view of your website’s key performance metrics. You can monitor response times, uptime, and more, all in one place, making it simple to keep track of your site’s health.
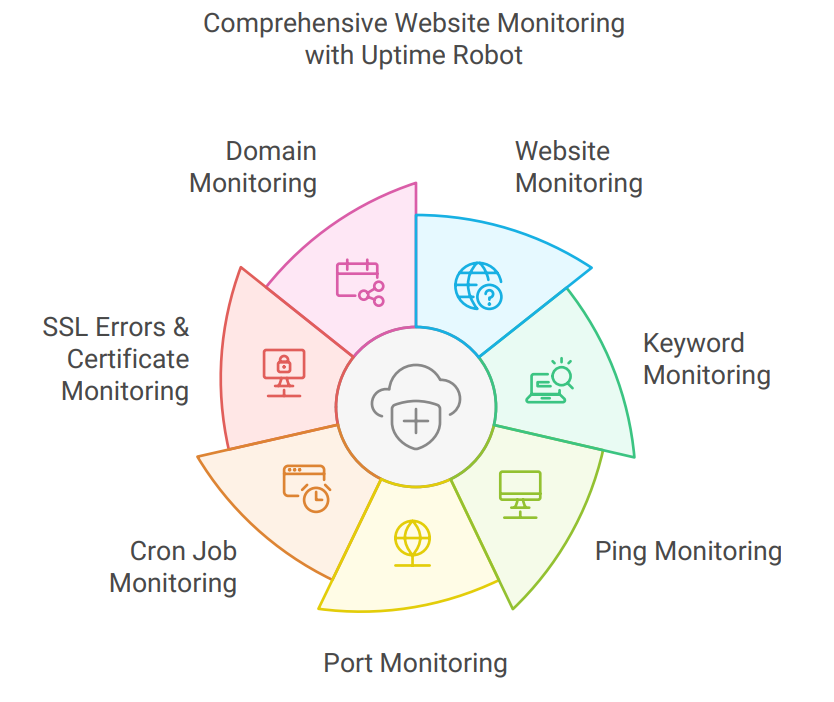
Types of monitoring you can count on
UptimeRobot goes beyond basic monitoring with options that cover every angle:
- Website monitoring: Keeps tabs on your site’s availability and response over HTTP/HTTPS.
- Keyword monitoring: Checks for the presence or absence of specific words on your pages, helping you detect unwanted changes.
- Ping monitoring: Ensures your server is reachable with regular ping checks.
- Port monitoring: Monitors custom ports and services like FTP or SMTP.
- Cron job monitoring: Verifies scheduled tasks (cron jobs) run smoothly.
- SSL errors & certificate monitoring: Alerts you before your SSL certificates expire to avoid security hiccups.
- Domain monitoring: Notifies you when your domain is close to expiring to prevent service interruptions.
Pro tools for advanced monitoring
UptimeRobot comes packed with advanced features for more in-depth performance tracking:
- Maintenance windows: Pause monitoring during scheduled maintenance to avoid unnecessary alerts.
- HTTP methods: Customize the HTTP method (HEAD, GET, POST, PUT, PATCH, DELETE) used for monitoring requests, allowing for more precise checks.
- Customizable status pages: Create branded status pages to share your site’s performance transparently.
- API access: Integrate monitoring data into your own applications, automate status updates, and customize performance checks for greater control and flexibility in your site management.

With these tools, UptimeRobot helps you stay proactive, ensuring your site stays fast, reliable, and ready for your users.
Ready to step up your monitoring game? Sign up for a free account today and get 50 monitors with checks every 5 minutes!
Conclusion
Keeping a close watch on your website’s response time is necessary for maintaining speed and reliability. Regularly tracking performance, pinpointing the causes of slowdowns, and implementing server optimization strategies, helps to improve the user experience and minimize the risk of lost revenue.
FAQ's
-
Response time monitoring measures how long a server or endpoint takes to respond to a request. It tracks latency from the moment a request is sent until a response is received. This helps identify slowdowns before they turn into outages.
-
Uptime monitoring checks whether a service is reachable at all. Response time monitoring shows how fast it responds when it is reachable. A service can be technically up but still unusably slow.
-
Common causes include high server load, slow database queries, network congestion, or third-party dependencies. Deployments and configuration changes can also introduce latency. Response time spikes often appear before full downtime.
-
A good response time depends on the type of service and user expectations. For most web applications, consistent sub-second responses are ideal. More important than a single number is stability and trend over time.
-
Response time is typically measured at the same interval as uptime checks. Shorter intervals provide faster detection of degradation but may create more noise. Consistent measurement is key for spotting trends.