Datadog is powerful, but it’s not always the right fit. Costs scale quickly, data caps surprise teams, and some setups feel heavier than the problems they’re meant to solve. When monitoring starts driving friction, it’s time to look at alternatives.
This guide compares top Datadog competitors in 2026 from an operator’s point of view. We focus on how these tools handle core monitoring needs, what setup and pricing look like in real environments, and where teams typically feel tradeoffs after adoption.
You’ll see which alternatives make sense for different use cases, from lightweight uptime checks to deeper infrastructure and application monitoring. If you’re rethinking your monitoring stack, this is a practical place to start.
Why look for Datadog alternatives?
Datadog is undeniably a powerful tool, but no platform is perfect. Businesses often seek alternatives due to specific challenges or needs that Datadog may not fully address.
Pain points with Datadog
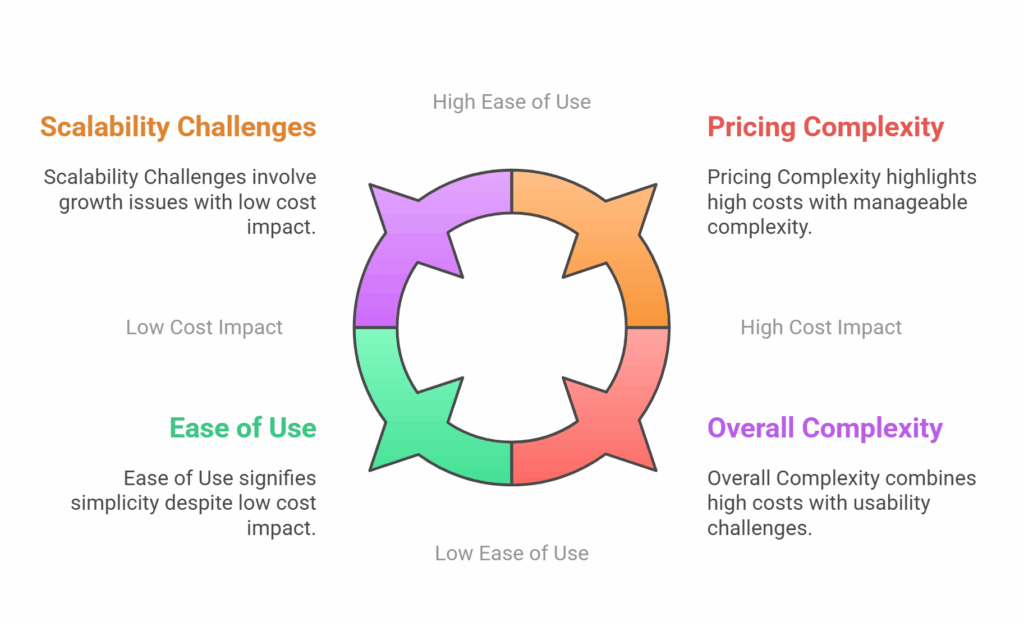
- High costs: Datadog’s modular pricing adds up fast. The more data you process or features you enable – APM, logs, synthetic checks – the higher the bill climbs.
- Scalability issues: While Datadog is built for large systems, its pricing model doesn’t always scale well alongside business growth.
- Setup complexity: For smaller teams or those new to observability, the platform can feel intimidating. Setting up agents, dashboards, and alerts takes time and technical know-how.
- Agent-based monitoring: Unlike tools like UptimeRobot, which let you start monitoring with just an email, Datadog requires agents to be installed across your stack, which is an added layer of complexity if you’re only trying to track basic availability or uptime.
Key features to look for in alternatives
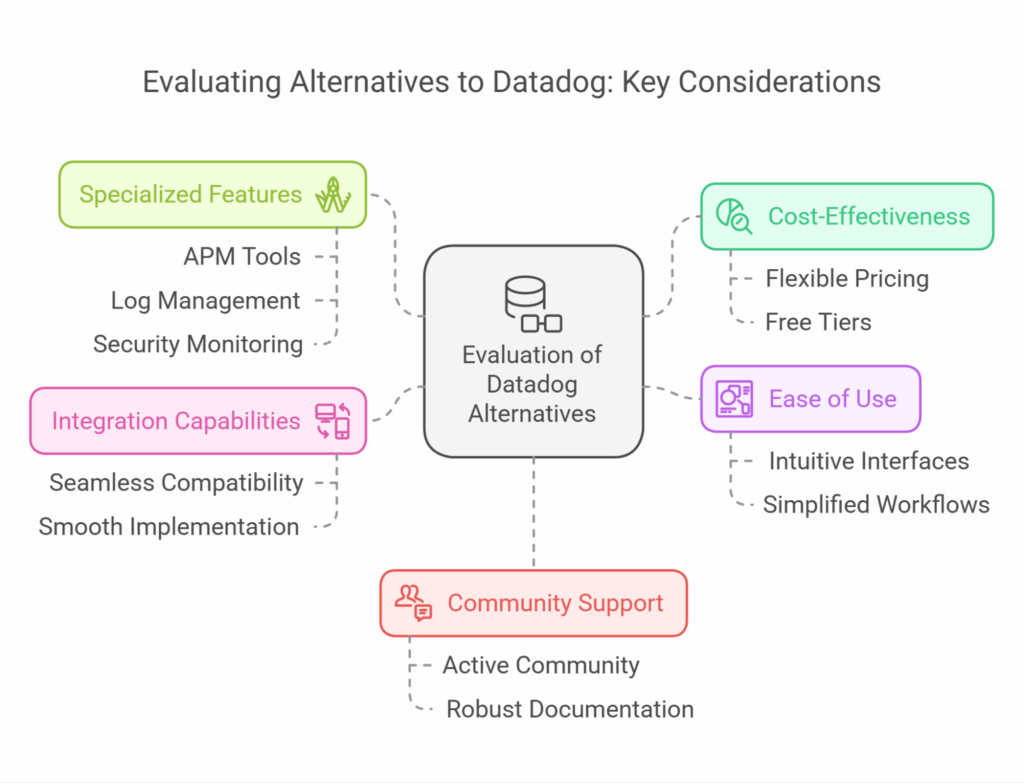
If you’re in the market for a different solution, here are the key factors to keep in mind:
- Better pricing models: Whether it’s a generous free tier or flat-rate billing, cost control matters, especially as your data volume grows.
- Ease of use: A clear, intuitive interface helps your team work faster and with fewer headaches.
- Feature focus: Some tools excel in specific areas, like log management, APM, or infrastructure monitoring. Be sure to match the tool to your core needs.
- Smooth integrations: Your monitoring stack should play well with the rest of your infrastructure from cloud providers to messaging platforms.
Strong community or support: For open-source platforms, good docs and active user communities are essential. For paid tools, look for responsive customer service and onboarding help.

Top Datadog competitors and alternatives
Whether you prioritize cost-effectiveness, ease of use, or advanced analytics, understanding what each alternative brings to the table will help you select a solution that delivers long-term value. Below, we explore the top competitors to Datadog and what makes each stand out.
1. UptimeRobot
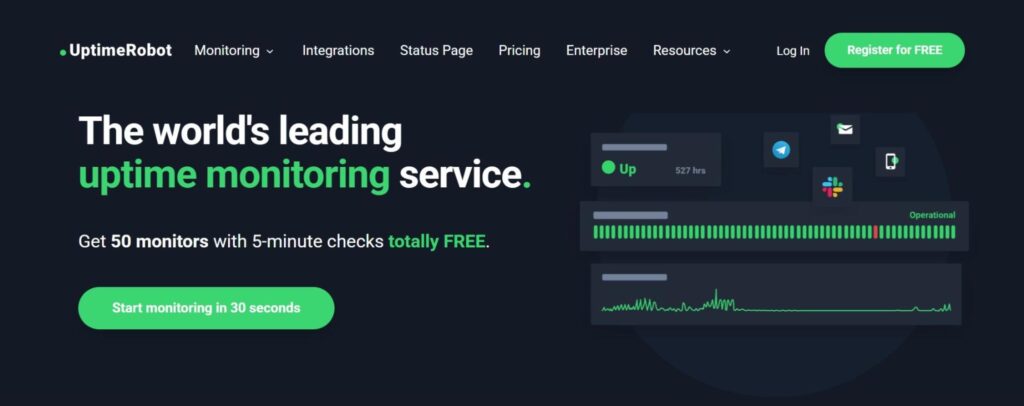
Best for: Teams that want fast, reliable website, API, and service monitoring without the complexity or cost of full-stack observability tools.
UptimeRobot is built for simplicity, focusing heavily on the essentials – uptime, performance, and availability – so you can stay ahead of issues without getting buried in dashboards or drowning in metrics.
Whether you’re monitoring a single site or managing a dozen services, setup is fast, alerts are instant, and the interface is made for humans, not engineers.
Features
- HTTP(s) website monitoring
- Keyword monitoring for specific content
- Ping monitoring (ICMP)
- Port monitoring (TCP)
- SSL certificate monitoring
- Cron job monitoring
- Status pages (public & private)
- 17 integrations including SMS, email, webhook, Microsoft Teams, Slack, Telegram, and Discord alerts
- One-minute checks (Premium users)
- Advanced alert settings (escalation, delay, repeated alerts)
- Maintenance windows
- API access
- Mobile apps for iOS & Android
Pricing
- Free plan: 5-minute checks, up to 50 monitors, basic alerting
- Pro plans: Start at $7/month
Learn more about UptimeRobot pricing on our pricing page.
| Pros | Cons |
| ✔️ Easy to set up and use even for non-technical users | ❌ No built-in log management or tracing |
| ✔️ Extremely affordable, with a generous free plan | ❌ Not designed for complex infrastructure observability |
| ✔️ Powerful alerting system with wide integration support | ❌ No anomaly detection or AI-driven analysis |
| ✔️ Great for websites, APIs, servers, cron jobs, and SSL monitoring | |
| ✔️ Supports status pages and team access on paid plans |
Ready to monitor without the overhead?
UptimeRobot is free to start – no credit card required. Get set up in minutes and start getting alerted the moment something goes down.
2. Better Stack
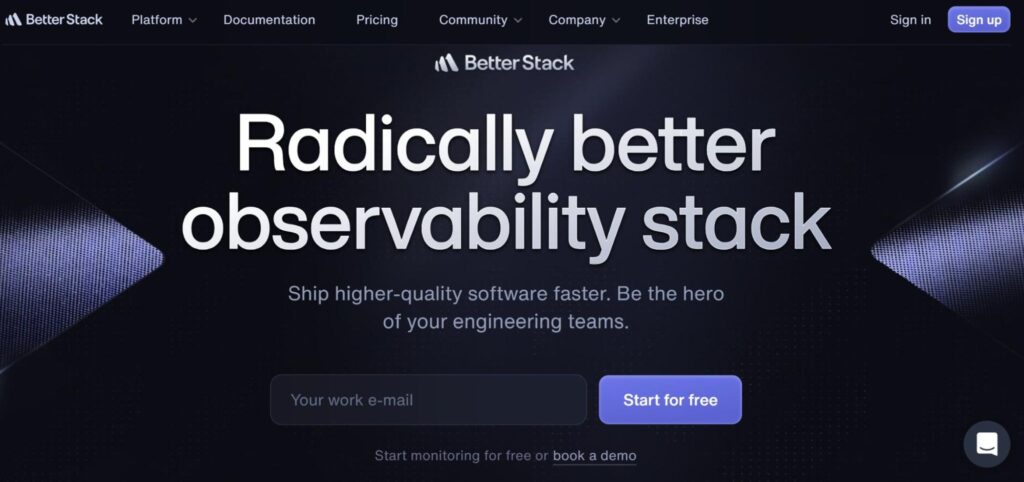
Best for: DevOps teams and startups that want clean, collaborative log management and incident response in one place.
Better Stack brings modern design and functionality to infrastructure monitoring and logging. Built with developers in mind, it combines uptime monitoring, logging, alerting, and on-call scheduling, which makes it especially attractive for smaller teams who want to streamline their toolset without sacrificing power.
Features
- Log management with structured querying
- Uptime monitoring and status pages
- Alerting via Slack, Teams, SMS, and phone calls
- Incident management and on-call schedules
- Built-in dashboard visualizations
- Audit logs and access controls
- API and webhook support
- Integration with tools like GitHub, Sentry, and PagerDuty
Pricing
- Free plan: Includes basic monitoring, logs, and limited alerting
- Pro plans: Start at $29/month
| Pros | Cons |
| ✔️ Sleek, modern UI with intuitive workflows | ❌ May not scale well for very large enterprise infrastructures |
| ✔️ Combines logging and monitoring in a single platform | ❌ Lacks some advanced observability tools (such as distributed tracing) |
| ✔️ Strong alerting and incident management features | ❌ Lower log retention on free tier |
| ✔️ Competitive pricing for growing teams | ❌ Smaller ecosystem than legacy players |
If you want an all-in-one tool that handles both uptime and logs without enterprise bloat, Better Stack is a solid choice especially for fast-moving teams that care about simplicity and aesthetics.
Want to see how Better Stack stacks up against UptimeRobot? Check out our comparison page.
3. Splunk
Best for: Enterprises needing robust, scalable log analysis and security insights across sprawling infrastructure.
Splunk is the heavyweight champion of log management and machine data analytics. It’s complex, powerful, and built for scale. From infrastructure observability to security monitoring, Splunk is packed with capabilities, but it comes at a cost and requires a team that knows how to wield it.
Features
- Enterprise-level log ingestion and querying
- Security Information and Event Management (SIEM)
- Custom dashboards and visualizations
- Real-time alerts and anomaly detection
- Machine learning models and predictive insights
- Data forwarding, indexing, and retention controls
- Hybrid deployment: cloud, on-prem, or both
- Compliance and role-based access control
Pricing
- Free trial available
- Paid plans: You can either choose workload pricing or ingest pricing, both of which vary depending on usage. Check their pricing page for more info.
| Pros | Cons |
| ✔️ Industry-standard for security and log analytics | ❌ Very expensive for growing data volumes |
| ✔️ Highly scalable and customizable | ❌ Requires expertise to implement and maintain |
| ✔️ Powerful search and visualization tools | ❌ Complex UI, steep learning curve |
| ✔️ Strong security and compliance tools | ❌ Not ideal for small teams or simple monitoring needs |
Splunk isn’t for the faint of heart, but if you’re managing petabytes of log data and need deep analytics, audit trails, or SOC-level insights, it’s one of the best.
4. New Relic
Best for: Engineering teams seeking a comprehensive, all-in-one observability platform with strong APM, infrastructure monitoring, and real-user insights.
New Relic offers a unified observability platform that provides deep visibility into applications, infrastructure, and customer experiences. It’s designed to help teams quickly identify and resolve issues across their entire tech stack.
Features
- Application Performance Monitoring (APM)
- Infrastructure monitoring
- Real User Monitoring (RUM)
- Synthetic monitoring
- Distributed tracing
- Dashboards and visualizations
- Alerting and anomaly detection
- Integrations with popular tools and platforms
Pricing
- Free plan: Includes 100 GB/month of data ingest, one full platform user, and unlimited basic users.
- Paid plans: New Relic offers 3 paid plans, with pricing available upon request.
| Pros | Cons |
| ✔️ Comprehensive observability features in one platform | ❌ Costs can escalate with increased data ingest and user count |
| ✔️ User-friendly interface with customizable dashboards | ❌ Some advanced features require higher-tier plans |
| ✔️ Strong integrations with various tools and platforms | ❌ Pricing model may be complex for some organizations |
New Relic is a powerful observability platform suitable for teams that need deep insights across applications and infrastructure. While it offers a generous free tier, costs can increase with scale.
5. Prometheus and Grafana
Best for: DevOps teams comfortable with open-source tools seeking customizable metrics collection and visualization solutions.
Prometheus and Grafana form a popular open-source stack for monitoring and observability. Prometheus handles metrics collection and alerting, while Grafana provides rich visualizations and dashboards.
Features
Prometheus:
- Time-series data collection
- Powerful query language (PromQL)
- Alerting capabilities
- Service discovery and dynamic configuration
Grafana:
- Customizable dashboards
- Support for multiple data sources
- Alerting and notification channels
- Plugin ecosystem for extended functionality
Pricing
- Prometheus and Grafana: Free and open-source.
- Grafana Cloud: Offers hosted solutions with varying pricing tiers based on usage.
| Pros | Cons |
| ✔️ Highly customizable and flexible | ❌ Requires setup and maintenance |
| ✔️ Strong community support and extensive documentation | ❌ No built-in log management |
| ✔️ Free to use with no licensing fees | ❌ May require additional tools for full observability |
Prometheus and Grafana offer a flexible, open-source solution for metrics collection and visualization. Ideal for teams that prefer to manage their own monitoring infrastructure.
6. SigNoz
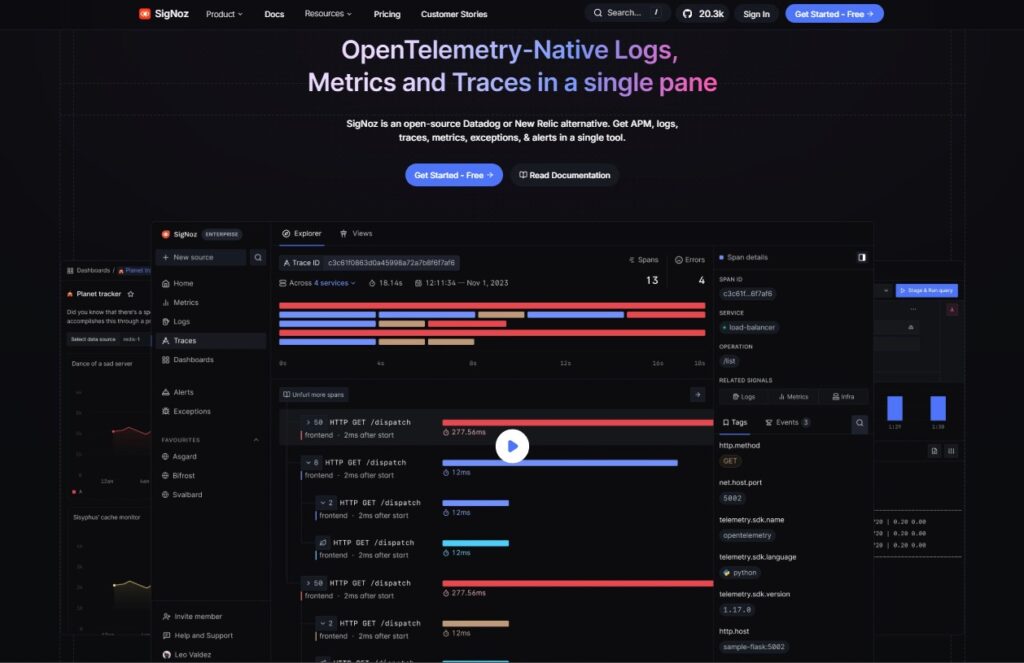
Best for: Organizations seeking an open-source alternative for full-stack observability with a focus on cost-effectiveness and performance.
SigNoz is an open-source observability platform that combines metrics, traces, and logs in a single interface. Built with OpenTelemetry support, it aims to provide a seamless monitoring experience without the high costs associated with some commercial tools.
Features
- Distributed tracing and metrics collection
- Log management
- Built-in dashboards and visualizations
- OpenTelemetry-native support
- Backend powered by ClickHouse for efficient performance
Pricing
- Self-hosted: Free and open-source.
- Cloud-hosted:
- Starts at $49/month, including 100 GB of data ingest.
- Additional usage billed at $0.30/GB for logs and traces.
| Pros | Cons |
| ✔️ Unified observability with metrics, traces, and logs | ❌ Requires self-hosting or opting for the cloud-hosted version |
| ✔️ Cost-effective with transparent pricing | ❌ Smaller community compared to more established tools |
| ✔️ OpenTelemetry-native for smooth integration | ❌ May lack some advanced features found in commercial alternatives |
SigNoz offers a compelling open-source solution for full-stack observability, combining metrics, traces, and logs. It’s a great choice for teams looking to balance functionality with cost.
7. Dynatrace
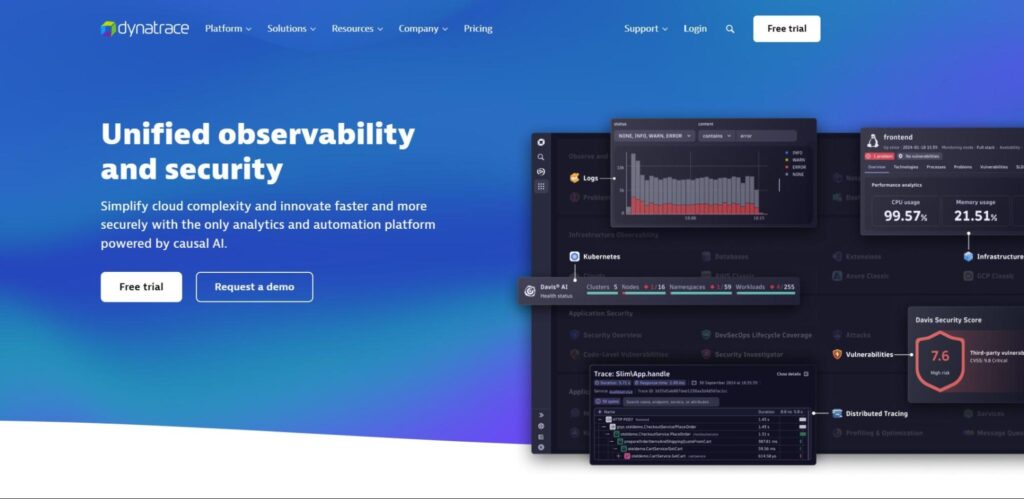
Best for: Enterprises seeking AI-driven, full-stack observability across complex, dynamic environments.
Dynatrace offers a comprehensive observability platform powered by its proprietary AI engine, Davis®. It’s designed to provide deep insights into applications, infrastructure, and user experiences, making it a go-to choice for large organizations with intricate systems.
Features
- Full-stack monitoring (applications, infrastructure, microservices)
- AI-powered root cause analysis with Davis®
- Real user and synthetic monitoring
- Distributed tracing and code-level diagnostics
- Automatic dependency mapping
- Kubernetes and container monitoring
- Log management and analytics
- Application security monitoring
Pricing
- Full-Stack Monitoring: $0.08 per hour for an 8 GiB host
- Infrastructure Monitoring: $0.04 per hour for any size host
- Kubernetes Monitoring: $0.002 per hour for any size pod
- Application Security: $0.018 per hour for an 8 GiB host
- Log Management:
- Ingest & Process: $0.20 per GiB
- Retention: $0.02 per GiB-day
- Real User Monitoring: $0.00225 per session
- Synthetic Monitoring: $0.001 per synthetic request
Note: Pricing is based on list prices and may vary based on usage and agreements.
| Pros | Cons |
| ✔️ AI-driven insights for proactive issue resolution | ❌ Pricing can be complex and may escalate with scale |
| ✔️ Comprehensive monitoring across the entire stack | ❌ Steeper learning curve for new users |
| ✔️ Automatic discovery and dependency mapping | ❌ May be overkill for smaller environments |
| ✔️ Strong support for cloud-native and hybrid architectures | ❌ Some advanced features require additional licensing |
Dynatrace is a high-performance observability platform built for enterprises with complex and dynamic systems. It offers deep, automated insights across your infrastructure and applications, but it does require a bigger investment of time, money, and onboarding effort.
8. SolarWinds AppOptics
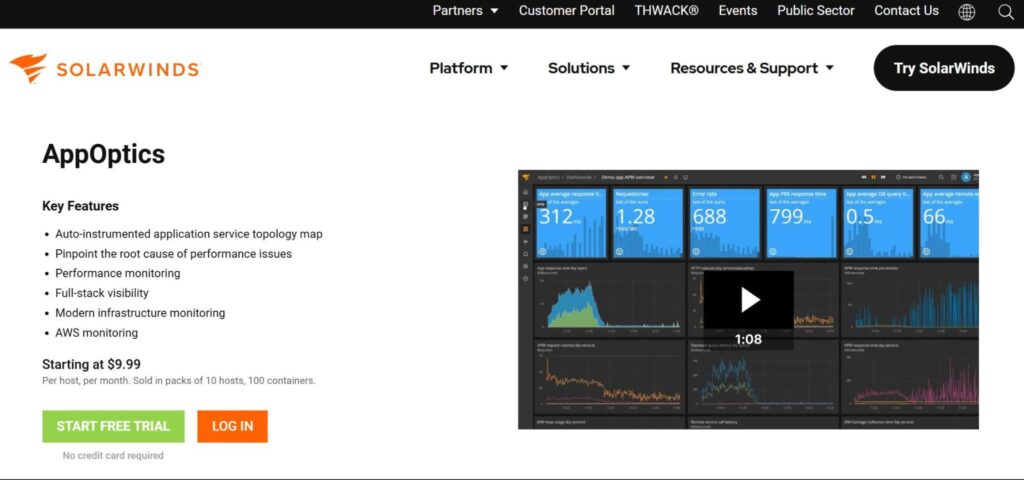
Best for: Mid-sized businesses seeking an affordable, all-in-one performance monitoring solution.
SolarWinds AppOptics provides infrastructure and application performance monitoring with a focus on simplicity and cost-effectiveness. It’s designed for organizations that need comprehensive monitoring without the complexity of enterprise-grade tools.
Features
- Real-time application and infrastructure monitoring
- Distributed tracing
- Customizable dashboards and alerts
- Over 150 integrations
- Host and container monitoring
- Anomaly detection
- API access for custom integrations
Pricing
- Application Observability: $27.50 per service per month
- Network and Infrastructure Observability: $12.00 per active network device or host per month
- Log Observability: $5.00 per GB per month
- Database Observability: $70.00 per database instance per month
- Digital Experience Observability – Synthetic Monitoring: $10.00 per 10 uptime or 2 transaction checks per month
- Digital Experience Observability – Real User Monitoring (RUM): $10.00 per 100,000 page views per month
- Free trial available for all options
| Pros | Cons |
| ✔️ Affordable pricing for comprehensive features | ❌ Reached End of Service Life on September 30, 2025 |
| ✔️ Easy to set up and use | ❌ Lacks some advanced features found in enterprise tools |
| ✔️ Wide range of integrations | ❌ May not scale well for very large environments |
| ✔️ Combines infrastructure and application monitoring in one platform | ❌ Limited customization compared to open-source alternatives |
SolarWinds AppOptics offers a cost-effective, user-friendly monitoring solution suitable for mid-sized businesses. However, with its End of Service Life (September 30th, 2025, organizations should plan for migration to alternative platforms.
9. Elastic Observability
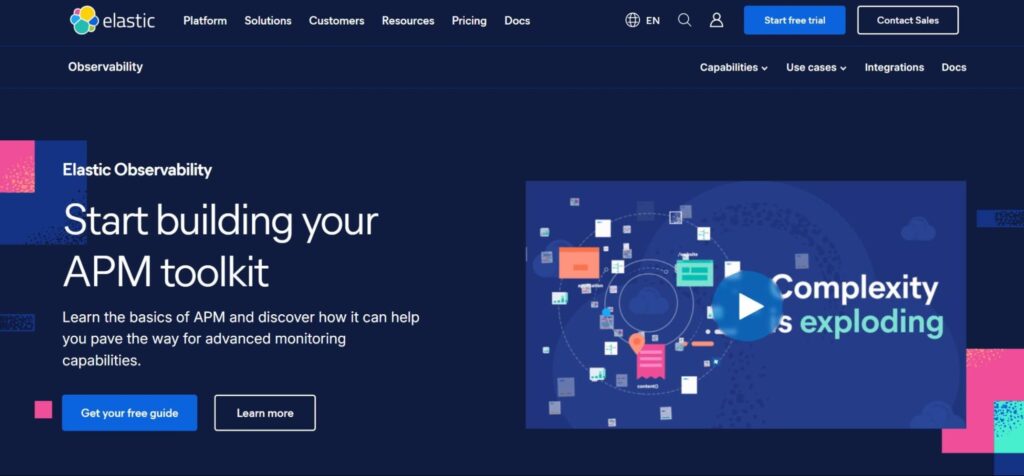
Best for: Teams already using the Elastic Stack seeking unified observability across logs, metrics, and traces.
Elastic Observability integrates flawlessly with the Elastic Stack, providing a unified solution for monitoring and analyzing logs, metrics, and traces. It’s ideal for organizations that require scalable observability within the Elastic ecosystem.
Features
- Unified view of logs, metrics, and traces
- Powerful search and filtering capabilities
- Scalable architecture for large datasets
- Integration with Elastic Security and Enterprise Search
- Machine learning for anomaly detection
- Support for OpenTelemetry
- Customizable dashboards with Kibana
Pricing
- Ingest: As low as $0.15 per GB ingested
- Retention: As low as $0.02 per GB retained per month
- Egress: First 50 GB free, then $0.05 per GB transferred per month
Note: Pricing may vary based on deployment and usage.
| Pros | Cons |
| ✔️ Integration with the Elastic Stack | ❌ Requires expertise in Elastic Stack for effective use |
| ✔️ Highly scalable for large datasets | ❌ Hosting costs can add up for large-scale deployments |
| ✔️ Powerful search and analytics capabilities | ❌ May require additional configuration for full observability |
| ✔️ Flexible deployment options (self-managed or cloud) | ❌ Some advanced features may require higher-tier subscriptions |
Elastic Observability is an excellent solution for organizations already invested in the Elastic ecosystem, offering scalable and powerful observability features. Its flexibility and integration capabilities make it a strong choice for teams familiar with Elastic tools.
Comparison table: features, pricing, and use cases
When evaluating alternatives to Datadog, it’s important to compare features, pricing, and ideal use cases to determine the best fit for your organization. The table below highlights key details about the top competitors so you can make an informed decision.
| Tool | Features | Pricing | Ideal Use Cases |
| UptimeRobot | Website & SSL monitoring, keyword monitoring, alerts, ping/port monitoring, cron job monitoring, +more! | Free tier; Premium from $7/month | Website uptime and basic across-the-board monitoring |
| Better Stack | Logs, metrics, incident response, dashboards | Free tier; Paid from $29/month | Log management and incident response |
| Splunk | SIEM, log analytics, machine learning | Workload or ingest pricing | Enterprise-scale security and log management |
| New Relic | APM, tracing, real-time error monitoring | Free tier; pricing upon request | Application performance and developer insights |
| Prometheus & Grafana | Metrics collection, visualization (self-hosted) | Free (self-hosted) | DevOps teams using open-source stacks |
| SigNoz | OpenTelemetry-native metrics & traces | Free (self-hosted); cloud-hosted costs vary | Cost-effective open-source observability |
| Dynatrace | AI-powered full-stack monitoring | Free trial; see section for details | Large-scale enterprise observability |
| SolarWinds AppOptics | Metrics, traces, logs, integrations | Free trial; see section for details | Mid-sized teams needing all-in-one monitoring |
| Elastic Observability | Logs, APM, metrics (Elastic Stack) | Ingest, retention, and egress pricing | Teams already using Elastic or needing scalable search |
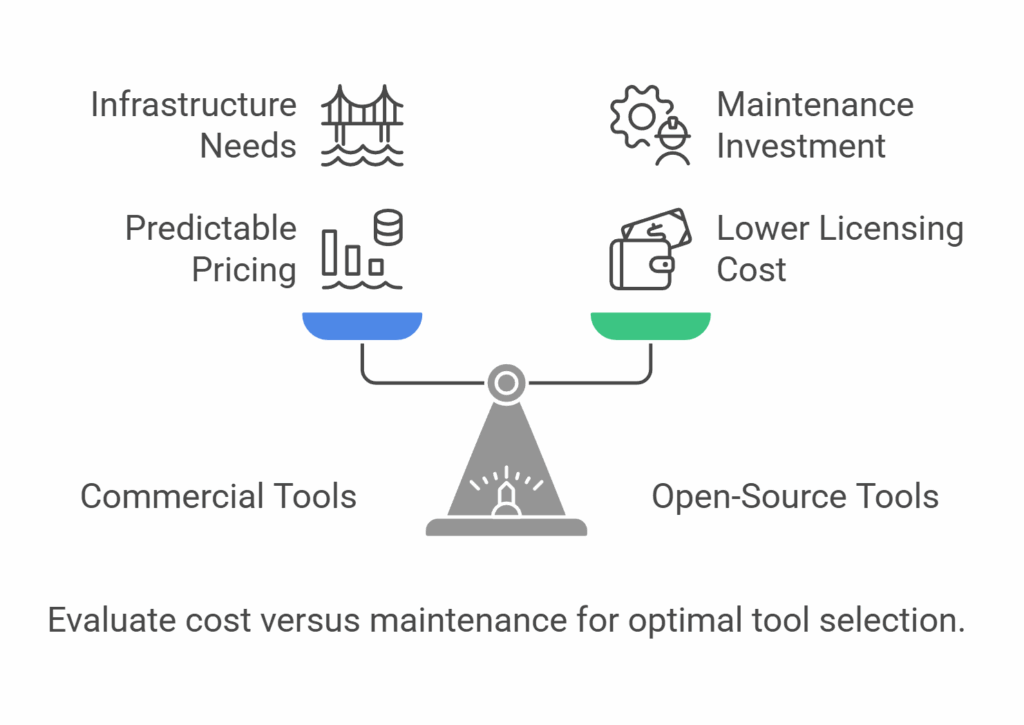
Factors to consider when choosing a Datadog alternative
Choosing the right monitoring and observability tool isn’t just about flashy features. It’s about finding the right fit for your team’s size, goals, and budget. Here’s what to keep in mind:
Budget and pricing flexibility
Monitoring costs can grow fast, especially with usage-based pricing models. If your data volume spikes or you start needing more integrations, you might be hit with unexpected costs.
Tools like UptimeRobot or Prometheus & Grafana can help reduce licensing overhead, while platforms like Dynatrace and Splunk come at a premium but deliver enterprise-level power.
Scalability and future growth
Can the tool scale with your infrastructure? A startup might be fine with basic website monitoring for now, but if you’re planning for container orchestration or microservices, you’ll want a platform like SigNoz or Elastic Observability that’s built to evolve with you.
Ease of integration
How well does the tool play with the rest of your stack? Look for native integrations with your cloud provider, CI/CD tools, messaging platforms (like Slack or Teams), and existing monitoring layers. SigNoz stands out here with OpenTelemetry-native architecture, while AppOptics offers over 150 out-of-the-box integrations.
Learning curve and team resources
Some platforms require more technical overhead than others. Open-source tools like Prometheus and Grafana offer flexibility but may require dedicated time to configure and maintain.
On the other hand, Better Stack and UptimeRobot are plug-and-play solutions that don’t require deep observability expertise.
Security and compliance
If you’re handling sensitive data or operating in regulated environments, you’ll want features like RBAC, encryption, and audit logs. Splunk and Elastic Observability are especially strong in this space, offering robust compliance and security tooling.
By taking these factors into account, you can ensure that the Datadog alternative you choose not only meets your technical needs but also aligns with your organization’s long-term goals.
How to evaluate Datadog competitors
Teams usually look for Datadog competitors after hitting the same friction points: rising costs, alert noise, or operational overhead that grows faster than insight. Comparing alternatives only by feature checklists often leads straight back to those problems.
Start by clarifying what you actually use. Datadog covers metrics, logs, traces, synthetics, and more. Most teams rely heavily on a subset. If you mainly need uptime checks, response time trends, and reliable alerts, a full observability suite may be unnecessary weight. Paying for unused surface area recreates cost and complexity under a new name.
Pricing mechanics matter more than sticker price. Usage-based models tied to events, spans, or log volume can spike during incidents, exactly when visibility matters most. Look for pricing that stays predictable under stress, not just cheap at baseline traffic.
Setup and maintenance effort is another hidden cost. Agent-heavy tools require versioning, permissions, and ongoing upkeep. In dynamic environments, this creates drift and blind spots over time. Lighter tools that rely on external checks or minimal instrumentation often stay accurate with less work.
Alerting philosophy is a key differentiator. Some tools expose raw data and expect you to build meaning from scratch. Others provide opinionated defaults. Mismatch here leads to noisy alerts or missed incidents. The best fit is the one that matches how your team already responds during outages.
Failure independence is easy to overlook. Tools that run entirely inside your infrastructure can fail along with it. External monitoring adds a second point of view that often detects outages first. Many teams pair internal observability with an external uptime layer to cover this gap.
Migration reality should factor into the decision. Replacing Datadog rarely happens in one step. Tools that can coexist during transition reduce risk and allow gradual cutover. Forced rip-and-replace increases pressure and rollback cost.
Finally, judge tools by incident outcomes, not dashboards. Ask how quickly teams detect issues, understand impact, and recover. If a tool improves those moments, it is an upgrade. If it mainly adds data, it is not.
The goal is not to find a cheaper Datadog clone. It is to choose tools that align with how your team monitors, alerts, and responds today, without compounding complexity tomorrow.
Conclusion
Datadog is a powerful, all-in-one observability platform, but it’s not always the best fit for every team. Whether you’re scaling quickly, watching your budget, or just need something simpler to manage, there’s a whole world of alternatives worth considering.
From UptimeRobot’s lightweight, affordable uptime monitoring to Splunk’s enterprise-grade analytics, each tool on this list brings something different to the table:
- Small teams may gravitate toward UptimeRobot or Better Stack for ease of use and lower pricing.
- Open-source fans will appreciate the flexibility and community support of Prometheus, Grafana, or SigNoz.
- Enterprises seeking advanced AI capabilities and full-stack observability might lean toward Dynatrace or Elastic Observability.
No matter where you land, the right solution will align with your tech stack, your team’s expertise, and your long-term goals – not just your current frustrations with Datadog.
Most of the platforms here offer free trials or forever-free tiers, so there’s no reason not to test them out and see which one clicks.
UptimeRobot is one such forever free tool – sign up now to get 50 monitors for life, no credit card required!
FAQ's
-
Teams usually look for alternatives due to cost, complexity, or tool sprawl. As usage grows, pricing can become hard to predict. Some teams also want simpler setup or more focused monitoring.
-
Start with your actual needs: uptime checks, infrastructure metrics, logs, traces, or alerting. Compare setup effort, pricing transparency, alert reliability, and data retention. Feature breadth matters less than day-to-day usability.
-
Many alternatives are designed specifically for smaller teams. They often prioritize faster onboarding, fewer agents, and clearer pricing. This reduces operational overhead while still covering core monitoring needs.
-
Not always. Some tools are agentless and rely on external or synthetic checks. Agent-based tools provide deeper system visibility but require more maintenance and access.
-
Some tools focus only on uptime and response time, while others combine infrastructure metrics and basic performance monitoring. Full APM replacements are less common and usually more complex. Many teams mix tools instead of using a single platform.