AI systems can look healthy right up to the moment they stop being useful. The endpoint is up. Latency looks fine. The logs are quiet, but output quality slips, token spend climbs, or a model starts drifting.
That is where AI observability earns its keep.
This guide maps the signals that matter across data, models, infrastructure, and behavior. If app monitoring says the service is up, AI observability shows whether it is still doing the job.

Key takeaways
- AI observability is the practice of monitoring data, models, and infrastructure to keep AI systems reliable, efficient, and trustworthy.
- The core pillars of AI observability are data, model, infrastructure, and behavior.
- AI systems need observability because they are dynamic and can drift, degrade, or fail silently over time.
- Observability should be embedded across the entire AI lifecycle from training to deployment, inference, and feedback.
- Key metrics to monitor include latency, accuracy decay, drift, token costs, confidence scores, outliers, and ethical guardrails.
- Common AI failures that observability can prevent include regressions, cost spikes, hidden bias, hallucinations, and downtime.
- Best practices for observability include establishing baselines, using tracing and logging, adding explainability, monitoring ethics, and ensuring uptime.
- The best AI observability tools include UptimeRobot, Dynatrace, Coralogix, Censius, Aporia, Arize, Fiddler, and New Relic.
- The future of AI observability will focus on explainability, cost control, and safety at scale.
Understanding AI observability
AI observability is the practice of continuously monitoring, analyzing, and understanding how AI systems perform in production environments. It gives real-time visibility into system behavior and helps detect issues such as data drift, model bias, or performance degradation.
While traditional software observability focuses on three core questions. Is the application running? How fast is it performing? Are there any errors? AI systems are unpredictable and dynamic.
This means AI observability goes beyond basic uptime and performance metrics to ask deeper questions. Is the AI making good decisions? Is it treating all groups fairly? Are its predictions becoming less accurate over time?
Observability vs. monitoring vs. explainability
Let us see how these three are different from each other.
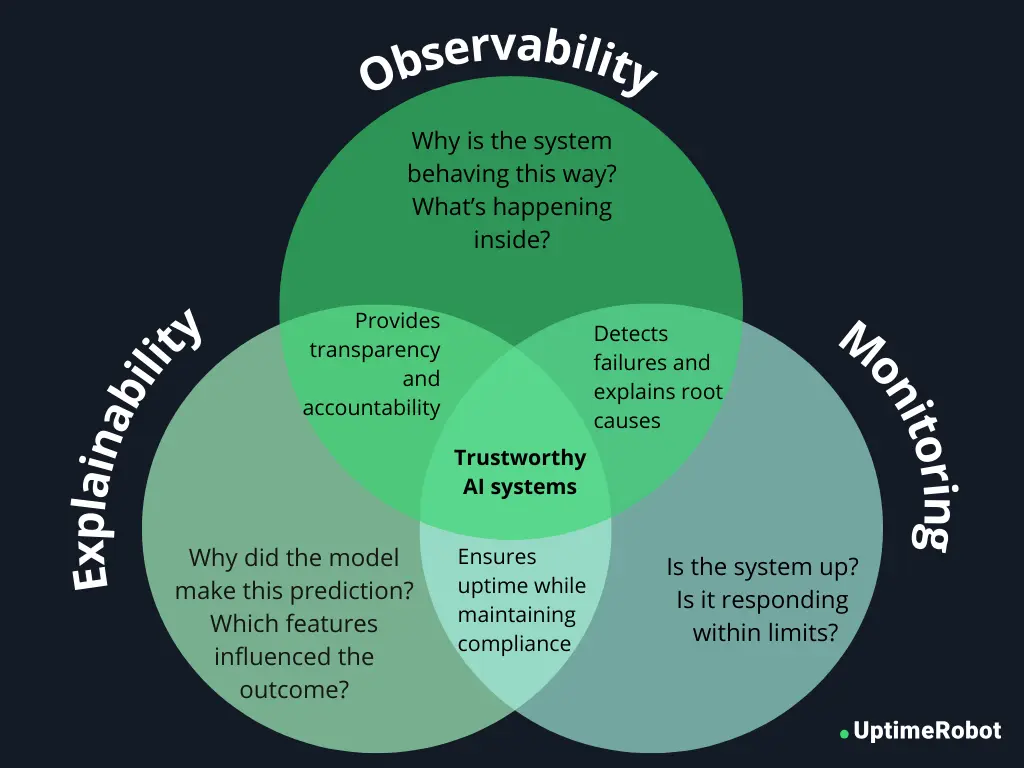
- Monitoring is about tracking predefined metrics and alerts. For example, you might measure latency, error rates, or system uptime. Monitoring tells you what is happening in your AI system.
- Explainability focuses on understanding why a model made a particular decision. Tools like SHAP or LIME can show which inputs influenced a prediction, helping teams interpret model behavior and ensure fairness or compliance.
- Observability goes a step further by combining both monitoring and explainability. It provides a complete view of AI system health, helping teams detect anomalies, investigate root causes, and understand behavior across data, models, and infrastructure. Observability answers not just “Is the system working?” but also “Why is it behaving this way, and how can we fix it?”
In short:
- Monitoring = What is happening?
- Explainability = Why did it happen?
- Observability = What’s happening, why it’s happening, and how to fix it.
Core pillars of AI observability
AI observability is built on four pillars, each providing critical insight into a specific part of the system.
- Data – Monitoring the quality, freshness, and structure of your input data. Track issues like missing values, schema changes, and data drift to ensure your models receive reliable information.
- Model – Observing model behavior, including accuracy, fairness, confidence scores, output stability, and latency. This pillar keeps predictions reliable and aligned with business objectives.
- Infrastructure – Keeping an eye on the underlying compute and system resources, such as GPU/TPU usage, API uptime, latency, and scaling efficiency. Infrastructure observability ensures your AI runs smoothly at production scale.
- Behavior – Monitoring real-world outputs for anomalies, hallucinations, bias, or ethical concerns. This pillar helps maintain trust, safety, and compliance.
Why AI systems need observability
AI systems are fundamentally different from traditional software. Their complexity, dynamic behavior, and reliance on constantly changing data make them prone to silent failures if left unchecked. Observability provides continuous visibility, helping teams detect and resolve issues before they impact users or business outcomes.
Complexity of AI systems
Many AI models, particularly deep learning systems, are difficult to interpret. They often handle millions of requests with complex interdependencies. Observability tools help teams understand why a model made a decision and identify root causes when issues arise.
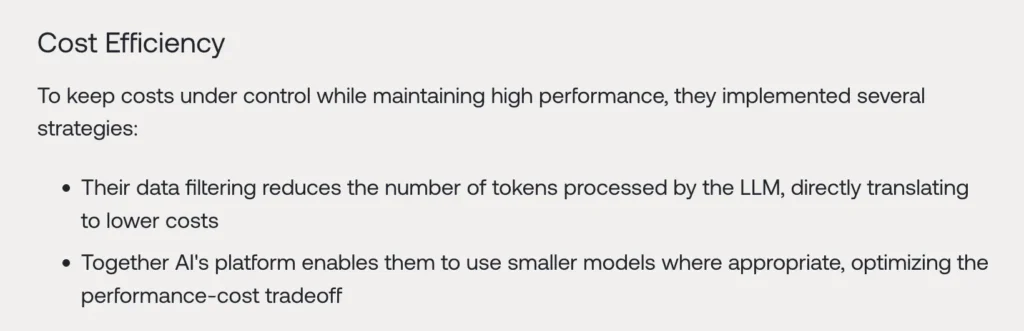
Cost and resource management
LLMs and AI APIs charge per token or request, so unexpected usage spikes can lead to rather large costs. For instance, a customer support chatbot using long context prompts may see token consumption surge as traffic grows, resulting in tens of thousands of dollars in extra monthly bills.
Example: Zomato, the Indian food delivery app, implemented data filtering to send only relevant information to their AI models and used smaller models for routine queries. This strategy greatly reduced token usage and operational costs while maintaining fast and accurate responses.
Silent failures and output risks
Unlike traditional software, AI models can “fail silently” by producing plausible but incorrect outputs. ChatGPT, for instance, may confidently generate fabricated answers, making errors difficult to detect without monitoring. Observability helps identify these subtle failures early and ensures the AI behaves as expected.

Sensitive to data quality
AI models are highly sensitive to data quality. Even minor changes in preprocessing, missing features, or corrupted inputs can affect outcomes.
When combined with data drift (shifts in input distributions) and concept drift (changes in input-output relationships), model performance can degrade gradually and without obvious signs. Observability provides the visibility needed to detect these issues early and prevent user impact.
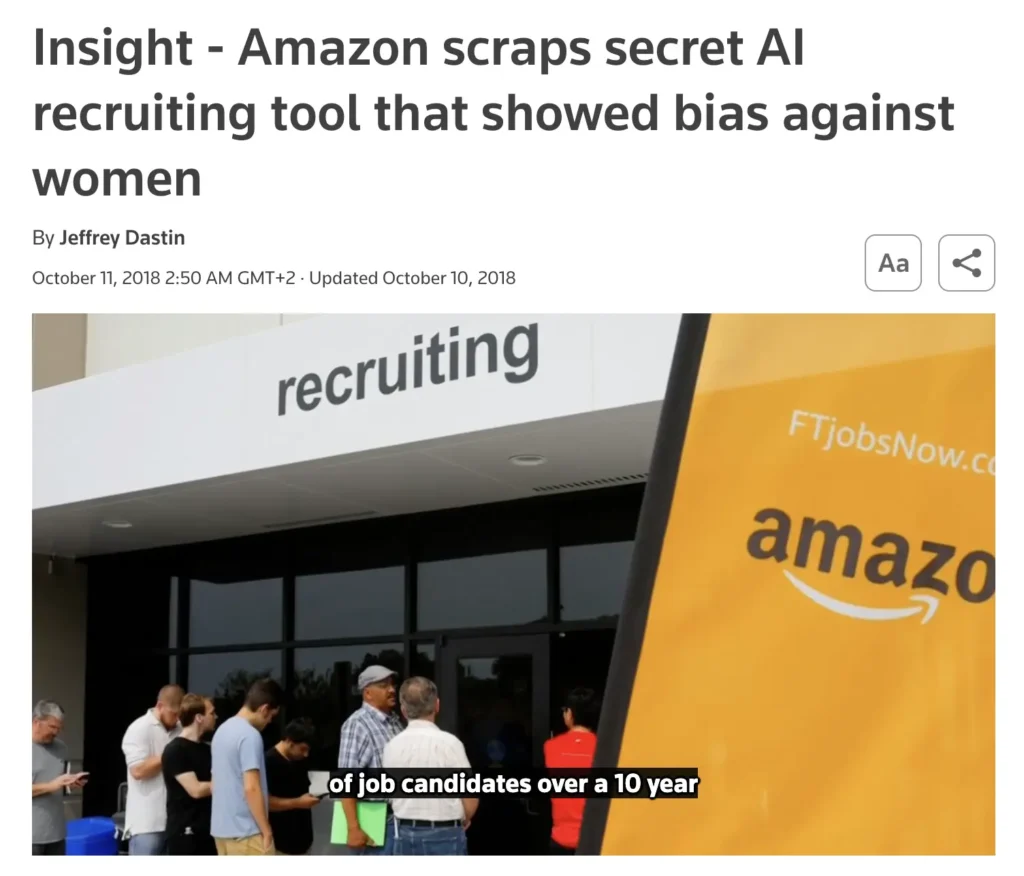
Bias and ethical risks
AI systems can exhibit unexpected biases that were not evident during training. Continuous monitoring ensures models make fair and ethical decisions across all user groups.
For example, Amazon scrapped its AI recruiting tool after discovering that the hiring algorithm, trained on historical resumes, favored male candidates. Observability helps detect and mitigate such biases before they affect real-world outcomes.
Components of AI observability
For a reliable AI system, observability must be applied across these three layers: data, model, and infrastructure. Each layer provides different signals, but together they create a holistic view of system health.
Data observability
AI systems rely on vast amounts of structured and unstructured data to generate meaningful outputs. According to Gartner, AI-ready data depends on three key pillars: metadata management, data quality, and data observability.
Without these foundations, more than 60% of AI projects will fail to deliver on business goals and eventually be abandoned. This highlights why even subtle issues in data can have huge effects on model performance.
Key aspects of data observability include:
- Data drift: Detecting shifts in input distributions (like evolving user queries) that can silently reduce predictive accuracy.
- Schema changes: Monitoring upstream pipelines for breaking changes such as missing columns, altered formats, or type mismatches.
- Quality issues: Catching anomalies like duplicates, outliers, missing values, or corrupted records before they affect predictions.
Model observability
Model observability is the practice of monitoring and validating how machine learning (ML) models perform and behave in production. Tracking key metrics and signals helps teams understand model performance, usage, and reliability in real-world conditions.
Key aspects of model observability include:
- Accuracy: Tracking the model in real time to catch drops in performance.
- Token cost: Tracking token usage to avoid waste and keep costs under control.
- Latency: Monitoring how fast the model responds to ensure it meets user expectations.
- Bias: Checking if the model treats different groups unfairly and fixing issues to prevent harm.
- Versioning: Keeping track of which model version is running so results can be reproduced or rolled back if needed.
- Output variation: Watching for unexpected fluctuations, inconsistencies, or hallucinations in outputs to keep the model reliable.
Infrastructure observability
AI applications rely on complex networks of tools, platforms, and services working together. Each of these components can become a point of failure, and because the infrastructure is so interconnected, issues often appear in unexpected places.
For example, a slowdown in cloud storage access might not trigger an immediate failure, but over time, it can increase processing delays and degrade the end-user experience. Infrastructure observability catches these issues early and keeps systems running smoothly.
Key aspects of infrastructure observability include:
- GPU/TPU usage: Observing how much compute power is being used helps identify bottlenecks, prevent wasted capacity, and ensure resources scale with demand.
- API uptime & reliability: AI systems often depend on APIs for data ingestion, authentication, or connecting with external services. Monitoring uptime ensures these links remain stable.
- End-to-end latency: Tracking delays across data prep, inference, and results to ensure the system stays fast enough for the intended use case.
- Edge vs. cloud visibility: Many AI applications run in mixed environments. Some in the cloud, others on edge devices closer to users. Monitoring both provides insights into differences in performance, bandwidth usage, and reliability.
| Layer | What to watch | Key metrics/signals |
| Data observability | Ensures input data is reliable and consistent. | 1. Data drift (distribution shifts) 2. Schema changes (missing/renamed fields) 3. Data quality (missing values, duplicates, outliers, corruption) |
| Model observability | Tracks model behavior and performance in production. | 1. Accuracy & business KPIs 2. Fairness/bias across groups 3. Latency (inference speed) 4. Versioning (which model is live) 5. Efficiency (token cost for LLMs) 6. Consistency (unexpected output changes, hallucinations) |
| Infrastructure observability | Monitors system resources and runtime environment. | 1. GPU/TPU utilization 2. API uptime & reliability 3. End-to-end latency (pipeline delays) 4. Edge vs. cloud performance differences |
Observability across the AI lifecycle
From training to feedback, AI observability needs to be embedded throughout the entire model lifecycle. Each phase brings unique risks and needs tailored monitoring to keep systems reliable and trustworthy.
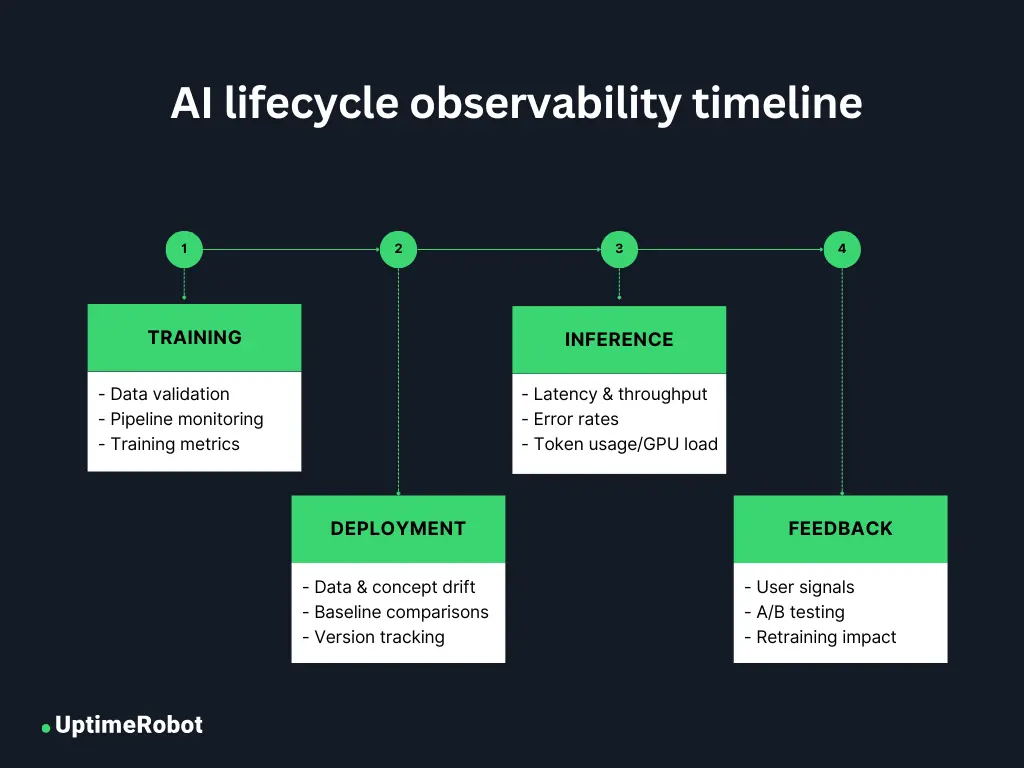
Training phase
Observability starts well before deployment, within the training pipeline. The first step is making sure that your data is AI-ready. Use data validation checks to catch schema mismatches, missing values, and anomalies before they compromise training.
Then use pipeline monitoring to ensure ingestion jobs run on time, feature stores stay fresh, and transformations don’t silently fail.
Finally, monitoring training metrics such as loss curves, convergence, and resource utilization helps detect inefficiencies early, keeping the training process reliable.
Deployment phase
Once your model is in production, observability helps detect unexpected changes that emerge over time. Monitoring for data drift and concept drift keeps the model aligned with real-world inputs.
Continuously evaluate against baselines to catch performance regressions early. Version tracking further ensures that every result can be tied back to the exact model, dataset, and configuration used, providing transparency and reproducibility.
Inference phase
The inference phase is when your model actively serves predictions to users or downstream systems. At this stage, observability focuses on operational performance and user-facing reliability. Track latency to make sure your system meets SLAs, while throughput and error rates reveal whether it can handle production-scale workloads.
For LLMs and other API-based models, monitoring token usage and cost is essential to prevent unexpected spending. Infrastructure metrics such as GPU/TPU utilization and network bottlenecks also play a key role, keeping your system running efficiently under real-world demand.
Feedback phase
The lifecycle doesn’t end once a model is deployed. Feedback from users, such as corrections, flags, or explicit ratings, offers information into where your model may be underperforming.
Observability in this phase means systematically capturing those signals, running A/B tests to compare model versions, and measuring the impact of fine-tuning or retraining. By “closing the loop,” you can make sure your model adapts continuously to evolving user needs and business contexts.
Key metrics to monitor in AI systems
Key performance indicators (KPIs) provide an objective way to measure how well your AI models are performing. They help align AI initiatives with business goals, guide data-driven adjustments, and demonstrate the overall value of an AI project. Below are the most important metrics to track and when they matter most.
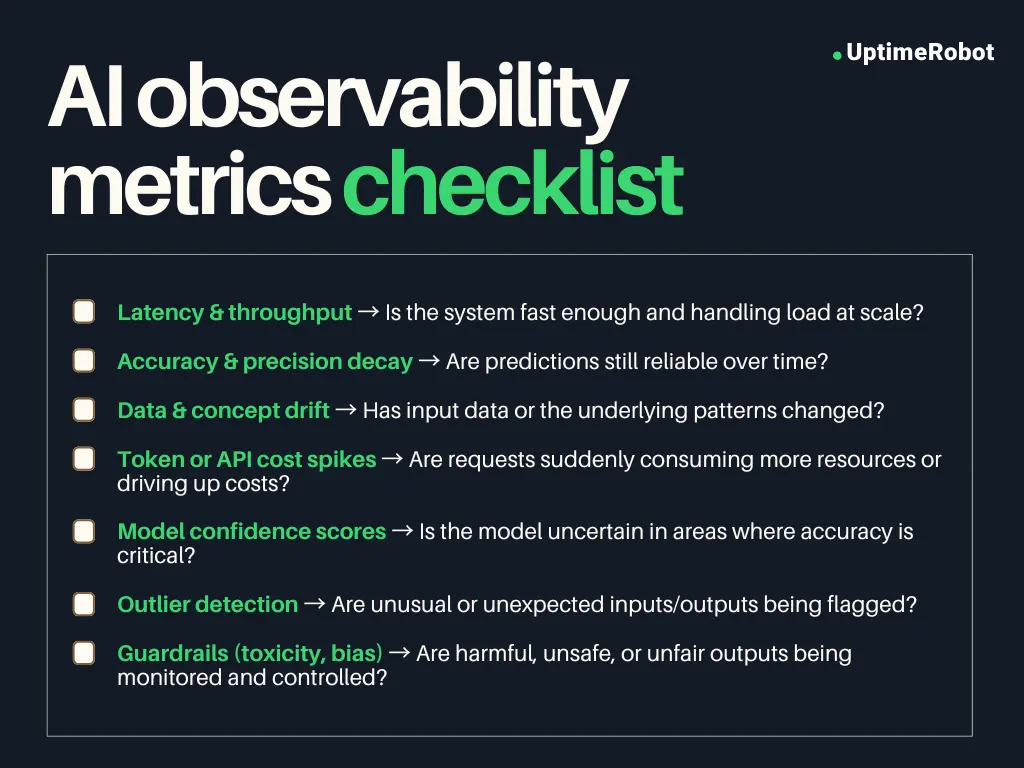
Latency and throughput
Measure how quickly the system responds (latency) and how many requests it can handle at once (throughput). If latency creeps up, it could indicate infrastructure bottlenecks, inefficient code, or overutilized GPUs/TPUs.
Throughput monitoring is especially important at scale, helping teams spot when a model that works fine in testing starts to break down under production traffic.
Accuracy and precision decay
Precision and recall might look good during training, but in production they often decay gradually as user behavior evolves or new patterns emerge. For example, a spam filter trained on last year’s emails may miss today’s phishing tactics.
Tracking these metrics continuously helps teams detect performance regressions early, prompting retraining before the model drifts too far off course. This is especially crucial in mission-critical use cases like medical diagnosis, risk scoring, or safety systems.
Data and concept drift
Drift occurs when either the input data (data drift) or the relationship between inputs and outputs (concept drift) changes. Imagine an e-commerce recommendation model: if user queries change around the holiday season, that’s data drift. If people start valuing sustainability more than price in their buying decisions, that’s concept drift. Both can silently degrade performance.
Drift monitoring is most valuable in fast-changing domains, like finance, supply chains, or online retail, where external forces constantly shift user behavior.
Token or API cost spikes
For large language models (LLMs) and other API-based systems, cost can balloon quickly. Each request consumes tokens or API credits, and poorly designed prompts, abusive traffic, or unexpected workloads can cause sudden cost spikes.
These metrics matter most in cost-sensitive deployments, especially when AI is embedded in customer-facing apps with unpredictable usage patterns. Without observability here, companies risk runaway bills that eat into ROI or make scaling financially unsustainable.
Model confidence scores
Confidence scores reflect how certain a model is about its predictions. They’re vital in high-stakes environments like healthcare, credit decisions, or legal AI tools, where low-confidence outputs should trigger human review.
Monitoring confidence also helps identify “blind spots” where the model consistently struggles, informing data collection and retraining priorities. Overconfidence, on the other hand, can be just as dangerous, masking underlying weaknesses.
Outlier detection
Outliers are inputs or predictions that fall far outside expected patterns. They often signal data corruption, rare edge cases, or even adversarial attacks designed to trick the model.
For instance, a sudden surge of unusual login attempts might be an outlier pattern indicating fraud. Outlier monitoring is most valuable in security-sensitive and safety-critical applications where missing anomalies can have serious consequences.
Guardrails: Toxicity and bias
Beyond performance, AI systems must be monitored for harmful or biased outputs. Toxicity checks help prevent chatbots from generating offensive content, while fairness metrics reveal demographic disparities in outcomes.
These guardrails are essential in LLMs, customer-facing AI, hiring systems, and regulated industries, where trust, compliance, and reputation are on the line. Without them, AI risks causing real harm to users or exposing organizations to legal and ethical backlash.
Common AI failures that observability can prevent
No matter how well you design your AI system, it can still fail in unexpected ways once it’s in production. With observability in place, you can spot issues early, trace their root causes, and stop small glitches from turning into major problems.
Here are some of the most common AI failures that observability can prevent.
- Sudden model degradation after updates: When you roll out a new model version, it may unexpectedly perform worse than the old one due to hidden data shifts, incomplete testing, or overfitting. With observability, you can continuously compare performance against baselines and catch regressions before they impact users.
- Cost overruns due to long prompt completions: If your prompts or queries become too long or inefficient, your LLM or API-based model can silently drive up token usage and costs. Observability lets you monitor token consumption and identify waste early so you can optimize before expenses spiral.
- Bias surfacing in edge cases: Even if your model performs fairly overall, it may still show bias in rare or underrepresented scenarios. Observability helps you analyze outputs across subgroups and edge cases, so you can uncover and fix hidden disparities before they cause harm.
- Unexplained hallucinations or API failures: Large language models can generate false or misleading outputs, while underlying APIs may fail intermittently. With observability, you can detect these anomalies quickly, log the context, and troubleshoot faster to keep your system reliable.
Case study: When observability could have saved the day

In 2024, Air Canada faced a customer dispute that shows exactly why AI observability matters.
Here’s what happened: A passenger relied on Air Canada’s chatbot for information about bereavement fares. The chatbot confidently told him he could apply for the discount after travel within 90 days of purchase. In reality, Air Canada’s official policy required bereavement fares to be requested before travel.
When the passenger’s request was later denied, he filed a case against the airline. Air Canada argued that the chatbot was a separate entity and therefore not their responsibility. The tribunal disagreed. It ruled that the chatbot was part of Air Canada’s service and that the misleading information amounted to negligent misrepresentation. In the end, Air Canada was held liable.
This incident highlights a critical gap: a lack of observability over chatbot responses. If Air Canada had put observability practices in place, the error could have been caught before it harmed a customer and escalated into a legal case.
For example:
- Content accuracy monitoring could have flagged the inconsistency between the chatbot’s advice and the official policy page.
- Drift detection could have caught that the chatbot’s answers diverged from historical or expected responses.
- User feedback alerts (“Did this answer help?”) could have quickly surfaced the issue through negative responses.
- Audit logs and traceability would have made it easier to track, review, and correct the faulty response.
In short, better observability could have prevented a reputational and legal setback for Air Canada.
Best practices for implementing AI observability
You already understand the why. Now let’s focus on the how. Below are best practices you can follow to build AI systems that are reliable, efficient, and trustworthy.
Establish baselines and alert thresholds
Define what “normal” looks like for each key metric: model accuracy, latency, or token usage. Once baselines are set, establish alert thresholds so your team can detect anomalies early, before they impact users.
Use distributed tracing and logging with context
Observability is most effective when you can trace a request end-to-end. Capture logs at every stage, from preprocessing to inference to post-processing, along with critical context such as request type, model version, or user ID. This makes debugging faster, easier, and far more precise.
Add explainability layers for internal teams
Metrics show what happened, but not why. Adding explainability tools gives engineers and business stakeholders clarity into how models make decisions. This improves troubleshooting and supports compliance, audits, and user trust.
Track both technical metrics and ethical ones
Don’t just monitor accuracy and latency. Observability should also include fairness, bias, and toxicity metrics. Monitoring these ethical dimensions makes AI systems responsible and aligned with organizational values and regulatory requirements.
Leverage uptime monitoring for critical endpoints
For production AI systems, especially LLMs or APIs serving external users, uptime is crucial. Implement automated health checks, alerts, and redundancy strategies to have endpoints available and performant under all conditions.
How to operationalize AI observability in production
AI observability becomes useful when it has owners and a repeatable workflow. A dashboard alone will not catch the failures that matter most, especially when the output sounds correct but is still wrong.
Start by tracing each production request from input to final output. Capture the prompt, retrieved context, tool calls, model version, latency, token usage, and user feedback in one place. That gives your team enough context to debug behavior, not just uptime or response time.
Then split signals into two paths. Use automated alerts for fast-moving issues like downtime, latency spikes, token cost jumps, and broken pipelines. Use scheduled review for slower issues like hallucinations, weak retrieval, prompt regressions, and biased outputs that need human judgment.
When you find a bad trace, do not stop at triage. Label the failure type, write down what the correct result should have been, and add that example to an evaluation set. This turns one production issue into a reusable test that can catch the same problem before the next release.
It also helps to assign ownership early. Engineers should own traces, alerts, and rollback paths. Data and ML teams should own drift, evaluation quality, and retraining decisions. Product or domain teams should review whether the output was actually useful, safe, and aligned with the task.
The goal is a closed loop: trace, review, evaluate, improve, deploy, and monitor again. That is when AI observability stops being a reporting layer and starts improving system reliability.
Best AI observability tools
Here are some of the best AI observability tools you can explore.
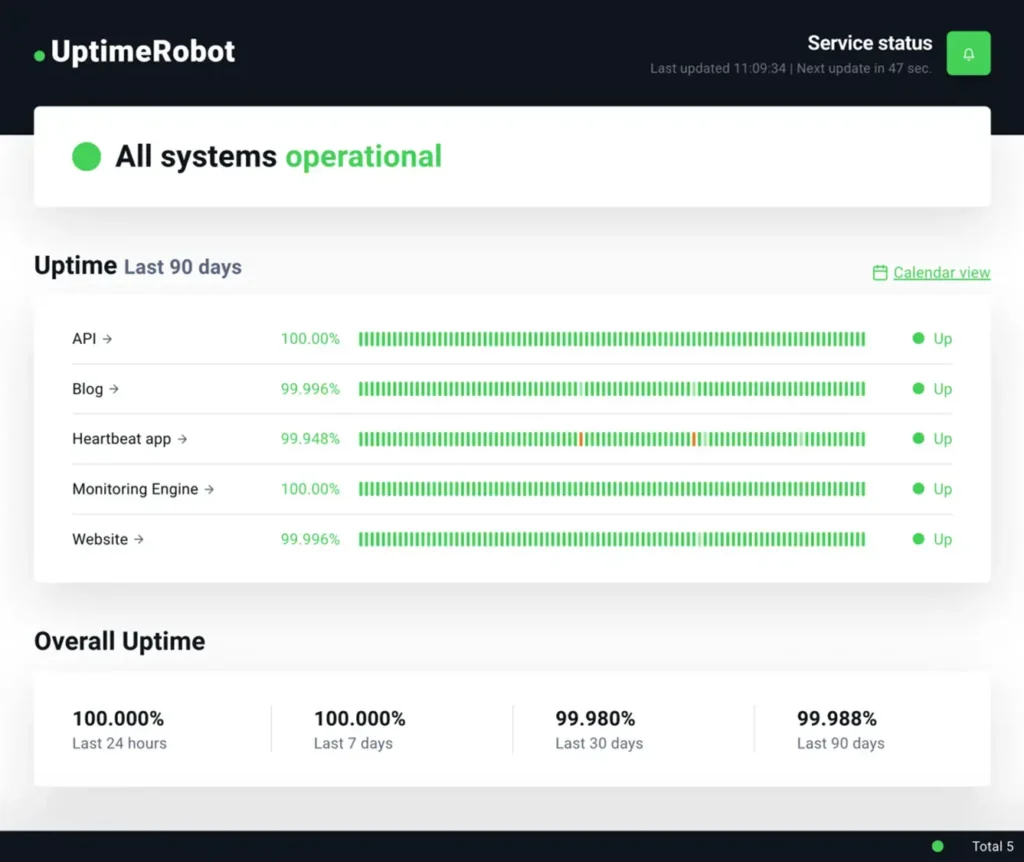
UptimeRobot
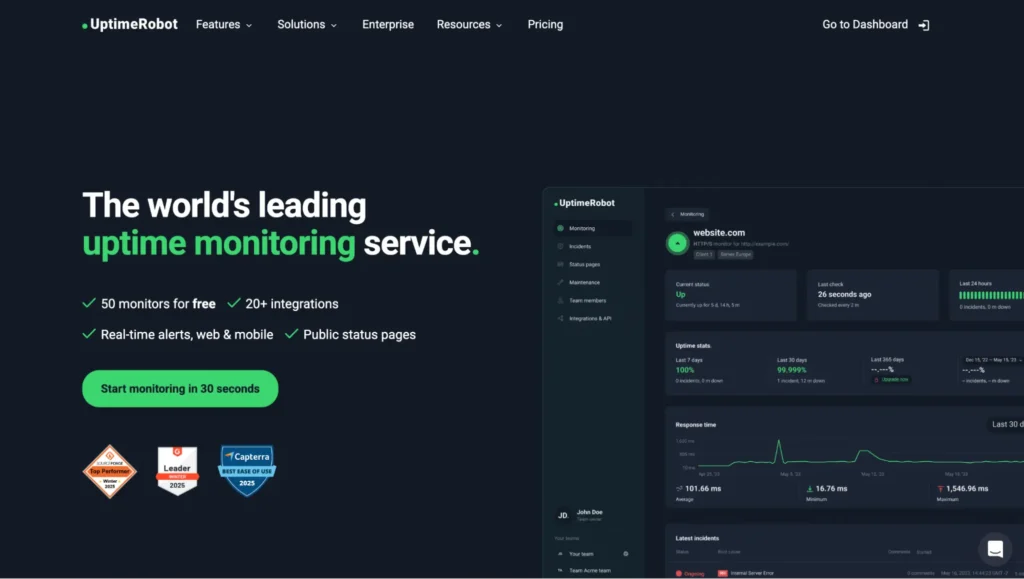
UptimeRobot is a widely used, user-friendly tool designed to monitor the uptime and performance of websites, APIs, servers, and endpoints. It runs checks from multiple global locations to track availability and response times, instantly alerting your team via email, Slack, or SMS when downtime or performance issues occur.
While not built exclusively for AI, UptimeRobot integrates with observability platforms like Grafana, making it a reliable foundation for monitoring any critical digital infrastructure.
Dynatrace
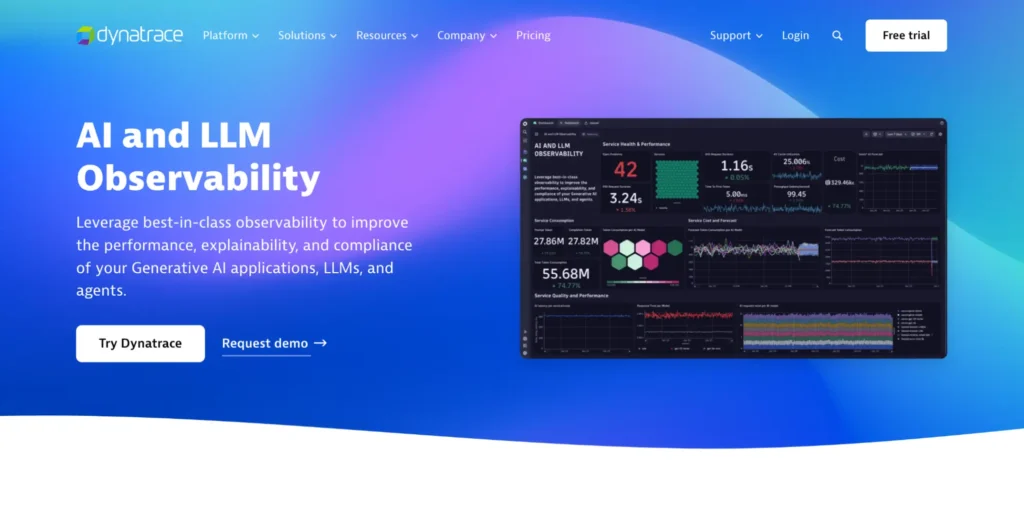
Dynatrace provides intelligent, full-stack AI observability by collecting metrics, logs, and traces across cloud-native environments, including AI model pipelines. Its Davis AI engine automates root-cause analysis and anomaly detection, visualizing dependencies and performance issues in real time to ensure uptime, reliability, and regulatory compliance at scale.
Coralogix
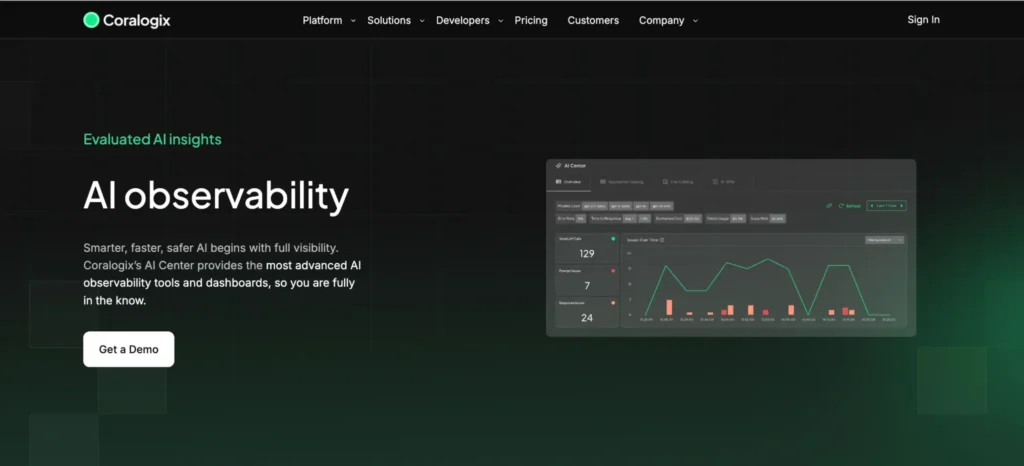
Coralogix delivers real-time observability and security for AI systems via its AI Center, specializing in full-stack performance monitoring, anomaly detection, cost tracking, and risk assessment.
It offers custom evaluators for AI-specific use cases, monitors user interactions, and provides dashboards to proactively detect malicious activity and optimize resource consumption.
Censius
Censius is an AI observability solution offering monitoring, explainability, and analytics for machine learning models and data pipelines.
It provides automated drift, bias, and outlier detection, sends real-time alerts for performance violations, and guides users through root cause investigation, all integrated into familiar MLOps workflows.
New Relic
New Relic’s AI observability platform, powered by its Intelligent Observability Engine, uses advanced AI, including agentic and compound models, to deliver smarter monitoring and faster problem resolution across complex environments.
Key features include Transaction 360 for business event tracing, Engagement Intelligence for user analytics, and digital experience monitoring across devices and regions.
Arize
Arize AI facilitates advanced ML observability by collecting and indexing model performance data across training, validation, and production environments.
It features automated monitoring, root cause tracing, drift detection, and granular analysis tools to help teams continuously improve, debug, and optimize AI model outcomes in real world settings.
Fiddler AI
Fiddler is an AI observability platform focused on model performance monitoring, explainability, and root cause analysis across both machine learning and large language model applications.
It offers real-time drift detection, feature importance explanations, and lifecycle management from model development to deployment, helping teams quickly address degraded performance and comply with regulations.
AI observability tools comparison
| Tool | Key features | Best for |
| UptimeRobot | Uptime and latency checks, endpoint/API monitoring, instant alerts, Grafana integration | Infrastructure uptime (APIs, servers, model endpoints) |
| Dynatrace | Full-stack observability, distributed tracing, AI-powered root-cause analysis | Full-stack monitoring (apps + infra + AI workloads) |
| Coralogix | Real-time log analytics, anomaly detection, pattern recognition | Infrastructure + pipelines (log-heavy environments) |
| Censius | Model performance tracking, fairness & drift monitoring, compliance tools | Model observability (responsible AI, compliance) |
| New Relic | Intelligent Observability Engine, Transaction 360 tracing, Engagement Intelligence, digital experience monitoring | Full-stack + business linkage (infra + user experience + AI) |
| Arize | Data drift detection, bias monitoring, embedding visualizations, LLM support | Model + LLM monitoring (GenAI, embeddings, drift) |
| Fiddler AI | Model explainability, fairness auditing, bias detection, root-cause analysis | Responsible AI (explainability, transparency, audits) |
How UptimeRobot supports AI observability
AI systems rely on a web of APIs, model endpoints, and services that must remain available around the clock. If an endpoint goes down or even slows unexpectedly, user trust erodes quickly. UptimeRobot extends its proven website and API monitoring capabilities into the AI space, giving teams the visibility they need to keep production AI reliable.
Here’s how it supports observability for modern AI workloads:
- 24/7 monitoring of AI endpoints and APIs
UptimeRobot continuously checks model endpoints, whether REST, GraphQL, or custom APIs, from multiple global locations.
- Instant alerts for failed inferences or latency spikes
UptimeRobot detects slow responses, timeouts, or failures in real time and instantly alerts your team via Slack, email, SMS, or webhooks.
- Synthetic monitoring for AI interfaces
UptimeRobot simulates user interaction to verify that AI-driven interfaces work correctly end-to-end.
- Integration with broader observability stacks
UptimeRobot integrates with Grafana, Slack, and custom Webhooks to combine AI-specific monitoring with your existing observability dashboards.
- Ensuring reliability for GenAI and ML apps
UptimeRobot keeps LLM APIs, recommendation engines, and other AI services available and responsive under real-world demand.
If your AI application fails silently, your users won’t wait. Use UptimeRobot to catch latency spikes, API downtime, and model instability in real time.
AI observability in 2026 and beyond
Here’s a glimpse into what’s shaping the future of AI observability.
Multi-agent systems and LLM chains
AI systems are becoming increasingly complex, involving multiple autonomous agents or components that are chained together (e.g., multi-step LLM workflows). Without observability, tracking failures or unexpected behaviors across agents becomes nearly impossible.
Researchers warn that traditional benchmarking will not suffice. Multi-agent environments require end-to-end logging, tracing, and anomaly detection frameworks that can trace entire workflows, not just individual components
Increasing regulation
Governments are moving quickly to regulate AI, especially higher-risk systems. The European AI Act, which took effect on August 1st, 2024, is the world’s first comprehensive legal framework for artificial intelligence. It sets strict requirements for high-risk systems, including transparency, continuous monitoring, human oversight, and detailed record-keeping.
In the coming years, AI observability will become not only an operational best practice, but also a legal necessity for every organization.
Autonomous systems and safety monitoring
Autonomous systems such as self-driving cars, drones, and industrial robots are growing rapidly. These systems operate with little human oversight, so they demand strong safety monitoring.
Teams must apply continuous, real-time observability to detect anomalies, prevent accidents, and ensure transparency and accountability in AI-driven decisions.
Final thoughts
The latest BARC study shows that mature AI initiatives rely on strong governance, with observability as the operational foundation. More than two-thirds of organizations have formalized observability for data, pipelines, and models, focusing on privacy, auditability, and accuracy.
The message is clear: AI maturity depends on observability. The future of AI will require monitoring that covers all data types, every stage of the lifecycle, and all layers of infrastructure. Organizations that treat observability as a strategic discipline will be the ones that deliver AI that is transparent, reliable, and trusted.
FAQ
-
AI observability is the practice of monitoring, analyzing, and understanding the behavior, performance, and decision-making of AI systems throughout their lifecycle. It works by continuously tracking data quality, model outputs, and infrastructure metrics.
This provides actionable insights and enables faster detection and resolution of issues such as bias, drift, or performance degradation.
-
Observability is important because AI models can fail silently and unpredictably in ways traditional software monitoring cannot detect. Unlike conventional programs that crash with clear errors, ML models may degrade gradually, produce confidently wrong predictions, or exhibit unexpected biases without obvious signs.
Observability provides the visibility needed to detect these subtle failures, understand model behavior, and maintain reliable, fair, and trustworthy AI in production.
-
Key metrics include:
- Data quality (drift, anomalies)
- Model performance (accuracy, precision, recall, F1 score)
- System health (latency, error rates, throughput)
- Infrastructure usage (CPU/GPU/memory)
- Security (data leakage, prompt injections)
- Explainability (feature importance)
- User feedback.
-
Yes. UptimeRobot can track the availability and response times of AI APIs and endpoints, helping ensure systems stay online and performant. While it doesn’t monitor model-specific metrics like accuracy or drift, it’s useful for operational observability and alerting on downtime or latency issues.
-
Traditional monitoring focuses on uptime, latency, and errors, while AI observability goes further to track model performance, data quality, drift, fairness, and output behavior.
-
AI observability can detect sudden model performance drops, data or concept drift, biased or unfair predictions, hallucinations or incorrect outputs, and infrastructure issues such as latency spikes or downtime.
-
Data drift occurs when the input data distribution changes over time, potentially making a model’s predictions less reliable.
Concept drift happens when the relationship between inputs and outputs changes, so the model’s learned patterns no longer hold.
-
Yes. Platforms like Weights & Biases, Arize AI, Fiddler AI, and Datadog with AI monitoring integrations provide unified observability, tracking both model performance, drift, and fairness as well as infrastructure metrics like latency, uptime, and resource usage.