AI agents do not fail like normal apps. They can return a plausible answer while using the wrong tool, burning tokens in a loop, missing a guardrail, or taking too long to finish a task.
By the time a user notices, the problem is often buried across prompts, model output, tool calls, and orchestration logs.
Good monitoring makes those failure patterns visible.
This guide shows you how to keep agents reliable in 2026 and breaks down the signals that matter, from latency and error rates to tool success, cost, and task completion, then maps them to practical monitoring habits and tool choices.
The goal is simple: catch bad agent behavior early, troubleshoot faster, and keep automation useful when real traffic hits.

Key takeaways
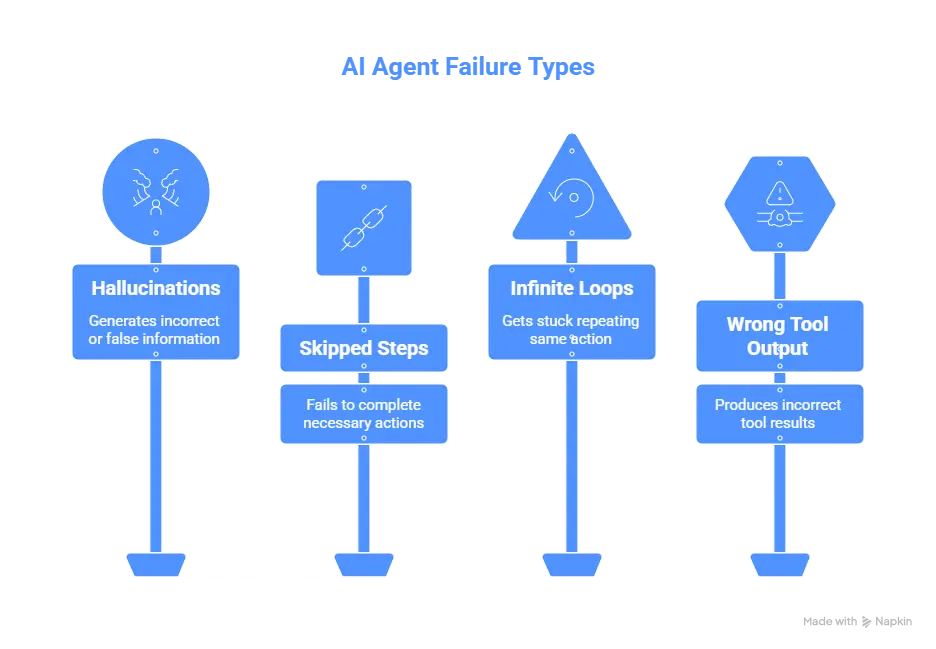
- AI agents fail in subtle ways (hallucinations, skipped steps, context errors) that traditional uptime monitoring won’t catch.
- A strong setup tracks system health (availability, latency, dependencies) and agent behavior (accuracy, drift, cost).
- Log prompts, responses, and tool calls so you can replay failures and spot regressions.
- Add monitoring to CI/CD pipelines to catch drift or broken prompts before production.
- Use alerting integrations (Slack, PagerDuty) to respond quickly when things go off track.
- Expect the future of monitoring to lean on decision-path tracing, AI-native observability pipelines, and built-in governance features.
- Tools like UptimeRobot make this practical with endpoint, keyword, port, and cron job monitoring.
Why AI agent monitoring matters
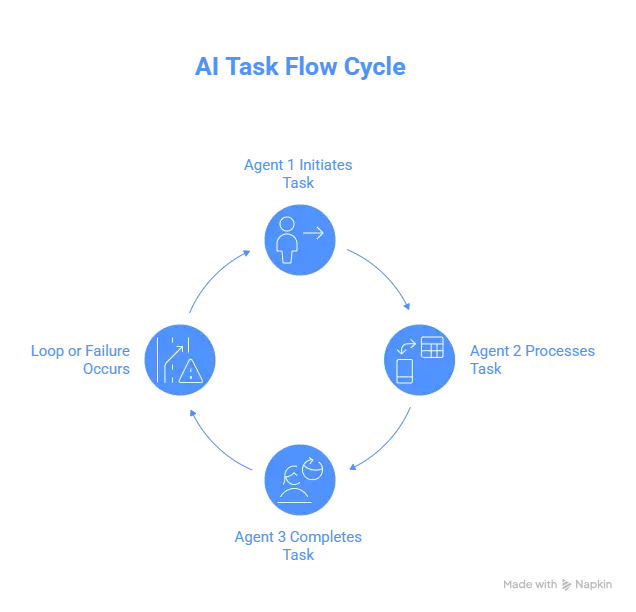
AI agents are now running live, business-critical workflows like answering customer questions, triaging incidents, and coordinating with other systems. When they fail, they can misroute tickets, skip steps, or loop endlessly, causing silent failures that only show up when users complain.
Traditional monitoring tools track uptime, not behavior. They’ll tell you a server is online, not that your chatbot gave a biased answer or your scheduler sent a team to the wrong time zone.
Monitoring AI agents gives teams visibility into:
- Trust: Catch hallucinations or off-brand responses before they erode user confidence.
- Continuity: Detect loops, missed handoffs, and hidden workflow failures.
Cost control: Spot runaway API calls or token usage before bills explode. - Compliance: Flag unsafe or policy-breaking outputs early.
Done right, agent monitoring protects reliability, safety, and budget, along with giving you a chance to fix issues before they become a customer problem. For teams formalizing agent practices in 2026, an AI agents certification can be a useful way to standardize monitoring, testing, and governance concepts across engineering and ops.
Knowing why this type of monitoring is so important is one thing, but what exactly does it entail?
What is AI agent monitoring?
AI agent monitoring tracks whether autonomous systems are working, rather than just not running. It’s about watching performance, behavior, and reliability so you know if agents are completing tasks, staying on policy, and doing it cost effectively.
The goal is to make sure agents:
- Stay reliable: No stalling, looping, or dropping tasks.
- Stay safe: Produce accurate, brand-safe, and compliant outputs.
- Stay efficient: Keep token usage, API calls, and compute costs under control.
How it differs from general AI monitoring
AI monitoring often stops at the model: accuracy, drift, fairness, and bias. Agent monitoring goes further; it looks at how those models behave in real workflows.
Instead of only tracking model accuracy, you’re also watching:
- Tool calls and API results
- Multi-agent handoffs and decision chains
- Real user outcomes
Think of it as monitoring the system in action, not just the engine under the hood.
Common use cases
- Customer support agents that answer queries and route tickets.
- Autonomous decision-making workflows that trigger actions like scheduling meetings or deploying infrastructure.
- LLM-powered pipelines that generate content, analyze documents, or summarize information at scale.
Monitoring gives teams a clear view of whether they’re producing safe, reliable results without driving up costs. However, like with most aspects of monitoring, there are challenges as well.
Key challenges in monitoring AI agents
Monitoring AI agents comes with a tougher set of problems than traditional applications or APIs. Agents operate autonomously, make probabilistic decisions, and interact with unpredictable environments. That means observability can’t stop at “is it up?”, you need to monitor how it behaves.
Here are some of the hardest challenges and what to watch for:
Behavior is non-deterministic
A traditional server returns the same response to the same request. Not so with agents. They can produce wildly different outputs for the same input depending on context, recent training updates, or even randomness.
That variability makes it harder to define what “normal behavior” is or detect degraded output.
Tip: Use reference prompts or synthetic test suites lined up with expected behavior ranges as anchors.
Multi-agent workflows, loops, & handoffs
When multiple agents (or subcomponents) collaborate, things get messy fast. One agent might summarize, another analyze, another act. If one misbehaves, stalls, or loops, errors cascade.
- Catching infinite loops, circular handoffs, or stalled agents is nontrivial
- Identifying which agent or step failed (root cause) can be opaque
- Visibility must span the full decision chain, not just isolated modules
Evaluation complexity: Intent accuracy, hallucination detection, tool reliability
Traditional error codes can’t tell you whether an agent answered the right question or produced useful output. AI monitoring requires evaluating the quality of responses, something that isn’t always straightforward.
Common complexities include:
- Intent accuracy: Did the agent understand what the user wanted?
- Hallucination detection: Is the output factually correct, or did the model “make something up”?
- Tool reliability: Did external API calls, databases, or calculators return the expected results?
Teams often use synthetic tests, quality benchmarks, or human-in-the-loop reviews to measure these dimensions. Without them, behavioral failures slip through even when systems look “healthy.”
Framework fragmentation: LangChain, CrewAI, OpenAI Agents SDK, Bedrock, etc.
The AI agent space is still in flux. LangChain, CrewAI, OpenAI’s Agent SDK, Bedrock – each has its own abstractions and logging style.
- Metrics & logs vary wildly across frameworks, making consolidation hard
- Some frameworks have built-in tracing; others require custom hooks
- Switching or mixing frameworks mid-project complicates observability pipelines
To survive this, you need a mostly framework-agnostic observability layer (like with OpenTelemetry) and disciplined, portable instrumentation practices.
Together, these challenges show why monitoring AI agents requires new approaches that go well beyond traditional observability.
Core components of an AI agent monitoring strategy
Monitoring AI agents goes far beyond checking if an API is online. These systems interact with dynamic environments, external tools, and end users, meaning failures can be subtle, behavioral, and costly.
A strong monitoring strategy should track system health, performance, and behavior in near real time.
1. Instrumentation and observability layers
The foundation of monitoring is good data. Without structured logs and traces, everything else is guesswork.
- Use open standards: Adopt OpenTelemetry for metrics, logs, and traces so your data stays portable across tools like Datadog, Grafana, and Langfuse.
- Tag agent-specific context: Include metadata like model version, token count, and tool used to make debugging easier.
- Trace multi-agent workflows: Capture every handoff, retry, and branch to visualize where failures originate.
With this groundwork, you can unify data from multiple frameworks (LangChain, CrewAI, custom SDKs) in a single dashboard.
2. Logs and traces
Logs and traces turn agent behavior from a black box into something you can analyze.
- Capture input/output logs: Store prompts, responses, timestamps, and user/session IDs.
- Replay interactions: Use logged data to reproduce and debug past failures.
- Detect loops or stalls: Flag repetitive behavior before it spirals into runaway costs or broken workflows.
3. Key metrics and signals to track
Technical uptime isn’t enough, you need metrics that reflect whether agents are actually working as intended.
| Metric / Signal | Why It Matters | Example Trigger |
| Latency & response time | Keeps user experience smooth for chatbots, voice assistants, and real-time workflows. | Average response time spikes from 1.2s to 4s after a model update. |
| Prompt success rate | Shows how often the agent produces a usable result for a given class of requests. | Success rate drops below 85% for “billing” prompts. |
| Output quality & intent accuracy | Ensures the agent both understands the request and produces correct, complete answers. | High volume of “I didn’t ask for that” feedback or flagged irrelevant responses. |
| Compliance & safety checks | Prevents brand, legal, or regulatory issues. | Model outputs PII or off-policy language — flagged by automated filters. |
| Drift detection | Catches behavior changes after retraining or fine-tuning. | Response sentiment or format shifts noticeably compared to baseline. |
| Cost efficiency | Keeps token usage and compute spend under control. | Cost per successful output jumps 30% in a single week. |
| Error rates & tool reliability | Identifies broken external integrations or malformed outputs. | Spike in API call failures from a key dependency. |
4. Safety and compliance checks
Agents must not only work, they must stay on-policy.
- Content safety filters: Block biased, unsafe, or non-compliant outputs.
- Compliance tagging: Add GDPR, HIPAA, or internal policy checks where needed.
- Audit trails: Keep a record of decisions for governance and accountability.
When combined, these components create a full feedback loop: you collect data, detect issues early, and continuously improve both the agents and the workflows they power.

Best practices for AI agent monitoring
Monitoring AI agents isn’t just about what you track, it’s how you design the system around those checks. The following best practices help teams build monitoring strategies that are scalable, portable, and trustworthy.
Start with observability-by-design
Don’t bolt on monitoring after deployment. Instrument agents from the start so every action, handoff, and output is visible. This avoids blind spots and makes debugging far easier once agents are live.
Adopt open standards
Relying on proprietary formats locks you into a single stack. Use OpenTelemetry for traces and metrics so observability is portable across tools like Datadog, Grafana, or Langfuse. Semantic conventions also ensure consistent labeling of agent-specific spans.
Automate evaluation in CI/CD pipelines
AI agents change behavior with every model update or prompt tweak. Add automated evaluation tests to your CI/CD pipeline: run fixed prompts, compare outputs to baselines, and halt deployments if too many responses drift.
Set SLAs for AI agents
Just like infrastructure, agents need service-level agreements. Define thresholds for:
- Latency (response times for user-facing queries)
- Accuracy (correct responses for known cases)
- Reliability (consistency of outputs across sessions)
Clear SLAs help teams balance cost, performance, and user trust.
Establish governance links
Monitoring should also connect to compliance and safety goals. Add checks for:
- Biased or unsafe outputs
- Regulatory compliance (GDPR, industry-specific rules, etc.)
- Ethical guidelines or brand tone
When governance is part of monitoring, agents stay aligned with safety rules and company standards.
AI agent monitoring tools & ecosystem
The ecosystem of AI agent monitoring tools is evolving fast. Unlike traditional observability stacks, these platforms are designed to track and analyze complex autonomous behaviors from multi-agent decision paths to real-time safety and performance metrics.
Datadog – LLM observability & decision-path mapping
Datadog extends its monitoring suite to AI agents with LLM Observability, giving teams visibility into decision paths, tool usage, and performance bottlenecks. It’s a strong choice for companies already using Datadog for infrastructure monitoring.
Key features:
- Trace full agent workflows, including multi-agent handoffs and loops
- Correlate latency, errors, and cost metrics in one view
- Run “experiments” to compare prompts or models against real production traces
OpenTelemetry – Open standard for tracing & logs
OpenTelemetry provides a vendor-neutral framework for collecting logs, metrics, and traces from AI systems. It helps standardize observability across different frameworks, ensuring data portability and consistent instrumentation.
Key features:
- Works across multiple platforms and tools (LangChain, CrewAI, custom SDKs)
- Supports semantic conventions tailored to AI workflows
- Compatible with existing observability stacks like Grafana or Datadog
Azure AI Foundry (Agent Factory) – Evaluation & safety frameworks
Azure’s AI Foundry (sometimes called Agent Factory) focuses on reliability and governance, offering observability alongside built-in evaluation and compliance checks. It’s designed for enterprises that need AI monitoring to tie directly into safety and regulatory workflows.
Key features:
- Live evaluation of agents against test scenarios
- Integrated safety checks and governance controls
- CI/CD integration for automated regression testing
Other notable tools
Langfuse – Open-source observability built for LLM-based systems.
- Capture and replay prompt-response pairs for debugging
- Tag responses for quality review (helpful, irrelevant, hallucinated)
- Strong option for self-hosting and flexibility
Arize AI – Monitoring focused on model drift and embeddings.
- Detect changes in input/output distributions
- Track embedding performance for retrieval-based agents
- Useful for long-term reliability and performance analysis
How to choose the right tool for your stack
- Already on Datadog? LLM Observability adds agent-focused tracing without changing platforms.
- Need standardization? OpenTelemetry ensures observability data is portable across stacks.
- Enterprise + compliance needs? Azure AI Foundry combines monitoring with governance.
- Want flexible or open-source? Langfuse is great for debugging and control.
- Concerned about drift? Arize AI specializes in detecting subtle performance shifts.
| Tool / Platform | Why it’s useful for AI agent monitoring | Notable features |
| Datadog (LLM Observability) | Extends Datadog’s monitoring to AI agents, with visibility into workflows and decision paths | • Trace multi-agent workflows and loops • Correlate latency, errors, and costs • Test prompts/models with production data |
| OpenTelemetry | Provides an open standard for tracing/logging, ensuring observability is portable across stacks | • Vendor-neutral instrumentation • Semantic conventions for AI workflows • Works with Grafana, Datadog, and others |
| Azure AI Foundry (Agent Factory) | Enterprise-focused observability with built-in evaluation and governance | • Live evaluation of agent behavior • Safety and compliance checks • CI/CD pipeline integration |
| Langfuse | Open-source observability built for LLM systems, ideal for debugging and flexibility | • Capture/replay prompt-response pairs • Tag responses for quality review • Self-hosted or cloud options |
| Arize AI | Specializes in model drift detection and embedding performance tracking | • Monitor input/output drift • Embedding performance analytics • Scales for production monitoring |
Integrating AI agent monitoring into MLOps & CI/CD
As AI agents become more embedded in user-facing products and internal workflows, integrating their monitoring into MLOps (Machine Learning Operations) and CI/CD (Continuous Integration/Continuous Deployment) pipelines is essential to maintain trust, performance, and compliance.
Let’s have a look at how to embed AI agent monitoring into your existing workflows, what to track, and how to act on what you find.
Embed monitoring into your CI/CD pipeline
AI agents often rely on models that evolve over time. That means every deployment can change behavior, even if the infrastructure stays the same.
To catch regressions early:
- Automate behavioral tests: Run a fixed set of prompts through the agent during the CI phase and compare outputs to a known-good baseline.
- Use canary deployments: Route a small percentage of traffic to the new model version and monitor for anomalies before full rollout.
- Log version context: Always tag logs and metrics with model version, dataset hash, and config parameters so you can trace issues back to specific changes.
For example, in a CI/CD pipeline using GitHub Actions and Kubernetes, you can trigger a test suite that sends 50 predefined prompts to the AI agent after each build. If more than 5% of responses differ from the baseline, the deployment halts.
Connect alerts to your incident workflow
Monitoring is only useful if someone sees the alerts and can act on them. Integrate AI agent alerts into your existing incident response stack.
Options include:
- Slack or Microsoft Teams: For real-time alerts to your engineering or ML channel.
- PagerDuty or Splunk On-Call: For on-call escalation if the agent is mission-critical.
- Public status pages: If your AI agent is customer-facing, use a public status page to communicate outages or degraded performance.
It’s not just about failures; alerts should also flag unusual patterns:
- Cost anomalies: Spikes in token usage or unexpected API spend.
- Behavior drift: Loops, unusually short/long responses, or sudden drops in tool success rates.
For instance, a voice assistant used in customer service might fail silently if the speech-to-text model degrades. A keyword monitor could catch the spike in “I didn’t understand that” responses, while a cost monitor might flag runaway token usage.
Together, these alerts keep both performance and budget under control.
Dashboards for DevOps + AI engineers
Alerts handle immediate issues, but teams also need a way to spot trends and collaborate on long-term improvements. Dashboards bring monitoring data into one place, making it easier to see both technical performance and business impact.
What to include:
- System health metrics: Latency, error rates, uptime for agent APIs and dependencies
- Behavioral indicators: Prompt success rates, drift signals, safety check results
- Cost tracking: Token usage, average cost per request, daily spend compared to budget
- User feedback loops: Low-rated responses or flagged interactions
Dashboards that blend infrastructure metrics with agent behavior give DevOps and AI engineers a single place to work from. When both teams see the same data on reliability, costs, and output quality, it’s easier to coordinate fixes and avoid gaps or duplicated effort.
Bringing monitoring into MLOps and CI/CD isn’t just about preventing failures. It weaves observability into the entire lifecycle, so teams can roll out updates with more confidence, catch problems earlier, and keep user trust intact.
How to turn production failures into better agent monitoring
Good AI agent monitoring does not stop at detection. When an agent loops, calls the wrong tool, or returns a polished but wrong answer, that failure should become a reusable test case.
Start by saving the full run context. Keep the prompt, retrieved context, tool calls, intermediate steps, final output, latency, token usage, and model version. That gives you one trace you can inspect now and replay later. Without that context, teams end up fixing symptoms instead of the actual failure path.
Then label the issue by failure type. Was it a bad tool call, a weak retrieval result, a routing mistake, a safety problem, or a prompt regression? A short failure taxonomy makes alerting cleaner and helps teams spot repeat patterns faster. It also gives you something stable to track over time, even when models or prompts change.
The next step is where most teams fall short: turn that incident into an eval. Add the failed interaction to your regression suite, define what a good result looks like, and run it in CI/CD before the next release. If the same issue appears twice in production without becoming a test, your monitoring stack is collecting data but not improving reliability.
It also helps to track coverage, not just incidents. Ask how many active failure modes are already covered by tests, alerts, and dashboards. If a known problem class has no eval or no alert, that gap matters more than another generic latency chart.
This closes the loop. Production traces show what broke, labels show why, evals stop the same issue from coming back, and coverage shows what is still missing. That is how agent monitoring shifts from passive visibility to a system that keeps getting better.
Future of AI agent monitoring
AI agents are evolving quickly, moving from scripted workflows to systems that adapt, collaborate, and make higher-stakes decisions. Monitoring will need to keep pace. The next wave of observability goes beyond uptime and latency to include reasoning, governance, and automation built into the monitoring process itself.
AI-native observability pipelines
Traditional monitoring stacks weren’t built for non-deterministic systems. The future lies in AI-native observability pipelines: monitoring layers that ingest prompts, decisions, tool calls, and outputs as first-class signals. Instead of treating agent logs like generic text, pipelines will model them as structured events, enabling:
- Real-time visualization of decision trees and multi-agent workflows
- Built-in drift detection across models, prompts, and contexts
- Cost-aware monitoring that ties usage directly to business metrics
Automated root cause analysis with AI copilots
As agents grow more complex, pinpointing why something failed will be harder for humans alone. Expect monitoring platforms to ship with AI copilots that:
- Trace error chains across multiple agents and external dependencies
- Suggest likely causes (broken API schema, prompt regression, model drift)
- Recommend fixes or rollbacks in real time
These copilots won’t replace human operators, but they’ll cut investigation time dramatically and allow teams to focus on higher-level governance.
Ethical AI and regulatory alignment
Regulators are moving quickly to address the risks of autonomous AI. Monitoring will play a central role in proving compliance and building trust. Future-ready monitoring will include:
- Bias and fairness checks baked into evaluation loops
- Audit trails of agent decisions for accountability
- Configurable compliance modules aligned with frameworks like the EU AI Act or sector-specific rules
Future monitoring systems will treat governance as a built-in feature, giving organizations confidence that agents remain trustworthy as rules and risks change.
Conclusion
AI agent monitoring is still taking shape, but the foundations are already clear:
- Instrument early so every action and decision is visible from the start.
- Track meaningful metrics and evaluations that capture both technical health and agent behavior.
- Integrate visualization and monitoring into CI/CD so issues surface before they reach production.
- Link monitoring with governance and safety to keep systems reliable, fair, and compliant.
Done properly, monitoring turns AI agents from black boxes into accountable systems you can trust at scale.
UptimeRobot helps teams put these practices into action. From API and cron job monitoring to status pages and alerting, it offers an easy, affordable way to add visibility and reliability to any AI-powered workflow.
FAQ
-
AI agent monitoring is the practice of tracking how autonomous AI systems perform in production. It looks at both system health (latency, uptime, errors) and behavior (output quality, decision accuracy, drift). The goal is to make sure agents remain reliable, safe, and cost-efficient as they interact with users and other systems.
-
Traditional application monitoring checks availability and performance, things like CPU, memory, and HTTP status codes. AI monitoring goes further. Because agents can produce different outputs for the same input, you also need to track things like hallucinations, prompt effectiveness, and tool success rates. It’s about whether the system is behaving as expected, not just whether it’s online.
-
Key metrics include:
- Latency – response time from input to output
- Error rates – empty responses, malformed outputs, API failures
- Token usage and cost – how efficiently the model is operating
- Output quality – accuracy, compliance, or alignment with guidelines
- Drift signals – changes in behavior compared to baselines
- Latency – response time from input to output