Better Stack combines uptime monitoring, log management, incident response, and status pages in one platform.
For many teams, that all-in-one approach works well. But others start looking for alternatives when pricing rises, observability features go unused, or they simply want a more focused uptime monitoring tool.
We’ll compare the most practical Better Stack alternatives for different use cases. Rather than just listing similar tools, we’ll look at how each one handles uptime monitoring, alerting, observability, pricing, and setup complexity so you can choose the right fit for your team.
Key takeaways
- Better Stack combines monitoring, logs, incident workflows, and status pages in one platform.
- Some teams want Better Stack alternatives because pricing becomes harder to predict, certain features go unused, or they need a different level of monitoring.
- Many alternatives focus on simpler uptime monitoring and more predictable pricing.
- The right choice depends on your team size, monitoring needs, and operational workflow.
How to choose a Better Stack alternative
Before comparing alternatives, decide which parts of Better Stack your team actually needs. Some teams only want uptime checks and alerts. Others need logs, metrics, tracing, on-call workflows, and public incident communication.
Key things to look at:
- Team size and growth stage: Smaller teams often prefer simple uptime monitoring tools. Larger engineering teams may need a full observability platform.
- Monitoring depth: Decide whether uptime checks are enough or if you also need metrics, logs, and tracing.
- Incident management needs: Some tools include on-call scheduling and escalation policies. Others focus only on alerts.
- Status page support: Look at whether the platform includes public status pages, custom domains, and automated incident updates.
- Budget predictability: Monitoring costs often scale with monitor count, check frequency, data volume, and team size.
- Setup complexity: Some tools can be configured in minutes. Others require more implementation work.
Here’s a quick look at the strongest options by use case before we get into the detailed reviews.
Best Better Stack alternatives by use case
Different monitoring tools solve different problems. Some focus on simple uptime checks, while others provide full observability across infrastructure, applications, and logs.
Instead of looking for a one-size-fits-all replacement, it’s easier to narrow your options based on how your team actually works.
Best overall alternative for most teams
If you want a balance of uptime monitoring, alerts, and status pages without the complexity of a full observability platform, these tools are the closest match to Better Stack.
UptimeRobot stands out for its simplicity, predictable pricing, and fast setup. It covers core monitoring needs without requiring ongoing configuration.
Other strong options in this category include:
- Hyperping: Clean interface with built-in status pages and fast alerts
- StatusCake: Adds performance monitoring and global testing locations
Starting price: Free plans available across most tools
Best alternative for startups and small teams
Smaller teams usually need something easy to set up, affordable, and focused on core uptime alerts rather than full observability.
Hyperping is a strong fit here thanks to its quick setup and simple monitoring workflow.
You can also consider:
- UptimeRobot: generous free plan and minimal setup
- StatusCake: useful if you also want performance monitoring alongside uptime
Starting price: Free plans available, with paid tiers starting around $20–$25 per month
Best enterprise and observability-focused alternatives
Larger teams often need deeper visibility into infrastructure, applications, and system performance. These platforms go beyond uptime monitoring and include logs, metrics, and tracing.
Datadog is one of the most widely used options for full observability across complex environments.
Other strong alternatives include:
- New Relic: Strong application performance monitoring and telemetry analysis
- Grafana Cloud: Flexible observability stack built on open-source tools
- Site24x7: All-in-one monitoring across infrastructure, applications, and networks
- Sematext: Combines logs, metrics, and monitoring with flexible deployment options
- LogicMonitor: Focuses on infrastructure monitoring with automated discovery across cloud and hybrid environments
Starting price: Typically usage-based, often starting around $15 per host or scaling with data volume
Best budget and free alternatives
If you’re mainly looking for uptime monitoring with predictable pricing, several tools offer solid functionality without the cost of a full observability platform.
UptimeRobot remains one of the most accessible options, with a large free tier and straightforward pricing as you scale.
Other budget-friendly tools include:
- StatusCake: Free plan available with optional paid upgrades
- Updown.io: Pay-as-you-go pricing with no long-term commitment
- Uptime Kuma: Free self-hosted monitoring with no licensing costs
Starting price: Free tiers available, with low-cost plans starting around $5-$20 per month
Best open-source or self-hosted alternatives
For teams that want full control over their monitoring setup, self-hosted tools offer flexibility at the cost of additional setup and maintenance.
Uptime Kuma is a popular choice for lightweight, self-hosted uptime monitoring with a modern interface.
Other options include:
- Zabbix: powerful open-source monitoring for infrastructure and networks
- Netdata: real-time system monitoring with detailed performance metrics
Starting price: Free and open-source (infrastructure costs apply)
Best for performance and reliability monitoring
Some teams need deeper insight into performance, user experience, or transaction reliability rather than just uptime checks.
Pingdom focuses on website performance, real user monitoring, and synthetic testing, making it a strong choice for teams tracking user experience.
You can also consider:
- Uptime.com: Advanced uptime and transaction monitoring with SLA tracking and reporting
Starting price: Pricing varies based on monitoring type, frequency, and features
Quick comparison of Better Stack alternatives
| Tool | Best for | Uptime monitoring | Incident management | Status pages | Logs / observability | Starting price |
| UptimeRobot | Simple, reliable uptime monitoring | ✅ | ⚠️ | ✅ | ❌ | Free plan available |
| Hyperping | Startups and fast setup | ✅ | ⚠️ | ✅ | ❌ | Free plan available |
| StatusCake | Uptime + performance monitoring | ✅ | ⚠️ | ✅ | ❌ | From ~$20/month |
| Updown.io | Low-cost, usage-based monitoring | ✅ | ❌ | ❌ | ❌ | From ~$5/month |
| Pingdom | Performance and user experience monitoring | ✅ | ⚠️ | ⚠️ | ⚠️ | Pricing scales with usage |
| Uptime Kuma | Self-hosted uptime monitoring | ✅ | ❌ | ✅ | ❌ | Free (open-source) |
| Zabbix | Advanced self-hosted infrastructure monitoring | ✅ | ⚠️ | ⚠️ | ✅ | Free (self-hosted) |
| Netdata | Real-time infrastructure monitoring | ❌ | ❌ | ❌ | ✅ | Free |
| Datadog | Enterprise observability | ✅ | ✅ | ⚠️ | ✅ | From ~$15/host/month |
| New Relic | Application performance monitoring | ✅ | ✅ | ❌ | ✅ | Free + usage-based |
| Grafana Cloud | Metrics, logs, and tracing (DevOps teams) | ✅ | ⚠️ | ❌ | ✅ | Free / from ~$19/month |
| Site24x7 | All-in-one monitoring suite | ✅ | ✅ | ✅ | ✅ | From ~$10/month |
| Sematext | Logs + metrics + monitoring | ✅ | ⚠️ | ❌ | ✅ | Usage-based |
| Uptime.com | Advanced uptime and transaction monitoring | ✅ | ⚠️ | ✅ | ⚠️ | From ~$7/month |
| LogicMonitor | Infrastructure monitoring for hybrid and cloud environments | ✅ | ⚠️ | ⚠️ | ✅ | Custom pricing |
In-depth Better Stack alternatives reviews
Below is a closer look at the top Better Stack alternatives, including their features, pricing, strengths, and limitations.
Some of these tools focus on uptime checks only, while others provide broader observability across infrastructure and applications.
UptimeRobot
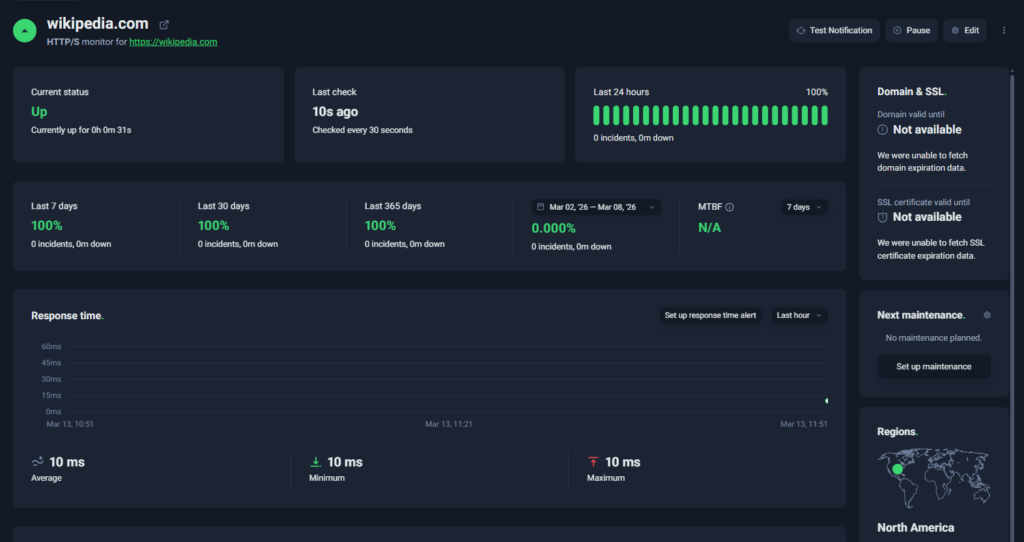
UptimeRobot dashboard
UptimeRobot is a focused uptime monitoring platform designed to help teams detect downtime quickly and receive alerts before users notice issues.
Compared with Better Stack, which combines uptime monitoring with logs, observability, and incident workflows, UptimeRobot concentrates on one core job: reliable uptime monitoring and fast alerts.
That focused approach makes it easier to set up, simpler to operate, and more affordable for teams that primarily need to monitor websites, APIs, and services for availability.
Key features:
- HTTP(s), ping, port, keyword, and cron job monitoring
- SSL certificate and domain expiration monitoring
- Public status pages with custom branding
- Real-time alerts via email, SMS, voice call, push, and integrations
- 20+ integrations including Slack, Discord, Telegram, and webhooks
- Clean dashboard for managing monitors and reviewing incidents
UptimeRobot also offers one of the largest free monitoring tiers in the uptime monitoring market.
Free plan: 50 monitors with 5-minute check intervals
Solo plan: starts around $7 per month
Team plan: starts around $29 per month with additional monitors and users
Pricing scales primarily based on monitor count and monitoring frequency, which keeps costs predictable for growing teams.
Free tools and resources:
Beyond monitoring, UptimeRobot also provides several free utilities and learning resources for developers and operations teams.
Free tools, no account required:
- Subnet calculator for network planning
- Website change detection to track page updates
- MX lookup for verifying email server configuration
- Crontab generator for creating cron expressions
- Uptime calculator to estimate service availability
There is also a Knowledge Hub with tutorials and monitoring guides, along with an active Discord community where users can ask questions, share setups, and discuss monitoring strategies.
Best fit for:
- SaaS teams monitoring websites or APIs
- Product teams needing fast downtime alerts
- Startups that want reliable monitoring with predictable pricing
- Developers who want quick setup without managing complex observability tools
Want to see how it works in practice?
You can create a free UptimeRobot account and start monitoring up to 50 websites, APIs, or services with 5-minute checks. It only takes a few minutes to set up your first monitor.
| Pros | Cons |
| Very fast setup with minimal configuration | No built in log management |
| Forever free plan with 50 monitors | Limited observability compared with full monitoring platforms |
| Clean dashboard that is easy to navigate | Fewer advanced incident management features |
| Wide range of notification channels and integrations |
Hyperping
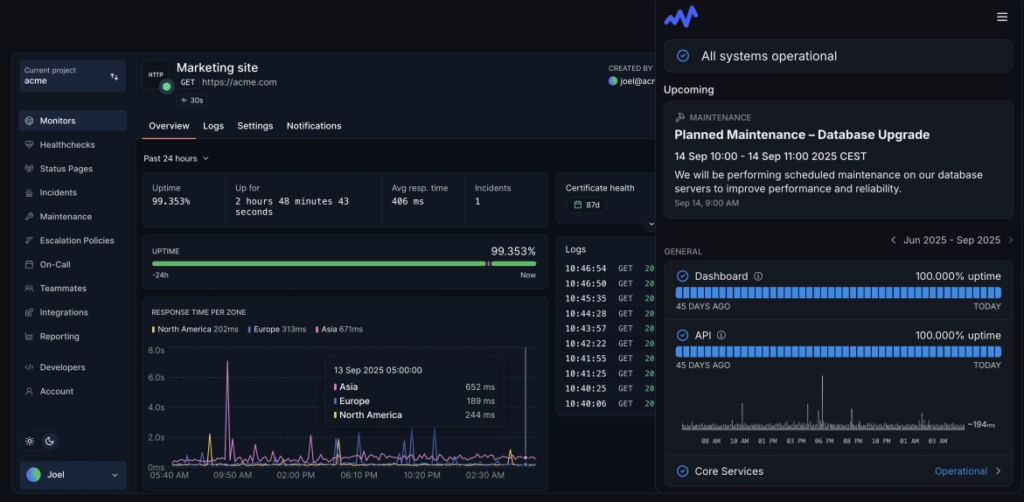
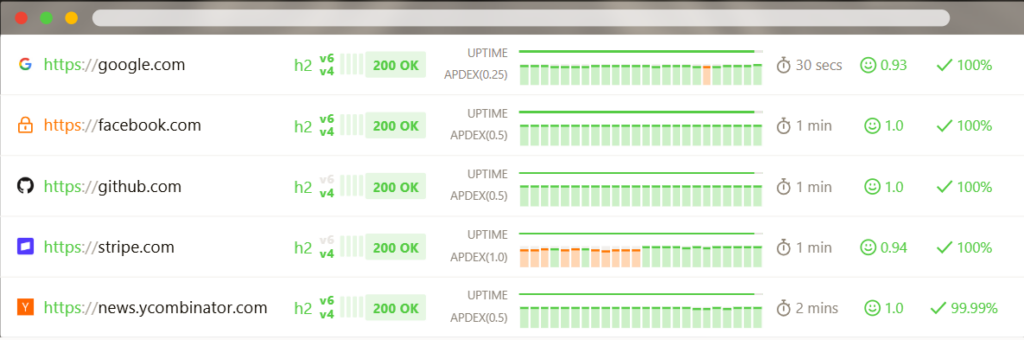
Source: Hyperping dashboard example
Hyperping is an uptime monitoring platform that helps teams detect downtime quickly and respond to incidents before they affect users.
Similar to Better Stack, Hyperping combines uptime monitoring, alerts, and status pages in a single platform. However, it focuses more narrowly on availability monitoring rather than broader observability features like logs and tracing.
The platform emphasizes fast alerting, clean dashboards, and developer-friendly integrations, making it a good option for teams that want reliable monitoring without managing a full observability stack.
Key features:
- HTTP(s), ping, and keyword uptime monitoring
- Public and private status pages
- Incident alerts via email, Slack, PagerDuty, and webhooks
- Global monitoring locations
- Integrations with common developer toolsClean dashboard for monitoring uptime and incidents
Hyperping offers a free plan with limited monitors, while paid plans start around $24 per month (first 2 months free) depending on monitor count and alerting features.
Best fit for:
- SaaS startups monitoring uptime and availability
- Dev teams that want monitoring and status pages in one tool
- Teams that want faster setup than large observability platforms
| Pros | Cons |
| Clean interface and easy setup | Smaller feature set than full observability platforms |
| Combines uptime monitoring with built-in status pages | Free plan has limited monitors |
| Good alerting and integrations with developer tools | Pricing can increase as monitor counts grow |
| Global monitoring locations | Fewer monitoring types than some competitors |
StatusCake
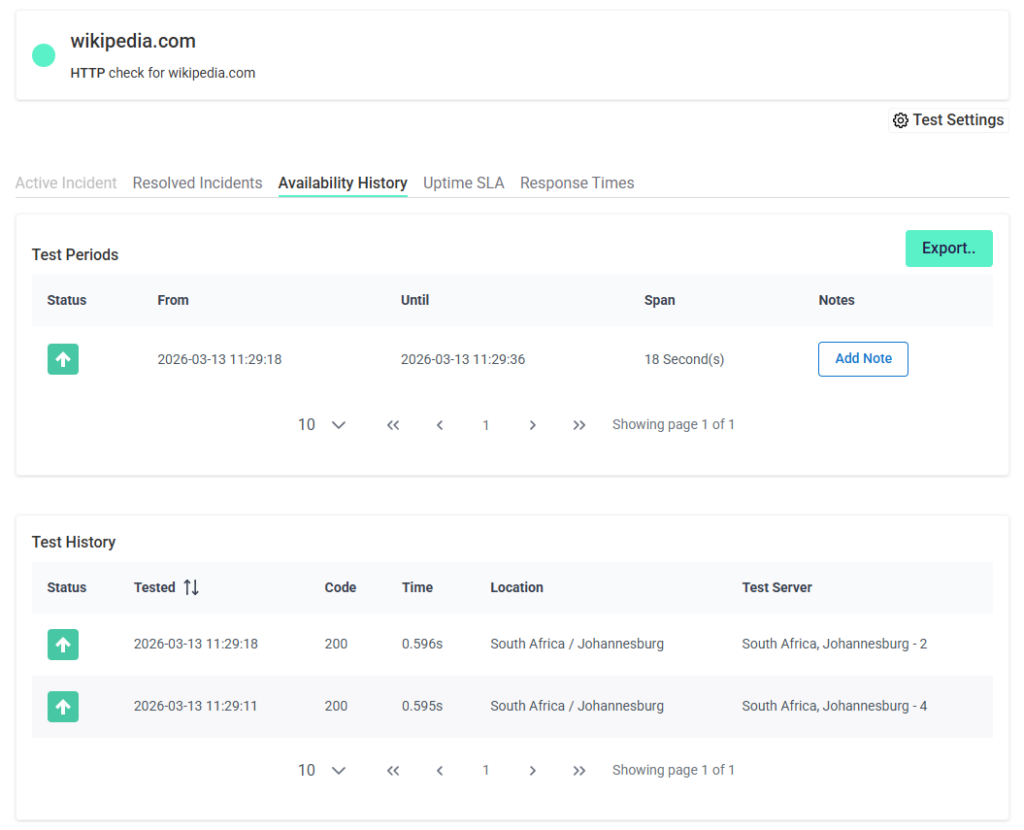
StatusCake dashboard
StatusCake focuses on uptime checks, performance monitoring, and status pages. It places more emphasis on website availability and performance diagnostics such as page speed testing and global monitoring locations than Better Stack.
Teams that want detailed performance insights alongside uptime monitoring often choose StatusCake.
Key features:
- HTTP(s), TCP, and ping uptime monitoring
- Global monitoring locations
- Page speed monitoring and performance analysis
- Public status pages for incident communication
- SSL certificate monitoring
- Alerting through email, SMS, Slack, PagerDuty, and webhooks
StatusCake offers a limited free monitoring plan with 3 monitors with 15 minute checks and a 7-day free trial for paid plans.
Paid plans start around $20 per month and scale depending on monitoring features, test frequency, and performance tools.
Best fit for:
- Teams monitoring website uptime and performance
- Companies that want global testing locations
- Organizations that want both uptime and page speed monitoring
| Pros | Cons |
| Strong uptime monitoring coverage | Interface can feel dated |
| Includes performance and page speed testing | Advanced features require higher plans |
| Global monitoring locations | Fewer integrations than some competitors |
| Built in status pages | Pricing increases with monitoring needs |
Datadog
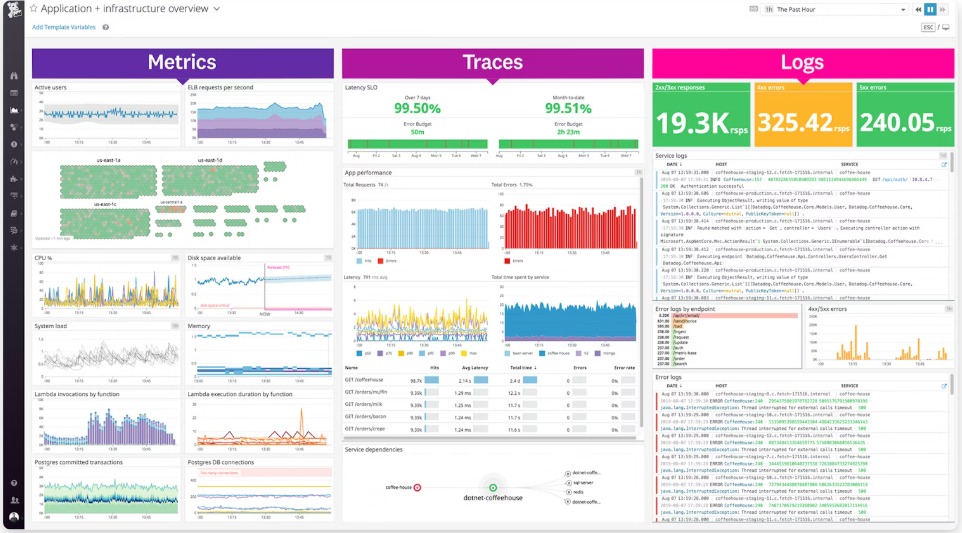
Source: Datadog dashboard example
Datadog is a cloud observability platform made for monitoring infrastructure, applications, logs, and metrics across complex environments.
The platform is more suited for deep observability, with features like distributed tracing, infrastructure monitoring, and advanced analytics.
Organizations running microservices, containers, or large cloud deployments often choose Datadog because it provides broader system visibility and detailed performance insights.
Key features:
- Infrastructure and application performance monitoring
- Log management and distributed tracing
- Real-time dashboards and analytics
- Advanced alerting and anomaly detection
- Large ecosystem of integrations with cloud providers and DevOps tools
Datadog uses a usage-based pricing model that varies depending on monitoring type, data volume, and infrastructure scale. There is also a free plan for up to 5 hosts.
Infrastructure monitoring typically starts around $15 per host per month, with additional costs for logs, traces, and other services.
Best fit for:
- Large engineering teams
- DevOps and SRE organizations
- Companies running complex cloud infrastructure or microservices
| Pros | Cons |
| Full observability platform with logs, metrics, and traces | Can become expensive at scale |
| Large integration ecosystem | Steeper learning curve |
| Powerful dashboards and analytics | Complex pricing model |
| Scales well for large infrastructure environments | Setup requires more configuration |
New Relic
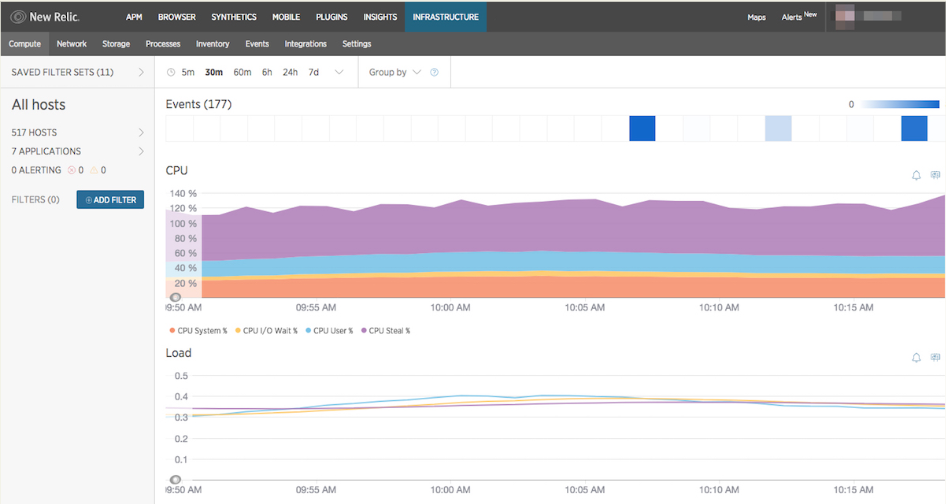
Source: New Relic dashboard example
New Relic is designed to monitor applications, infrastructure, logs, and distributed systems across complex environments. Compared with platforms like Better Stack, New Relic focuses heavily on application performance monitoring and deep telemetry analysis.
Engineering teams running microservices or distributed architectures often choose New Relic because it provides detailed insight into application performance and service dependencies.
Key features:
- Application performance monitoring (APM)
- Infrastructure monitoring and distributed tracing
- Log management and analytics
- Real-time dashboards and custom queries
- Alerting, anomaly detection, and incident tracking
New Relic uses a usage-based pricing model based on data ingestion and platform usage.
It offers a free tier with limited data usage. Paid plans scale based on telemetry data and user seats.
Best fit for:
- Large engineering organizations
- DevOps teams running microservices architectures
- Companies needing deep application observability
| Pros | Cons |
| Advanced application performance monitoring | Can be expensive at scale |
| Strong analytics and custom dashboards | Requires more configuration |
| Deep visibility into distributed systems | Steeper learning curve |
| Wide integration ecosystem | Overkill for simple uptime monitoring |
Grafana Cloud
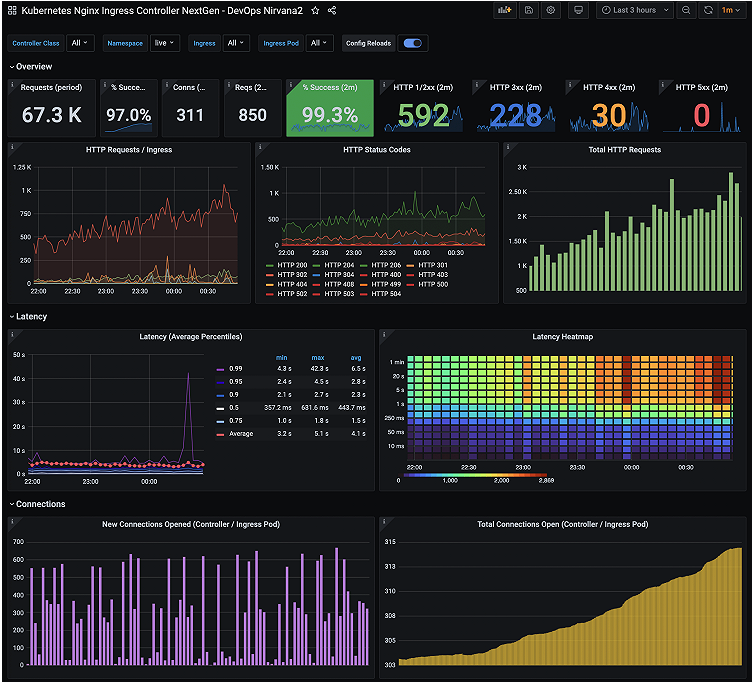
Source: Grafana dashboard example
Grafana Cloud is a hosted observability platform built around the Grafana ecosystem that combines metrics, logs, and traces with customizable dashboards and monitoring tools.
While Better Stack provides a simpler monitoring platform, Grafana Cloud offers a deeper infrastructure observability stack built on tools like Prometheus, Loki, and Tempo.
Teams already using Grafana or running large infrastructure environments often adopt Grafana Cloud for its flexibility and powerful visualization capabilities.
Key features:
- Metrics monitoring with Prometheus
- Log monitoring with Loki
- Distributed tracing with Tempo
- Custom dashboards and visualizations
- Alerting and integrations with DevOps tools
Grafana Cloud offers a free tier with limited usage.
Paid plans scale (starting at $19 per month) based on data ingestion, metrics storage, and additional observability services.
Best fit for:
- DevOps teams already using Grafana
- Infrastructure monitoring and metrics analysis
- Organizations running Kubernetes or complex cloud environments
| Pros | Cons |
| Powerful dashboards and visualization tools | Requires setup and configuration |
| Full observability stack for metrics, logs, and traces | Steeper learning curve |
| Flexible integrations with infrastructure tools | Can become complex for small teams |
| Strong open-source ecosystem | Not focused on simple uptime monitoring |
Site24x7
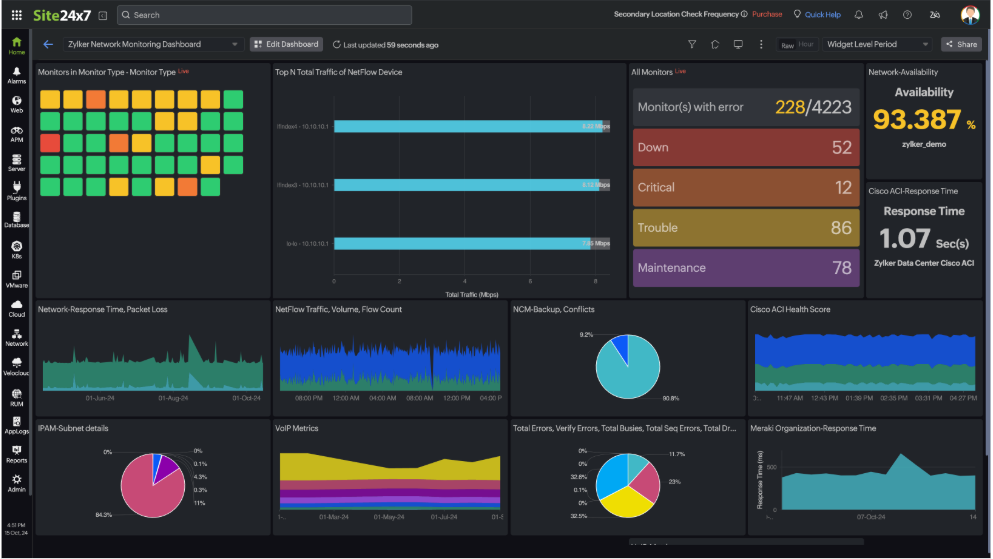
Source: Site 24×7 dashboard example
Site24x7 combines uptime monitoring with infrastructure monitoring, application performance monitoring (APM), and log analysis.
Site24x7 offers broader monitoring capabilities across servers along with cloud infrastructure, and network environments. Teams looking for an all-in-one monitoring suite often choose it when they need more infrastructure visibility than basic uptime monitoring tools provide.
Key features:
- Website uptime monitoring
- Infrastructure and server monitoring
- Application performance monitoring (APM)
- Log management and analytics
- Network monitoring and reporting
Site24x7 offers a limited free plan intended mostly for testing the platform. Paid plans typically start around $9-$10 per month, with pricing scaling based on the number of monitored resources and advanced monitoring features
Best fit for:
- IT teams monitoring infrastructure and applications
- Organizations managing cloud or hybrid infrastructure
- Companies needing an all-in-one monitoring platform
| Pros | Cons |
| Wide range of monitoring capabilities | Interface can feel complex for new users |
| Strong cloud infrastructure monitoring | Setup requires more configuration |
| Built-in reporting and analytics tools | Pricing scales as monitoring scope increases |
| Flexible alerting and integrations | Less streamlined than simple uptime tools |
Pingdom
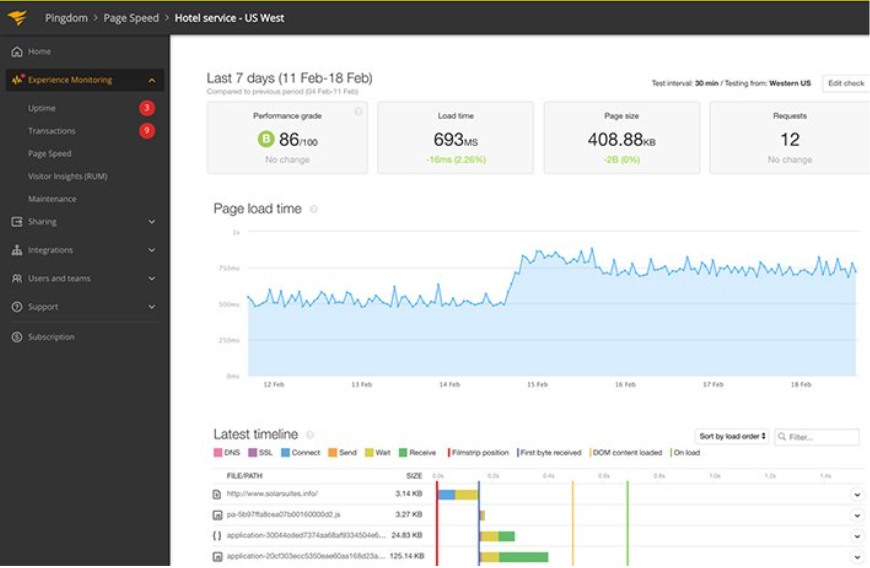
Source: Pingdom dashboard example
Pingdom, owned by SolarWinds, combines uptime monitoring with performance testing and real user monitoring. Unlike broader platforms like Better Stack, Pingdom concentrates on website availability and performance analytics rather than infrastructure observability or log management.
Teams that want deeper insight into page speed and user experience often prefer Pingdom, while organizations needing broader infrastructure monitoring may find Better Stack more suitable.
Key features:
- HTTP(s), ping, and transaction monitoring
- Real user monitoring and synthetic testing
- Page speed and performance insights
- Alerting via email, SMS, and integrations
- Custom dashboards and reporting
Pricing varies based on monitor count, check frequency, and performance features, and can increase quickly as usage grows. A 30-day free trial is available.
Best fit for:
- Teams focused on website performance and uptime
- Organizations monitoring user experience and page speed
- Companies that want synthetic and real user monitoring in one platform
| Pros | Cons |
| Strong performance and page speed insights | Pricing scales quickly with monitor count |
| Real user monitoring capabilities | Limited incident management features |
| Reliable uptime monitoring | Fewer integrations than DevOps focused platforms |
| Good reporting and analytics | Interface and workflows feel dated for some teams |
Updown.io
Source: Updown.io dashboard example
Updown.io is a lightweight uptime monitoring service designed to check whether websites and APIs are available and alert teams when problems occur. The platform focuses on reliability and transparent pricing rather than offering a large suite of observability tools.
Unlike Better Stack, Updown.io concentrates purely on uptime checks and alerting. Its simple pay-as-you-go pricing model makes it a practical option for teams that want affordable monitoring without committing to a full observability platform.
Key features:
- HTTP(s) uptime monitoring
- API and endpoint monitoring
- Global monitoring locations
- Detailed response time tracking
- Alerts via email, SMS, Slack, Telegram, and webhooks
Updown.io uses a pay-as-you-go pricing model based on the number of checks performed, with a free trial of 100,000 credits.
Pricing typically starts at around $5 per month, depending on monitoring frequency and the number of monitored endpoints.
Best fit for:
- Teams looking for affordable uptime monitoring
- Developers monitoring websites or APIs
- Projects that prefer predictable usage-based pricing
| Pros | Cons |
| Transparent pricing | No built-in status page features |
| Simple setup and lightweight interface | Limited observability capabilities |
| Reliable uptime monitoring | Fewer integrations than enterprise platforms |
| Flexible monitoring frequency | Not designed for complex infrastructure monitoring |
Uptime Kuma
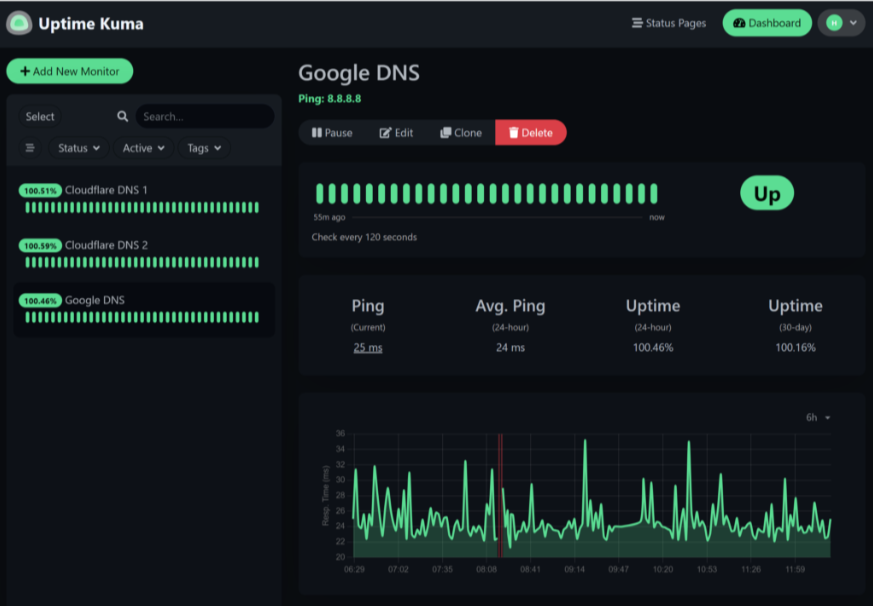
Source: Uptime Kuma dashboard example
Uptime Kuma is a self-hosted uptime monitoring tool designed to track website and service availability with a modern interface and flexible deployment options.
As opposed to managed platforms like Better Stack, Uptime Kuma requires teams to run and maintain their own monitoring environment. This makes it appealing for organizations that want full control over their monitoring infrastructure and data.
Key features:
- HTTP(s), ping, TCP, DNS, and keyword monitoring
- Built-in status pages
- Notifications through email, Slack, Discord, and webhooks
- Docker-based deployment
- Self-hosted monitoring and data control
Uptime Kuma is completely free to use. Costs only come from the infrastructure required to host and maintain the monitoring system.
Best fit for:
- Developers who prefer self-hosted tools
- Teams wanting full control over monitoring infrastructure
- Organizations avoiding SaaS monitoring platforms
| Pros | Cons |
| Free and open source | Requires self-hosted infrastructure |
| Clean and modern interface | No managed hosting |
| Flexible monitoring options | Limited enterprise features |
| Built-in status pages | Requires manual maintenance |
Netdata
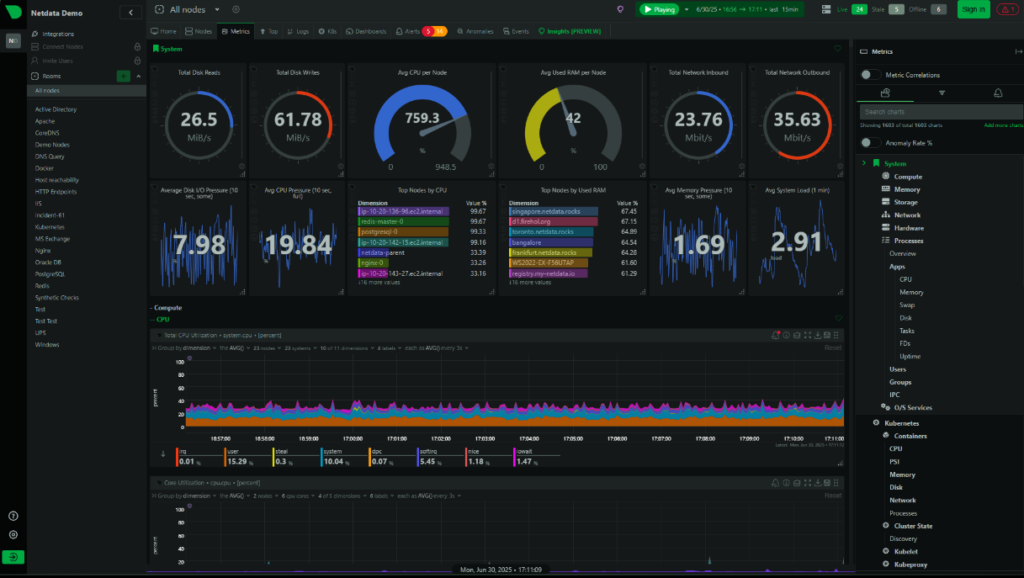
Source: Netdata dashboard example
Netdata is an open-source observability platform created for real-time monitoring of servers, containers, and applications.
It’s best for self-hosted infrastructure monitoring and detailed system-level metrics. It provides real-time dashboards that let teams analyze performance issues across servers and services.
Key features:
- Real-time system monitoring dashboards
- Metrics collection across servers and containers
- Infrastructure and resource monitoring
- Open-source deployment options
- Integrations with Prometheus, Grafana, and other monitoring tools
Netdata offers a free open-source version that can be self-hosted.
Netdata Cloud provides additional features such as centralized monitoring and team collaboration through paid subscription plans.
Best fit for:
- DevOps teams monitoring infrastructure performance
- Organizations that prefer open-source monitoring tools
Teams needing detailed system-level metrics and diagnostics
| Pros | Cons |
| Open-source and self-hosted flexibility | Requires infrastructure to host and maintain |
| Extremely detailed real-time metrics | Not focused on uptime monitoring |
| Powerful performance diagnostics | Setup may be complex for smaller teams |
| Strong integration with observability tools | No managed SaaS version for simple deployment |
Sematext
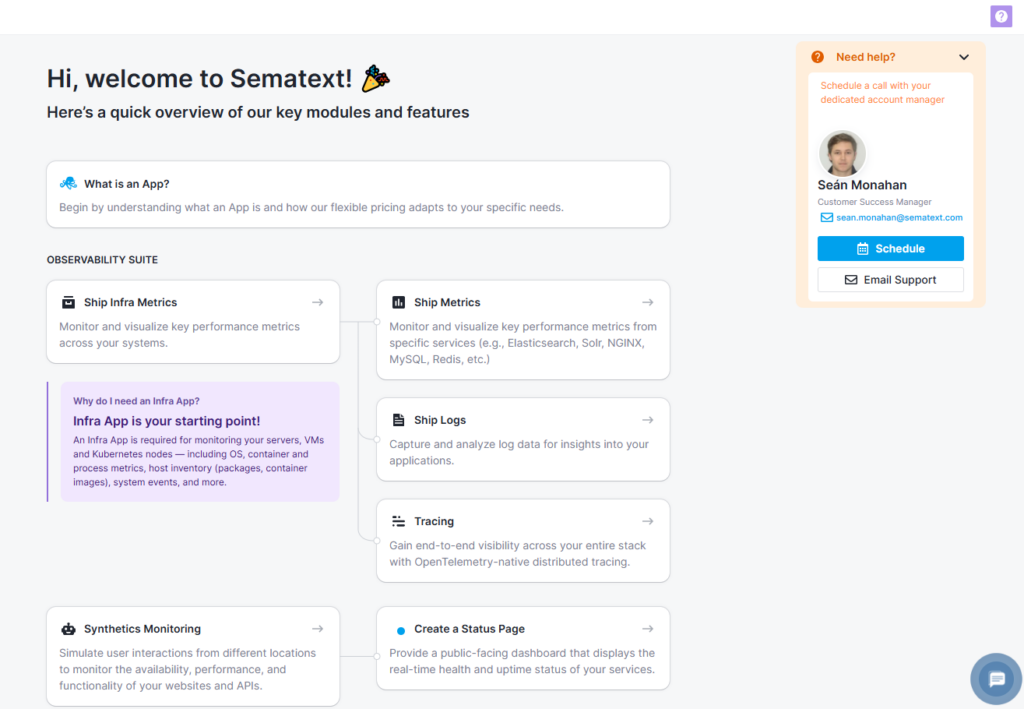
Sematext start screen
Sematext is built for teams that want visibility across logs, metrics, and uptime in one place, without being tied to a single deployment model. It supports both cloud and self-hosted setups, which makes it more flexible than most managed platforms.
It leans further into infrastructure and application observability than Better Stack, making it a better fit for teams that need deeper system-level insight rather than just uptime and incident workflows.
Key features:
- Infrastructure and application monitoring
- Log management and analytics
- Uptime monitoring and alerting
- Real-time dashboards and anomaly detection
- Cloud and on-premise deployment options
Sematext uses a usage-based pricing model, with separate plans for logs, infrastructure monitoring, tracing, and synthetics. Costs scale based on data volume, monitored resources, and retention. A 14-day free trial is available.
Best fit for:
- DevOps teams needing logs, metrics, and uptime in one platform
- Teams that want flexible deployment options
- Organizations avoiding vendor lock-in
| Pros | Cons |
| Flexible deployment (cloud or on-premise) | Pricing scales with usage |
| Combines logs, metrics, and uptime | Interface less polished than some competitors |
| Strong alerting and analytics | Requires setup and tuning |
| More lightweight than some enterprise tools | Not ideal for beginners |
Zabbix
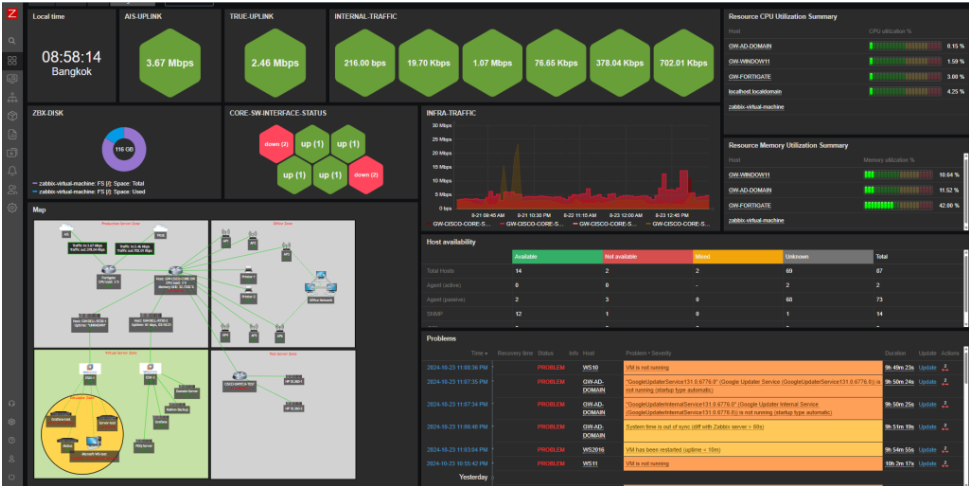
Source: Zabbix dashboard example
Zabbix is a fully open-source monitoring platform built for tracking infrastructure, networks, and applications in real time. It gives you complete control over your monitoring setup, but that also means handling hosting, configuration, and ongoing maintenance yourself.
Unlike Better Stack, which is managed and ready to use, Zabbix is better suited to teams with the technical resources to manage a more complex, self-hosted system.
Key features:
- Infrastructure and network monitoring
- Metrics collection and visualization
- Alerting and escalation rules
- Custom dashboards and reporting
- Fully self-hosted deployment
Zabbix is free and open-source to use, with no licensing costs. Expenses come from the infrastructure and maintenance required to run it, and optional paid support services if needed.
Best fit for:
- Teams that want full control over monitoring infrastructure
- Organizations with in-house DevOps expertise
- Environments requiring high customization
| Pros | Cons |
| Fully open-source and customizable | Requires setup and ongoing maintenance |
| No licensing costs | Steeper learning curve |
| Highly flexible monitoring capabilities | No managed hosting option |
| Strong enterprise-level features | Not beginner-friendly |
Uptime.com
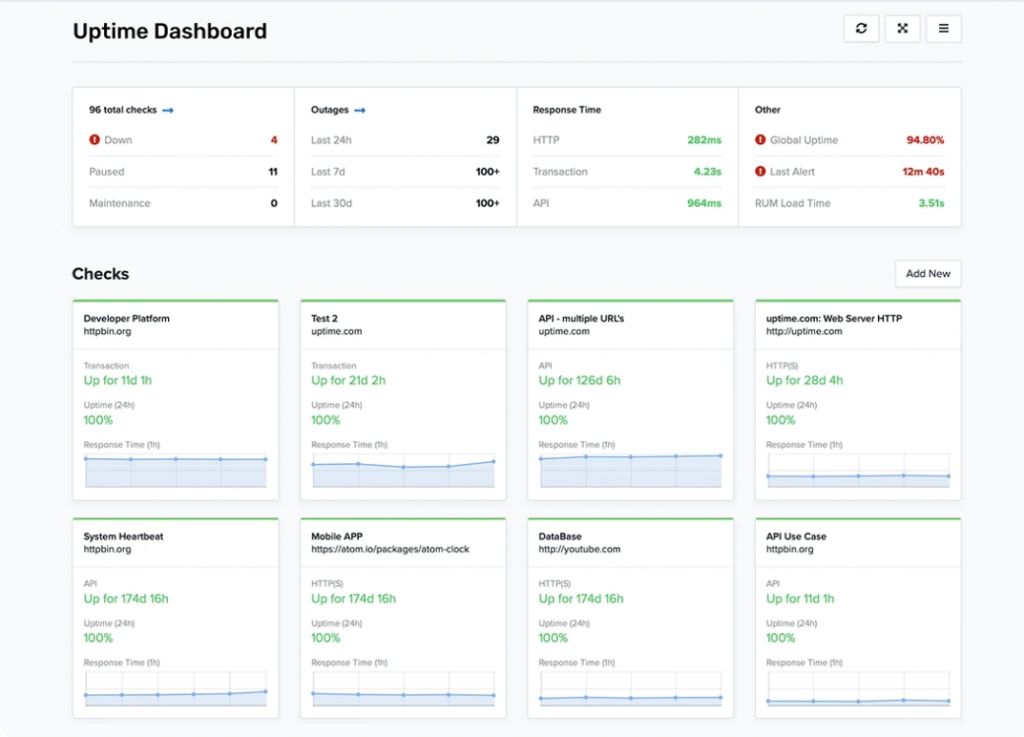
Source: Uptime.com dashboard example
Uptime.com is built around uptime checks, transaction monitoring, and reliability testing, with strong support for tracking service performance and user-facing workflows.
It leans more toward availability and synthetic monitoring rather than full observability, so it works best for teams prioritizing uptime and SLA tracking over logs or deeper system-level analysis.
Key features:
- Uptime and transaction monitoring
- Synthetic testing and API checks
- Alerting and escalation workflows
- Public status pages
- Reporting and SLA tracking
Pricing starts at around $7 per month for basic website monitoring, with costs increasing based on check types, monitoring volume, and add-on features such as transaction checks, real user monitoring, and status pages. Plans are flexible and can be customized as monitoring needs grow.
Best fit for:
- Teams needing advanced uptime and transaction monitoring
- Organizations focused on SLA tracking and reliability
- Businesses that want more depth than basic uptime tools
| Pros | Cons |
| Strong uptime and transaction monitoring | More expensive than basic tools |
| Detailed reporting and SLA tracking | Less focus on logs and observability |
| Reliable alerting and escalation | Interface can feel complex |
| Wide range of monitoring options | Overkill for simple setups |
LogicMonitor
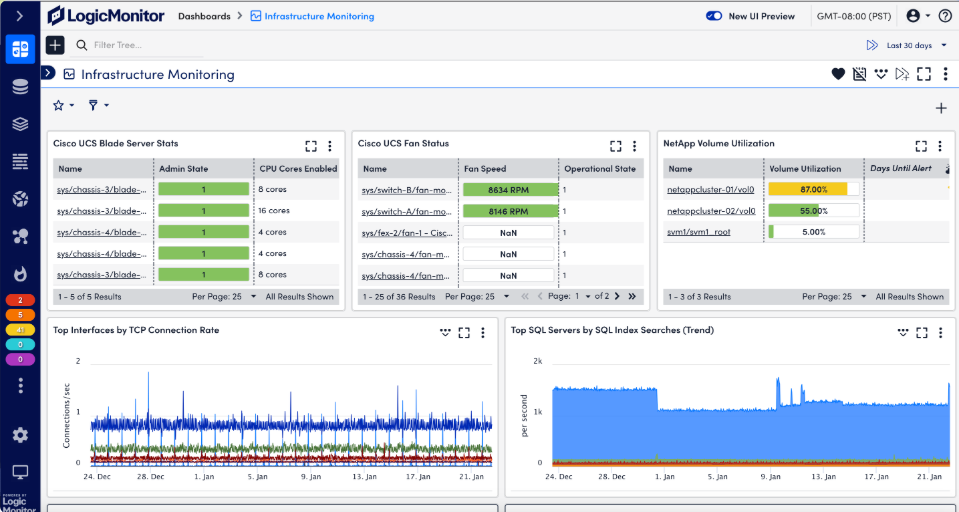
Source: LogicMonitor dashboard example
LogicMonitor is designed for monitoring infrastructure across cloud, on-premise, and hybrid environments, with a strong emphasis on automated discovery and system-level visibility.
Compared to Better Stack, it’s more oriented toward infrastructure monitoring than developer-focused uptime tracking, which makes it a better fit for IT operations teams managing servers, networks, and cloud resources at scale.
Key features:
- Infrastructure and network monitoring
- Automatic device discovery
- Cloud and hybrid environment support
- Alerting and anomaly detection
- Custom dashboards and reporting
LogicMonitor is a premium platform with pricing based on infrastructure size and monitoring scope. Pricing is typically custom.
Best fit for:
- IT and DevOps teams managing infrastructure at scale
- Organizations with hybrid or multi-cloud environments
- Teams needing automated infrastructure discovery
| Pros | Cons |
| Strong infrastructure monitoring coverage | Expensive compared to simple uptime tools |
| Automated discovery reduces setup time | Pricing not transparent |
| Scales well for large environments | Overkill for basic uptime monitoring |
| Good alerting and visualization | Requires onboarding and setup |
Better Stack vs. its alternatives
Better Stack’s all-in-one approach works well for some teams, but it also means the platform sits between two categories: simple uptime monitoring tools and full observability platforms.
Understanding where Better Stack fits can help you decide whether you need a simpler monitoring solution or a deeper observability stack.
Where Better Stack performs well
Better Stack works best for teams that want multiple monitoring capabilities bundled together.
Key strengths include:
- Integrated monitoring stack: Combines uptime monitoring, logs, incidents, and status pages in one platform.
- Developer-friendly interface: The platform is designed with modern DevOps workflows in mind.
- Incident management tools: Built-in on-call scheduling and incident timelines help teams coordinate response efforts.
- Status pages: Public status pages allow teams to communicate outages with users.
For teams that want monitoring and incident workflows in one tool, Better Stack can simplify operational tooling.
Where alternatives are stronger
Many alternatives focus on specific monitoring needs rather than trying to cover everything in one platform.
Common areas where alternatives outperform Better Stack include:
- Lower pricing for uptime monitoring: UptimeRobot, StatusCake, and Updown.io offer more affordable plans with predictable pricing. They’re a better fit for teams that only need uptime checks and alerts without paying for a full observability stack.
- Advanced observability capabilities: Platforms such as Datadog, New Relic, Grafana Cloud, and Sematext provide deeper visibility into metrics, logs, and distributed systems. These are made for teams running complex infrastructure that need more than uptime monitoring.
- Self-hosted flexibility and control: Open-source tools like Uptime Kuma and Zabbix allow teams to run monitoring within their own infrastructure. This is often preferred for privacy, compliance, or customization reasons.
- Infrastructure-level monitoring and automation: Tools like LogicMonitor focus on infrastructure visibility and automated discovery across cloud and hybrid environments, which Better Stack does not prioritize.
- Simpler setup and focused workflows: Lightweight tools like Hyperping and UptimeRobot are easier to configure and operate, especially for smaller teams that don’t need full observability features.
For many teams, choosing an alternative means prioritizing either simplicity or deeper observability, depending on how complex their systems are and how much control they need..
When Better Stack is not the right fit
Teams often begin exploring alternatives when their monitoring needs fall into one of two scenarios.
First, the platform may be more complex than necessary. If the goal is simply monitoring uptime and receiving alerts, lightweight tools can deliver the same core functionality with less setup and lower cost.
Second, teams may need deeper observability capabilities. Large systems running microservices, container platforms, or complex infrastructure often require advanced telemetry, tracing, and metrics analysis.
In those cases, platforms designed specifically for observability may be a better long-term solution.
Common reasons teams switch from Better Stack
Many organizations begin exploring alternatives when their monitoring needs shift toward either simpler uptime tracking or deeper observability.
Common reasons teams switch include:
- Pricing that scales with usage: Costs can increase as monitor counts, log retention, and team members grow. Teams that only need uptime monitoring often prefer tools with simpler pricing models.
- Paying for features not used: Better Stack bundles multiple capabilities in one platform. Some teams only need uptime checks and alerts, which makes the broader feature set unnecessary.
- Need for deeper observability: Engineering teams running large distributed systems may require detailed metrics, traces, and infrastructure monitoring. Dedicated observability platforms provide more advanced telemetry analysis.
- Simpler monitoring requirements: Smaller teams and startups often want quick setup and straightforward alerting without managing a full monitoring stack.
- Preference for self-hosted tools: Some organizations prefer running monitoring infrastructure inside their own environment for privacy, compliance, or operational control.
As monitoring requirements evolve, many teams begin evaluating tools that better align with their infrastructure, workflows, and budget.
Conclusion
Choosing the right Better Stack alternative depends on how much monitoring depth, observability, and infrastructure control your team actually needs.
Teams focused on uptime alerts and service availability often choose lightweight monitoring tools such as UptimeRobot, StatusCake, or Updown.io.
Organizations operating large or distributed systems may require deeper observability platforms like Datadog, New Relic, or Grafana Cloud, which provide metrics, tracing, and infrastructure analytics.
Other teams prefer self-hosted tools such as Uptime Kuma so they can run monitoring entirely within their own environment.
Ultimately, the best option depends on the complexity of your systems, the level of monitoring detail you need, and how much control you want over the infrastructure running the monitoring stack.
-
Better Stack can work for small teams, especially those that want monitoring, incident management, and log visibility in one platform. However, teams that only need uptime monitoring may find simpler tools more affordable and easier to deploy.
-
Tools such as Datadog and New Relic are closer competitors in terms of observability capabilities. For uptime monitoring specifically, platforms like UptimeRobot, StatusCake, and Pingdom are often considered alternatives.
-
Yes. Several monitoring platforms offer free plans. UptimeRobot and StatusCake provide free uptime monitoring tiers, while Uptime Kuma and Zabbix are free open-source tools that can be self-hosted.
-
Some teams choose to use separate tools instead of an all-in-one platform. For example, a team might use an uptime monitoring tool together with a dedicated observability or incident management platform.
-
It depends on your workflow. All-in-one platforms simplify tooling and integration, while separate tools allow teams to choose specialized solutions for uptime monitoring, observability, and incident response.