Uptime monitoring tools help detect downtime by continuously checking your website, APIs, servers, and other critical services. As soon as an issue is detected, they notify you via email, SMS, Slack, or other channels so you can act quickly, often before your users even notice.
These tools are important for developers, IT teams, SaaS providers, e-commerce businesses, and anyone responsible for maintaining a reliable online presence. Downtime often leads to frustrated users, lost revenue, and a damaged reputation.
According to a 2024 study by Enterprise Management Associates (EMA), the average cost of unplanned downtime is $14,056 per minute, rising to $23,750 per minute for large enterprises.
User expectations are just as critical. Research from Akamai shows that 79% of users who encounter performance issues are less likely to return to the same site or app. Google has also confirmed that frequent outages and slow page speeds can negatively affect search engine rankings.
All of this highlights the importance of having a reliable uptime monitoring system in place.
In this blog, we’ll compare the 11 best uptime monitoring tools of 2026 to help you reduce downtime and keep your services running smoothly.
Key takeaways:
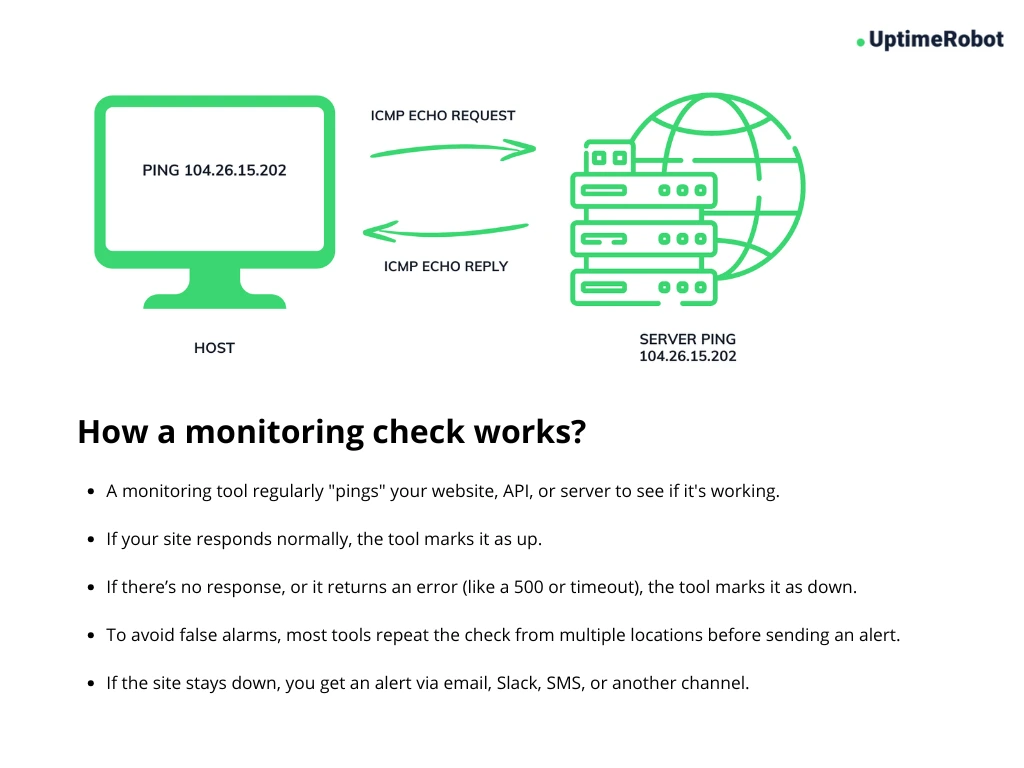
- Uptime monitoring tools regularly check your website, API, or service to ensure it is available and performing as expected. They help detect outages and slowdowns before your users notice.
- Monitoring uptime is essential because downtime can lead to lost revenue, damage to your brand reputation, and frustrated customers.
- The top 11 uptime monitoring tools in 2026 include UptimeRobot, Better Stack, Sematext, Pingdom, StatusCake, Site24x7, Datadog, Uptrends, New Relic, Uptime Kuma, and HetrixTools.
- When choosing a monitoring tool, look for features like testing from multiple global locations, SSL and domain monitoring, real user monitoring, synthetic transaction checks, and flexible alerting options.
- Opt for open source tools if you want full control and customization; choose SaaS solutions for easier setup and managed services.
- To maximize uptime monitoring effectiveness, set appropriate check intervals, customize alert thresholds, and regularly analyze historical data to identify trends and prevent recurring issues.
- The future of uptime monitoring is moving toward AI-driven anomaly detection, automated root cause analysis, and integrated observability that covers servers, applications, networks, and cloud resources in one platform.
- For beginners and solo developers, starting with a simple, reliable tool like UptimeRobot is a smart choice, offering a generous free tier, quick setup, and essential features without unnecessary complexity.
What are uptime monitoring tools?
Uptime monitoring tools are software or services that continuously check whether your website, server, or service is available and functioning properly. They alert you immediately if something goes down, allowing you to fix issues before your users even notice.
Common types of uptime checks include:
- HTTP/HTTPS: Verifies if a web page responds with a successful status code (e.g., 200 OK).
- TCP (Port Checks): Tests if a specific port (such as 22 for SSH or 80 for HTTP) is open and responsive.
- DNS: Ensures your domain resolves correctly to the intended IP address.
- SSL/TLS: Monitors the validity and expiration of security certificates to prevent browser warnings.
- Synthetic browser (Real browser monitoring): Simulates a user loading the site in a real browser to test full-page load success.

Uptime monitoring vs. performance monitoring
Uptime monitoring focuses on whether your website or service is available and responding correctly, ensuring users can access it at all times. It detects outages by performing regular checks such as HTTP requests, TCP pings, or DNS lookups.
Performance monitoring, on the other hand, measures how well your site or app performs by tracking metrics like page load speed, server resource usage, and user experience.
In short, uptime monitoring answers the question “Is it up?” while performance monitoring answers “Is it fast and working well?”
Why uptime monitoring is critical for modern websites & apps
Major incidents like the Google Cloud outage in 2025 and the Microsoft disruption in 2024 show how a single mistake in one company’s code can have global consequences. These outages disrupted governments, enterprises, and millions of users around the world.
That’s why uptime monitoring is vital. It helps teams detect issues early, respond quickly, and minimize the impact before users even notice.
Downtime = Lost revenue, trust, and SEO rankings
Even a few minutes of downtime can be costly. If your website or app is down, users can’t make purchases, sign up, or access critical services, leading to immediate revenue loss.
In high-stakes industries, the financial impact is massive. A 2024 report by Siemens found that downtime in the automotive sector can cost up to $2.3 million per hour, while UK and European manufacturers are projected to lose over £80 billion (about $100 billion) in 2025 due to production outages.
Globally, the numbers are even more staggering. According to The Hidden Costs of Downtime report by Splunk and Oxford Economics, Global 2000 companies lose $400 billion annually from unexpected digital failures.
Customer trust is just as vulnerable. A 2025 survey revealed that 24% of consumers would abandon a brand after just one bad experience. After two poor experiences, that number jumps to 70%.
Search engines also take uptime seriously. Google’s former Head of Webspam, Matt Cutts, has stated that while brief outages (less than 24 hours) typically don’t affect SEO, extended downtime (48 hours or more) can lead to temporary removal from Google search results, hurting your visibility and organic traffic.
24/7 Monitoring beats manual checks
You can’t realistically monitor your website manually all the time. Outages can happen at any time, and without automated monitoring, you might not notice issues until users start complaining.
That’s where uptime monitoring tools come in. They automatically check your website or app around the clock, from multiple global locations. The moment downtime is detected, they send instant alerts via email, SMS, or tools like Teams and Slack, helping your team respond fast and fix the issue before it affects more users or causes serious disruption.
Essential for meeting SLA requirements
If your business serves enterprise clients or offers paid digital services, you’ve likely committed to Service Level Agreements (SLAs) that promise 99.9% uptime or higher. That level of availability allows for just 43 minutes of downtime per month. Falling short can result in financial penalties, lost contracts, and strained customer relationships.
Uptime monitoring helps you stay within those limits. These tools continuously track service availability and alert your team the moment uptime drops below your defined targets. Many also offer automated SLA reports, making it easy to prove compliance, share performance data with clients, and maintain transparency.
With real-time alerts and reporting, your team can respond quickly, avoid breaches, and protect both revenue and reputation.
Not sure what 99.9% uptime actually means? Use UptimeRobot’s free uptime/downtime calculator to see how much downtime is allowed under different SLA percentages.
Top 11 uptime monitoring tools in 2026
Here are the best uptime monitoring tools ranked by reliability, ease of use, pricing, and feature set. Whether you’re a developer, sysadmin, startup, or enterprise, this list has something for every use case.
- UptimeRobot (top pick for all use cases)
- Better Stack (best for beautiful status pages)
- Sematext (best for developers & CI/CD integration)
- Pingdom (best for user-friendly monitoring at scale)
- StatusCake (best for fast setup & unlimited tests)
- Site24x7 (best for full-stack monitoring in one platform)
- Datadog (best for cloud-native and enterprise monitoring)
- Uptrends (best for flexible multi-step and global monitoring)
- NewRelic (best for developers needing full observability)
- Uptime Kuma (best self-hosted open source monitoring tool)
- HetrixTools (best for affordable alerts)
Okay, let’s dive a bit deeper into each one of them.
1. UptimeRobot
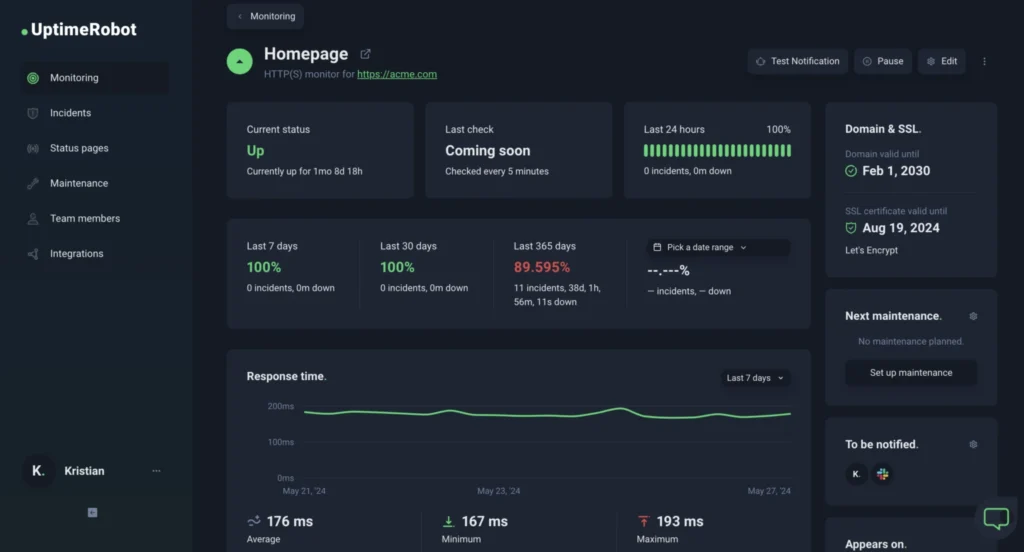
UptimeRobot is a popular and well-established uptime monitoring service that offers a strong feature set at an affordable price point. It’s especially well-suited for developers, startups, small businesses, and teams that need dependable monitoring without unnecessary complexity or high costs.
Features
- Lifetime free plan: Monitor up to 50 websites or services at no cost, with checks running every 5 minutes. Ideal for personal projects, small websites, or anyone starting with uptime monitoring.
- Affordable pro plans: Upgrade to the Pro plan for faster 1-minute checks, extended log retention (up to 24 months), SMS/voice call alerts, and enhanced integrations. All starting at just $7/month, making it one of the most cost-effective premium options available.
- Wide monitoring options: UptimeRobot supports various monitoring types, including HTTP(s), ping, port, keyword, SSL, and cron (heartbeat) monitoring, covering everything from websites and APIs to servers and scheduled tasks.
- Alerts & integrations: Receive instant alerts via email, Slack, SMS, Microsoft Teams, Telegram, or webhooks. Easily share your uptime stats with clients or users through customizable public or private status pages.
- Easy setup: Getting started takes less than a minute. Simply add a URL or IP, and UptimeRobot begins monitoring. With a clean UI and intuitive setup, it’s trusted by over 2 million users worldwide for its simplicity and reliability.
Best for
Startups, developers, SMBs, and anyone needing reliable monitoring with a generous free plan.
Pricing
- Free: 50 monitors @ 5-minute interval [Register now]
- Pro: From $7/month [See all plans]
| Pros | Cons |
| ✅ Multiple monitor types ✅ Supports public status pages ✅ Generous free plan with 50 monitors ✅ Easy to set up, beginner-friendly UI ✅ Wide range of alert channels & integrations | ❌ Advanced analytics only on higher tiers ❌ SLA reporting is limited to the Enterprise tier ❌ Some integrations are locked behind Pro |
2. Better Stack
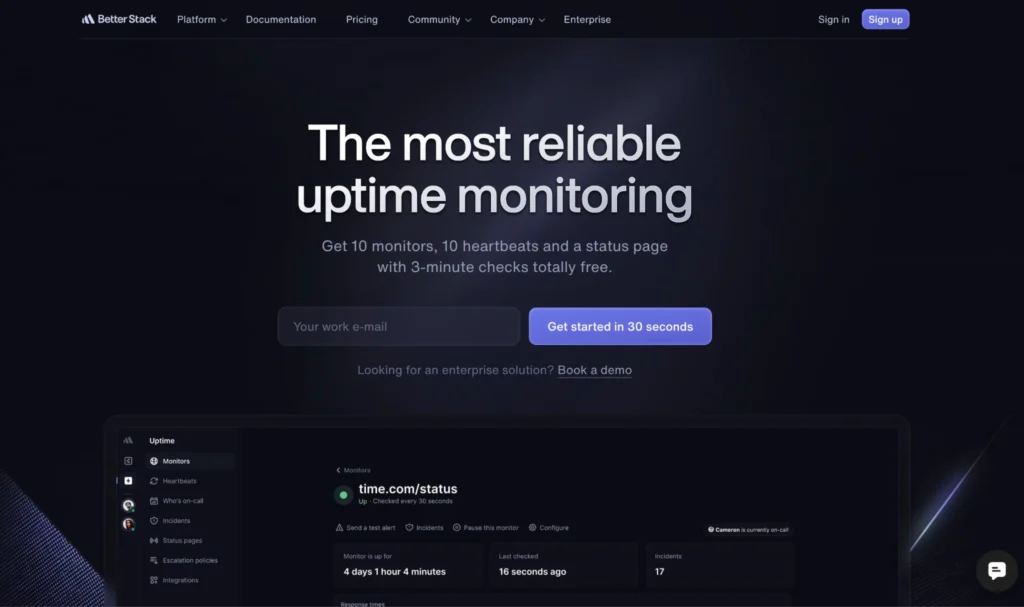
Better Stack is a modern observability platform that brings together uptime monitoring, incident management, and customizable status pages to help teams detect and resolve issues quickly. It’s widely appreciated for its clean UI, fast setup, and real-time alerting.
Which tool is right for you? Take a look at how UptimeRobot compares with Better Stack!
Features
- Fast 30-second checks: Capture second-by-second incident timelines and get screenshots of errors for quick diagnostics.
- Broad monitoring coverage: Supports checks for websites, APIs, SSL, ping, DNS, domain expiration, POP3, IMAP, SMTP, and generic network endpoints.
- Cron job monitoring: Ensure scheduled jobs like database backups or serverless functions run as expected – get notified if they fail or don’t execute.
- User-friendly setup: Minimal configuration required, making it easy for teams to get started.
- Customizable status pages: Mobile-friendly, brandable pages with incident timelines and subscriber notifications to keep users informed during outages.
Best for
Startups, SaaS companies, and developer teams that prioritize transparency and customer communication through professional status pages.
Pricing
- Free: 10 monitors & heartbeats, 3-minute checks, 1 status page
- Pro: From $21/month
| Pros | Cons |
| ✅ Modern, highly customizable status pages ✅ Supports multiple advanced monitoring types ✅ Integrations with popular alerting tools ✅ Intuitive, clean user interface | ❌ Free plan limited to 10 monitors ❌ Pricier than some basic alternatives |
3. Sematext
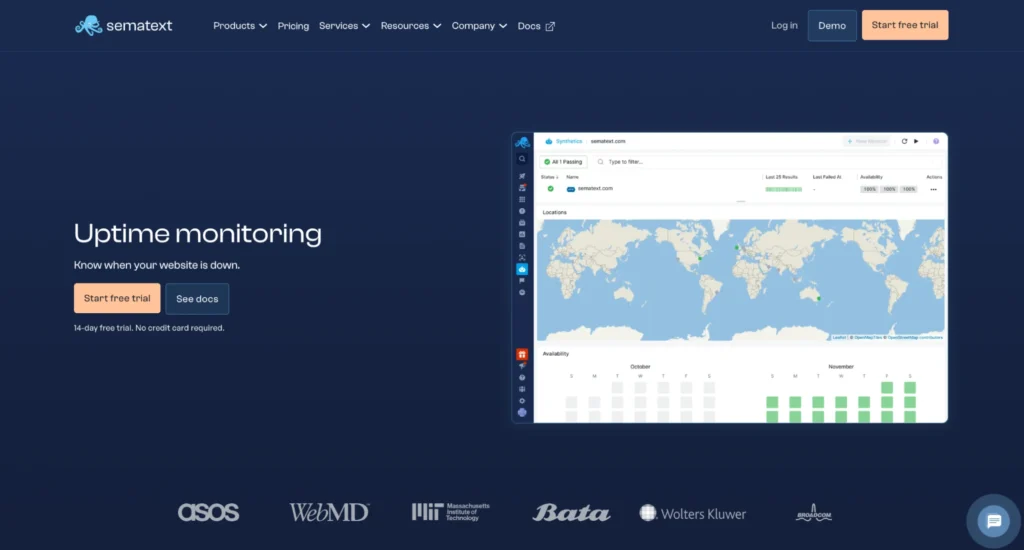
Sematext is a cost-effective, full-featured monitoring platform known for its ease of use, quick setup, and transparent pricing. It allows teams to get uptime monitoring up and running within minutes while offering advanced capabilities usually found in more expensive tools.
Features
- Global & private monitoring locations: Monitor from multiple regions worldwide, or set up private probes for internal services and APIs.
- SSL monitoring: Track certificate expiration, validity, and issuing authority to avoid security lapses.
- Advanced API monitoring: Extract, chart, and alert on values from API responses to monitor both uptime and business logic.
- Website monitoring: View page waterfall charts, monitor Core Web Vitals, extract numeric data from page content, and set alerts.
- Synthetic user journey monitoring: Simulate user flows using scripts (login, checkout, etc.), store credentials securely, and sync scripts with GitHub.
- CI/CD integration: Run monitor checks automatically during deployments to catch regressions before they hit production.
- Customizable status pages: Create private or public status pages, use a custom domain, and manage incident updates and scheduled maintenance.
Best for
DevOps teams, SysAdmins, and Site Reliability Engineers (SREs) who need to monitor infrastructure and applications, manage logs, and troubleshoot performance issues across various environments.
Pricing
- No free plan available
- Pro: From $2.80 per month
| Pros | Cons |
| ✅ Strong integration with CI/CD & DevOps tools ✅ Unified platform for logs, metrics, and uptime ✅ Browser-based synthetic monitoring is available ✅ Flexible alert routing and API access ✅ Usage-based pricing with customizable plans to fit your needs | ❌Pricing can add up with many monitors |
4. Pingdom
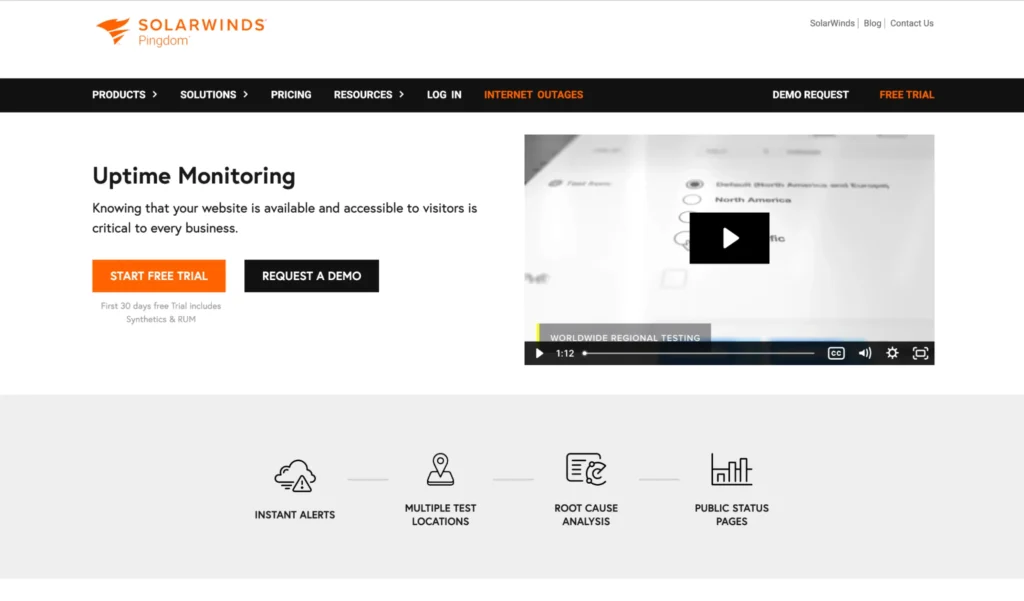
Pingdom, by SolarWinds, is a widely trusted uptime monitoring tool known for its strong combination of reliability, ease of use, and performance insights. It offers both synthetic checks and Real User Monitoring (RUM), allowing teams to track uptime, page speed, and user interactions from multiple global locations.
UptimeRobot vs. Pingdom – which is the best for your business? Find out on our comparison page.
Features
- Global monitoring network: Check uptime from 100+ locations worldwide to ensure accurate, geo-redundant monitoring coverage.
- Synthetic transaction monitoring: Simulate critical workflows like login, search, and checkout to detect issues before real users do.
- Real User Monitoring (RUM): Analyze real user interactions across devices, browsers, and regions to understand actual performance impact.
- Custom alerting: Configure multi-channel alerts (email, SMS, Slack, PagerDuty, etc.) with escalation policies to avoid alert fatigue.
- Root cause diagnostics: Get traceroutes, logs, and reports to investigate outages and slowdowns quickly.
- Status page publishing: Share public-facing or private status pages to keep stakeholders informed during incidents.
- DevOps integrations: Use webhooks and built-in integrations to connect with your incident management and CI/CD pipelines.
Best for
Individuals and teams who are responsible for website performance and availability, including web developers, website owners, digital agencies, and e-commerce store owners.
Pricing
- No free plan available
- Paid: From $10/month per monitor
| Pros | Cons |
| ✅ Combines uptime with RUM and performance ✅ Trusted, stable solution backed by SolarWinds ✅ Customizable alerts and reports ✅ Great UI and status visualization | ❌ No free plan available ❌ Pricing scales quickly with more monitors |
5. StatusCake
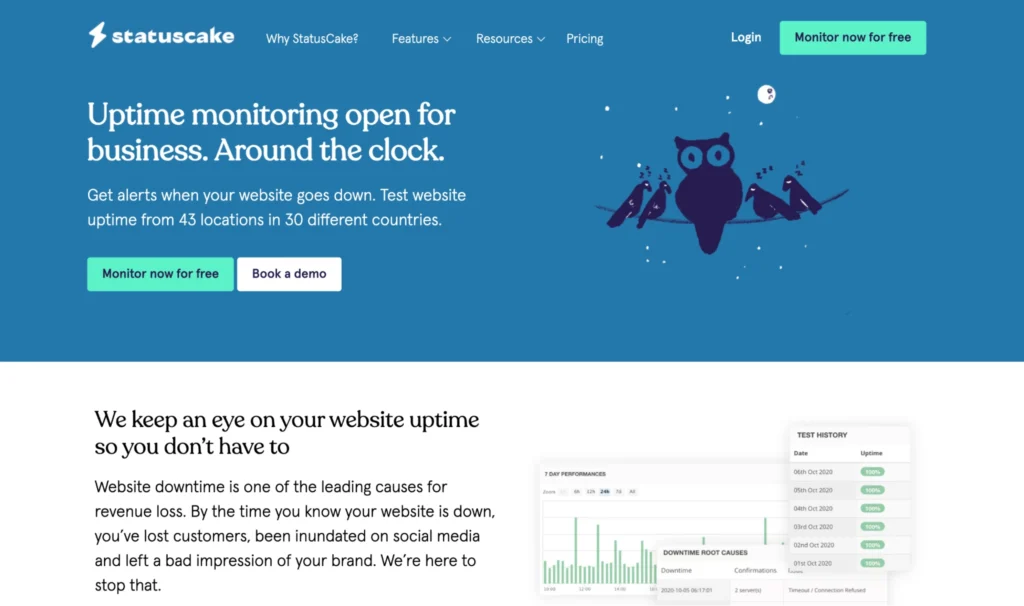
StatusCake is a flexible and easy-to-use uptime monitoring service that caters to a wide range of users, from hobbyists and bloggers to digital agencies and ecommerce teams. With unlimited testing on all paid plans and generous free tier limits, it’s a practical option for anyone looking to get up and running quickly with minimal friction.
Features
- Global testing locations: Choose specific test locations with paid plans to detect regional issues, so you’ll know if your site is down in the UK but up in the US.
- Multi-platform alerting: Get notified instantly through 14+ platforms, including email, SMS, Slack, and more, ensuring your team never misses a critical alert.
- Detailed uptime diagnostics: Gain full visibility into downtime causes with insights like HTTP status codes, ping results, and test location data to troubleshoot faster.
- Historical uptime reports: Access up to one month of historical test results to track patterns, compare with real-time data, and monitor long-term site performance.
- Flexible check intervals: Customize check frequency (as fast as every 30 seconds) and set who gets alerted and how, for a monitoring setup that fits your workflow.
Best for
Small businesses, startups, and teams that need easy, affordable website and server monitoring with fast setup and customizable alerts.
Pricing
- Free: 3 monitors @ 15-minute interval
- Paid: From ~$20/month
| Pros | Cons |
| ✅ Unlimited tests on paid plans ✅ Includes SSL/domain monitoring on the free tier ✅ Fast setup and beginner-friendly ✅ Lots of alerting channels and integrations | ❌Limited historical data on lower plans ❌Outdated UI in some areas ❌Limited API and feature set |
6. Site24x7
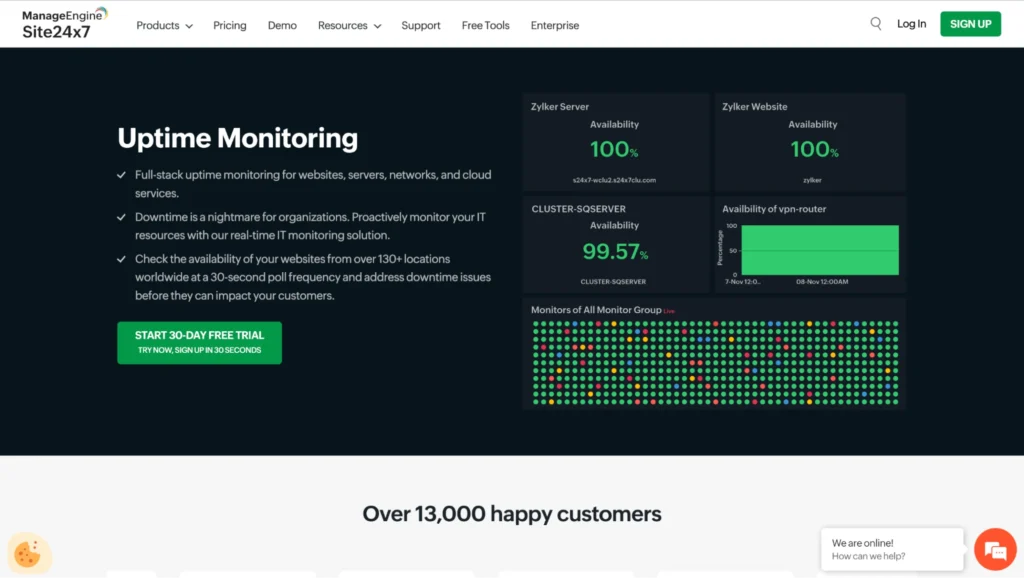
Site24x7, from Zoho Corporation, is a comprehensive monitoring suite designed for IT teams and enterprises. It offers everything from uptime and server monitoring to application performance, network monitoring, and synthetic testing, making it a great choice for organizations that want full visibility into their tech stack from a single platform.
Not sure about Site24x7? Check out our UptimeRobot vs. Site24x7 comparison page for more details.
Features
- Unified monitoring: Monitor websites, servers, cloud platforms (AWS, Azure, GCP), applications, networks, containers (Kubernetes), and SaaS services, all from a single dashboard.
- Real user & synthetic monitoring: Combine synthetic uptime and transaction tests with real user monitoring for complete insight into technical performance and user experience.
- AI-powered alerts & root cause analysis: Leverage AI-driven anomaly detection, contextual alerts, and automated incident insights to resolve outages and performance issues faster.
- Advanced reporting & dashboards: Customize dashboards and access detailed real-time and historical reports, root cause analysis, and capacity planning for optimized IT resource management.
- Security & compliance: Includes log management, SSL and domain expiry monitoring, vulnerability scanning, security score reporting, and support for regulatory compliance.
- Collaboration & integrations: Supports multi-tenant MSP environments, public status pages, incident management integrations (Slack, Teams, Jira), and customizable user roles to streamline team workflows.
Best for
IT and DevOps teams of all sizes, from startups to large enterprises, who need a unified, cloud-based monitoring solution. It suits businesses looking to monitor websites, servers, applications, networks, and user experience from a single platform with AI-driven insights and automation.
Pricing
- Free: 5 monitors @ 10-minute interval
- Paid: From $9/month
| Pros | Cons |
| ✅ All-in-one monitoring for websites to servers ✅ Strong APM, infra, and network visibility ✅ Highly customizable alerting and SLA tools ✅ Supports hybrid cloud and enterprise IT setups | ❌ Steeper learning curve for smaller teams ❌Can be overkill for basic uptime use cases |
7. Datadog
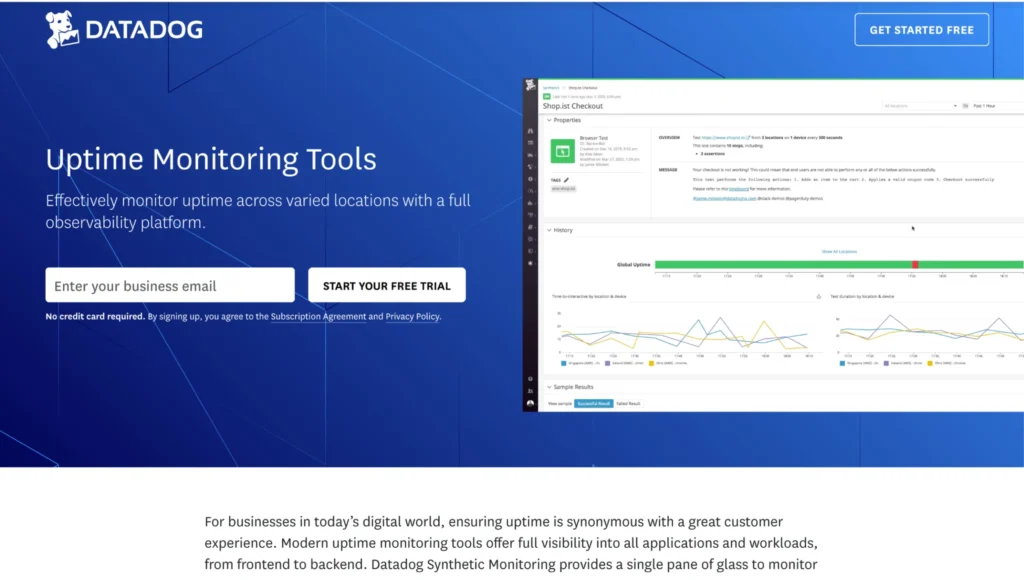
Datadog is a powerful observability platform built for modern, cloud-native infrastructures. It goes far beyond basic uptime monitoring, offering deep visibility into infrastructure, application performance, logs, security, and more. For teams running microservices, containers, or multi-cloud setups, Datadog delivers everything needed for full-stack monitoring and alerting at scale.
Want to see how Datadog stacks up against competitors? Check out our post on Datadog alternatives.
Features
- Infrastructure monitoring: Real-time tracking of servers, containers, cloud services, and network performance across hybrid environments.
- Application performance monitoring (APM): Distributed tracing and deep insights to identify application bottlenecks and errors.
- Log management: Centralized collection, indexing, and analysis of logs for efficient troubleshooting and enhanced security.
- Synthetic monitoring: Automated simulated tests of APIs and user transactions to verify uptime and functional accuracy.
- Customizable dashboards: Tailor real-time visualizations of metrics, traces, and logs with personalized dashboards and alerts.
- Integrations: Connects seamlessly with hundreds of platforms and services to fit your existing workflows.
Best for
Organizations with complex, distributed systems, particularly those leveraging microservices and cloud-based architectures.
Pricing
- No free uptime-only plan
- Paid: Cloud network monitoring starts at $6 per network host per month
| Pros | Cons |
| ✅ Full observability platform (infra + APM + RUM) ✅ AI-based anomaly detection and smart alerting ✅ Extensive integrations and customization options ✅ Ideal for Kubernetes, serverless, and microservices | ❌ Can be expensive for small teams ❌ Complex UI with a steeper learning curve |
8. Uptrends
Uptrends is a cloud-based Digital Experience Monitoring (DEM) platform that provides comprehensive insights into the uptime, performance, and user experience of websites, APIs, and web applications. Recognized as a visionary in the 2024 Gartner Magic Quadrant for DEM, Uptrends is trusted by organizations worldwide to ensure optimal availability and a seamless user experience.
Features
- Synthetic monitoring: Continuous, high-frequency checks from 233 global locations simulate user interactions like logins, checkouts, and multi-step API calls to validate uptime, response accuracy, and performance.
- Real user monitoring (RUM): Collects real visitor data on load times and user experience across browsers, devices, and locations, enabling an authentic view of performance.
- Uptime monitoring: Monitors website availability with rapid detection of outages and regional issues, including HTTPS, DNS, and SSL monitoring.
- Smart alerting: Reliable, multi-channel alerts with false-positive reduction, integrated with Slack, Teams, PagerDuty, and customizable webhooks.
- Comprehensive dashboards & reporting: Customizable dashboards, interactive charts, and error snapshots provide deep insights and root cause analysis.
- API monitoring: Tracks uptime and performance of APIs while validating multi-step calls, supporting secure scripting.
- Data protection & user management: Sensitive data is excluded from storage, with admin controls over team permissions.
Best for
IT, DevOps, SRE, Platform, and product teams managing web services in production.
Pricing
- No free plan available
- Paid: From $5.10 per credit/month
| Pros | Cons |
| ✅ 220+ global checkpoint locations ✅ Multi-step transaction monitoring (synthetic flows) ✅ Custom dashboards, reports, and SLA tools ✅ Broad range of protocols and monitoring types | ❌No ongoing free plan ❌ Entry pricing is higher than basic competitors ❌ The interface can feel dated in some areas |
9. New Relic
New Relic is a cloud-based observability platform that provides real-time monitoring and analytics for applications, infrastructure, and digital customer experiences. It helps organizations detect, diagnose, and resolve performance issues quickly by unifying metrics, traces, logs, and events into a single platform for full-stack visibility.
Features
- Full-stack observability: Real-time monitoring of applications, infrastructure, logs, metrics, and traces in a single platform.
- AI-powered insights: Automated anomaly detection, root cause analysis, and predictive alerting using AI and machine learning.
- Real user monitoring (RUM) & Synthetic Monitoring: Tracks actual user interactions and simulates transactions to ensure performance and uptime.
- Distributed tracing & dynamic transaction mapping: Visualizes transaction flows and dependencies to identify bottlenecks.
- Customizable dashboards & alerts: Enables tailored views and actionable notifications aligned with business SLAs.
- Wide integrations: Supports 780+ integrations, including cloud platforms, collaboration tools, and CI/CD pipelines.
- Applied intelligence & automation: Integrates AI-driven insights with workflows for proactive incident resolution and business optimization.
Best for
Developers, SREs, and teams looking for deep observability with uptime monitoring included.
Pricing
- Free: 100 GB data ingest/month (includes synthetic checks)
- Paid: Starts at $25/month
| Pros | Cons |
| ✅ Full observability platform (APM, logs, infra, RUM) ✅ Generous free tier with synthetic monitoring ✅ Browser-based transaction and API checks ✅ AI-powered alerting & integrations (Slack, Teams, etc.) | ❌ Steeper learning curve for non-technical users ❌ Pricing can grow quickly with high usage |
10. Uptime Kuma
Uptime Kuma is an open-source, self-hosted monitoring tool designed to track website and server uptime with a user-friendly interface. It offers customizable alerts, supports multiple protocols, and provides real-time status dashboards, making it popular for individuals and teams seeking affordable and flexible uptime monitoring.
How does Uptime Kuma compare with UptimeRobot? Find out on our in-depth comparison page.
Features
- Multi-protocol monitoring: Supports monitoring of HTTP(s), TCP ports, Ping, DNS, Docker containers, and more.
- User-friendly interface: Clean, intuitive UI with interactive uptime and response time charts for easy performance tracking.
- Custom alerts & notifications: Flexible alert rules with multi-channel notifications including email, Slack, Telegram, Discord, and PagerDuty.
- Public status pages: Share real-time uptime and incident information publicly to keep customers informed.
- High-frequency checks: Enables monitoring intervals as short as 20 seconds for near-instant detection.
- SSL certificate monitoring: Tracks SSL certificates and sends timely expiration alerts.
- Customizable UI: Offers multi-language support along with dark and light mode themes for user preference.
Best for
Developers, sysadmins, and teams who want full control with a free, open-source solution.
Pricing
- Free: 100% open-source, self-hosted
| Pros | Cons |
| ✅ Free and open-source (no monthly fees) ✅ Full control over data and privacy ✅ Beautiful UI with real-time charts ✅ Supports a wide range of protocols and alerts | ❌ Requires self-hosting and server setup ❌ No built-in multi-user/team management ❌ No official support (community-based help only) |
11. HetrixTools
HetrixTools is a monitoring platform that specializes in uptime monitoring, server monitoring, and blacklist monitoring to help businesses keep track of their IT infrastructure’s availability and security. It provides real-time alerts on website outages, server health, and blacklist status of IPs and domains, enabling quick issue detection and resolution.
HetrixTools is valued for its simplicity, affordability, and comprehensive monitoring features suited for small to medium businesses and IT teams.
Features
- Uptime monitoring: Monitors website and server availability from 12 global locations with 1-minute check intervals to detect outages quickly.
- Server monitoring: Tracks critical server health metrics like CPU usage, RAM, disk space, and process status.
- Blacklist monitoring: Checks IP addresses and domains against over 100 blacklists (e.g., Spamhaus, Barracuda) to detect if any are blacklisted.
- Status pages: Public or private status pages to communicate uptime status and incidents transparently.
- Multi-channel alerts: Sends notifications via email, SMS, Slack, Telegram, and more for immediate issue awareness.
- Integration with incident management: Compatible with other tools for streamlined incident response and on-call management.
Best for
Hosting providers, sysadmins, developers, and teams that want low-cost, high-frequency monitoring and reputation checks.
Pricing
- Free: 15 uptime monitors and 32 blacklist monitors
- Paid: From $9.95/month for 30 monitors
| Pros | Cons |
| ✅Very affordable pricing with fast 1-minute checks ✅ Built-in IP/domain blacklist monitoring ✅ Excellent alerting options ✅ Clean white-label status pages (Pro+) ✅ Highly customizable alerting setup | ❌ UI is functional but not the most polished ❌ Some features are locked behind the paid tiers ❌ Not as well-known or widely integrated |
Comparison between all uptime monitoring tools
| Tool | Type | Free plan | SSL monitoring | Status pages | Alert channels | Pricing (starts from) |
| UptimeRobot | SaaS | Yes | Yes | Yes | Email, SMS, Slack, Webhooks, etc. | $7/mo |
| Better Stack | SaaS | Yes | Yes | Yes | Email, SMS, Slack, Webhooks | $21/mo |
| Sematext | SaaS | Yes | Yes | Yes | Email, Slack, PagerDuty, Webhooks | $2.8/mo |
| Pingdom | SaaS | No | Yes | Yes | Email, SMS, Slack, PagerDuty | $10/mo |
| StatusCake | SaaS | Yes | Yes | Yes | Email, SMS, Slack, Webhooks | $20/mo |
| Site 24×7 | SaaS | Yes | Yes | Yes | Email, SMS, Slack, Webhooks | $9/mo |
| Datadog | SaaS | No | Yes | Yes | Email, SMS, Slack, PagerDuty, OpsGenie | $6/mo |
| Uptrends | SaaS | No | Yes | Yes | Email, SMS, Slack, PagerDuty | $5.10/mo |
| New Relic | SaaS | Yes | Yes | Yes | Email, Slack, PagerDuty, Webhooks | $25/mo |
| Uptime Kuma | Opensource | Yes | Yes | Yes | Email, Slack, Telegram, Discord, PagerDuty | Free |
| HetrixTools | SaaS | Yes | Yes | Yes | Email, SMS, Telegram, Discord | $9.95/mo |
How to choose the right uptime monitoring tool
With so many options out there, choosing the right uptime monitoring tool can feel overwhelming. But don’t worry, we’ll help you narrow it down based on your business size, technical needs, and budget. Here’s a quick guide to make the decision easier:
Uptime monitoring tools based on your needs
Here’s a quick overview to help you find the best fit for your specific needs.
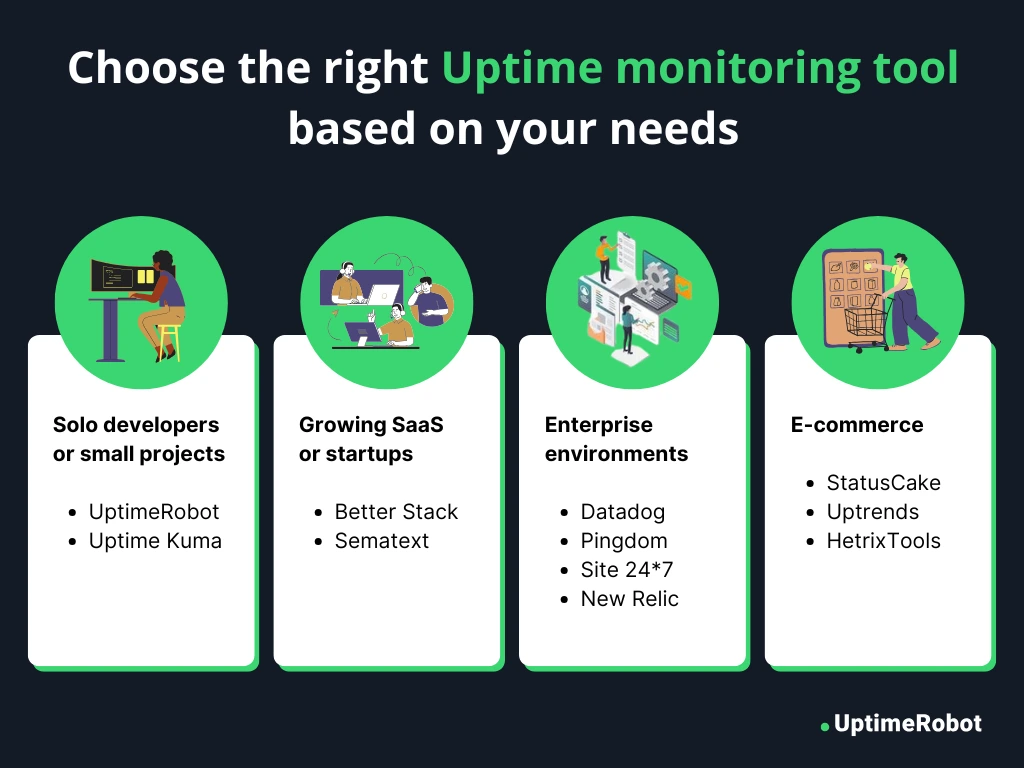
Solo developers or small projects
If you’re running a personal project or working solo, prioritize simplicity, affordability, and ease of use. Choose tools with a generous free tier and essential features like HTTP and SSL monitoring.
Suggested options: UptimeRobot, Uptime Kuma
You’ll benefit from quick setup and reliable alerts without unnecessary complexity.
Growing SaaS or startups
As your product scales, so do your monitoring needs. Look for tools that offer multi-location checks, API and keyword monitoring, and integrations with Slack, PagerDuty, or CI/CD tools.
Suggested options: Better Stack, Sematext
You’ll also want customizable alerts and public status pages to proactively communicate with users.
Enterprise environments
Larger businesses require advanced capabilities, including SLA tracking, audit logs, security compliance, and synthetic browser checks. Support for multiple monitoring types (HTTP, TCP, DNS, SSL, etc.) and detailed analytics is a must.
Suggested options: Uptimerobot, Datadog, Site24x7, Pingdom, New Relic
These tools offer enterprise-grade scalability with deep integrations and robust reporting.
E-commerce
E-commerce platforms can’t afford outages during high-traffic sales periods. You need real-time alerts, transaction monitoring, SSL expiry tracking, and global check coverage.
Suggested options: StatusCake, Uptrends, HetrixTools
These tools help ensure your store remains fast, secure, and accessible 24/7.
Monitoring tools based on the type of monitoring needed
Find the best fit by understanding the monitoring features you require.
Basic monitoring
Perfect for simple websites, blogs, portfolios, or early-stage projects. You mainly need uptime checks for HTTP/HTTPS, ping tests, and SSL expiry alerts. Nothing too complex, just reliable basics.
Good options: UptimeRobot (free tier), Uptime Kuma
These tools are lightweight, quick to set up, and notify you fast when something goes wrong, without overwhelming you with extra features.
Advanced monitoring
If your platform handles logins, dynamic content, or multi-step flows (like checkout or search), basic checks aren’t enough. You’ll need deeper testing: TCP port checks, DNS resolution, keyword checks, and even synthetic user flows.
Good options: Uptimerobot, Sematext, Uptrends, StatusCake
These tools can simulate real user journeys and catch issues like slow load times or broken forms.
API monitoring
For SaaS platforms, mobile apps, and services built on microservices or third-party APIs, uptime is only part of the story. You also need to validate API responses, latency, and error codes across endpoints.
Good options: UptimeRobot, Better Stack, New Relic
These tools help ensure that your APIs return the right data, stay within performance thresholds, and trigger alerts when something fails silently.
Multi-location monitoring
If your user base is global or you’re using a CDN, issues might not be visible from a single region. You’ll want monitoring from multiple geographic locations to detect local outages or slowdowns.
Good options: Uptimerobot, Pingdom, Site24x7, HetrixTools
These tools check your services from different continents and alert you when specific regions go down.
Features to look for in a monitoring tool
Choosing the right uptime monitoring tool means looking closely at the features that best fit your needs. Here are the key factors to consider:
- Check frequency
How often does the tool check your site or service?
- For most businesses, a 1-minute check interval is ideal to catch outages quickly and minimize downtime.
- Smaller projects or less critical sites might be fine with checks every 5 minutes.
- Checks every 10 minutes or more risk missing short outages and delayed alerts.
- Alerting & integrations
How does the tool notify you when something goes wrong?
- Look for multiple alert options such as email, SMS, push notifications, Slack, PagerDuty, or webhooks.
- It should seamlessly integrate with your existing workflows and tools to ensure fast, efficient incident management and reduce response times.
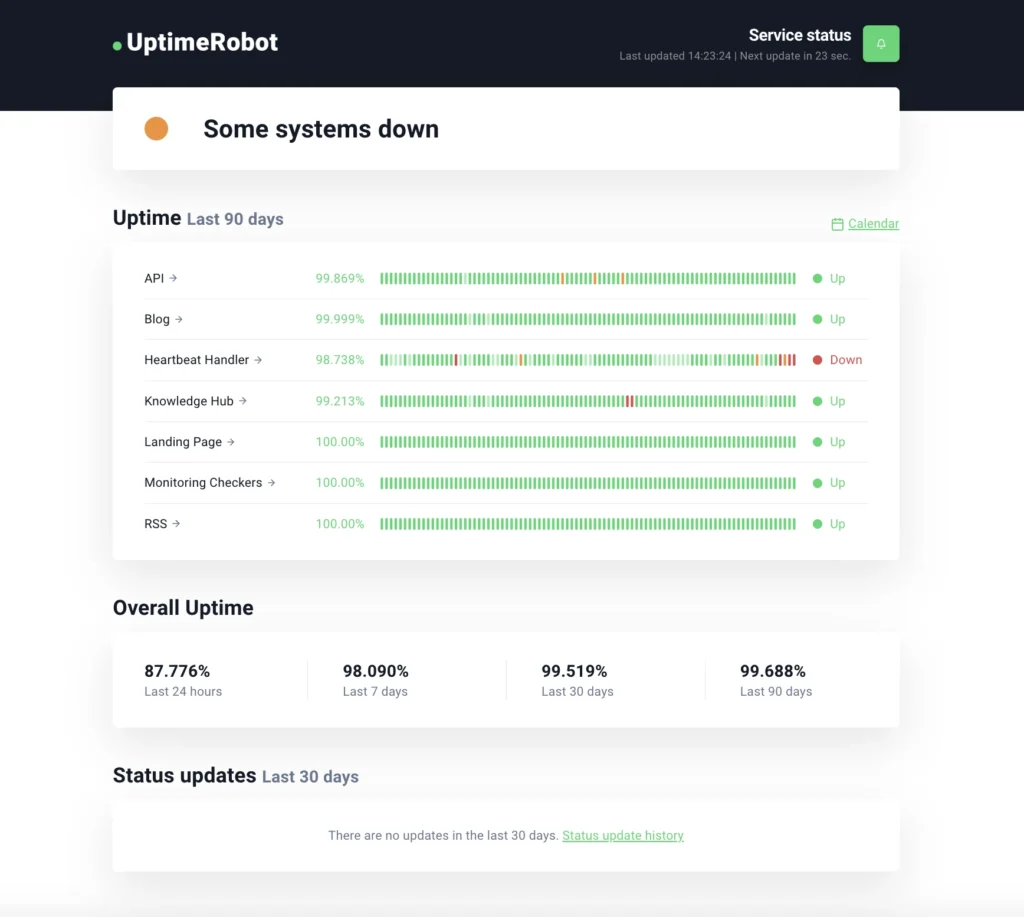
- Dashboard UI/UX Is the interface user-friendly and informative?
- The dashboard should offer clear visualizations, uptime reports, and historical data.
- It should provide quick access to statuses and alerts, allow customization, and be mobile-friendly.
- Public status pages Does the tool offer a public status page?
- Public pages keep your users informed during outages or maintenance.
- This transparency can reduce support tickets and build trust.
- SLA reporting Can the tool generate detailed uptime and incident reports?
- This is essential for businesses with SLAs needing proof of compliance.
- Tracking performance against uptime guarantees helps maintain accountability.
- Privacy & data control (self-hosted vs SaaS) Consider how you want to manage your monitoring data:
- SaaS tools are easy to set up and maintain, but store data on third-party servers.
- Self-hosted solutions, like Uptime Kuma, offer full control over your data and infrastructure but require more technical upkeep.
Uptime monitoring use cases & setup tips
Now that you have an idea of which uptime monitoring tool fits your needs, let’s explore common use cases and practical tips for setting up effective monitoring.
Real-world examples and use cases
Take a look at these important real-world examples that highlight common uptime monitoring use cases:
1. Website and API availability monitoring
Organizations rely on regular checks to ensure that websites, APIs, and servers are up and responsive. Tools like UptimeRobot or Better Stack perform multi-location checks and alert teams the moment an outage occurs.
Real-world example
Netflix uses its internal monitoring system, Telltale, to track the health of its services and APIs globally. Telltale provides real-time alerts and diagnostics, helping Netflix quickly identify and resolve issues before they affect viewers.
2. E-commerce traffic and transaction monitoring
E-commerce sites face massive spikes in traffic during events like Black Friday or flash sales. Monitoring ensures not just uptime but also the smooth functioning of transactions like cart and checkout flows.
Real-world example
Costco’s outage during Black Friday drew widespread customer complaints and revenue loss – a case where proper transaction monitoring could have mitigated the issue.
3. Compliance and audit
Monitoring tools also help businesses stay compliant with regulatory requirements (e.g., GDPR, HIPAA, SOC 2). They log availability, access events, and incident history, creating reliable audit trails.
Real-world example
In 2017, Equifax suffered a major breach compromising the personal information of over 147 million individuals. Delayed detection and lack of real-time monitoring contributed to the scale of the damage. Proactive monitoring could have helped detect vulnerabilities and prevent such a large-scale impact.
Tactical tips for effective uptime monitoring
Use these practical tips to fine-tune your alert settings and monitoring checks for better accuracy, faster response, and fewer distractions.
1. Set smart thresholds
Instead of triggering an alert after just one failure, configure your tool to notify you only after multiple consecutive failures (for example, two or three). This helps filter out temporary glitches, network hiccups, or false positives that don’t require immediate action, allowing your team to focus on genuine problems.
2. Prevent alert fatigue
Receiving too many alerts can overwhelm your team and cause important notifications to be missed. Use escalation policies to prioritize critical incidents, group similar alerts together, and limit notification channels to only those essential for your workflow.
3. Leverage multiple check locations
Monitoring your site or app from just one location can miss regional outages or CDN performance issues. By setting up checks from multiple geographic locations, you gain a more accurate picture of global availability and user experience. This also helps quickly identify if an issue is localized or widespread, speeding up troubleshooting and resolution.
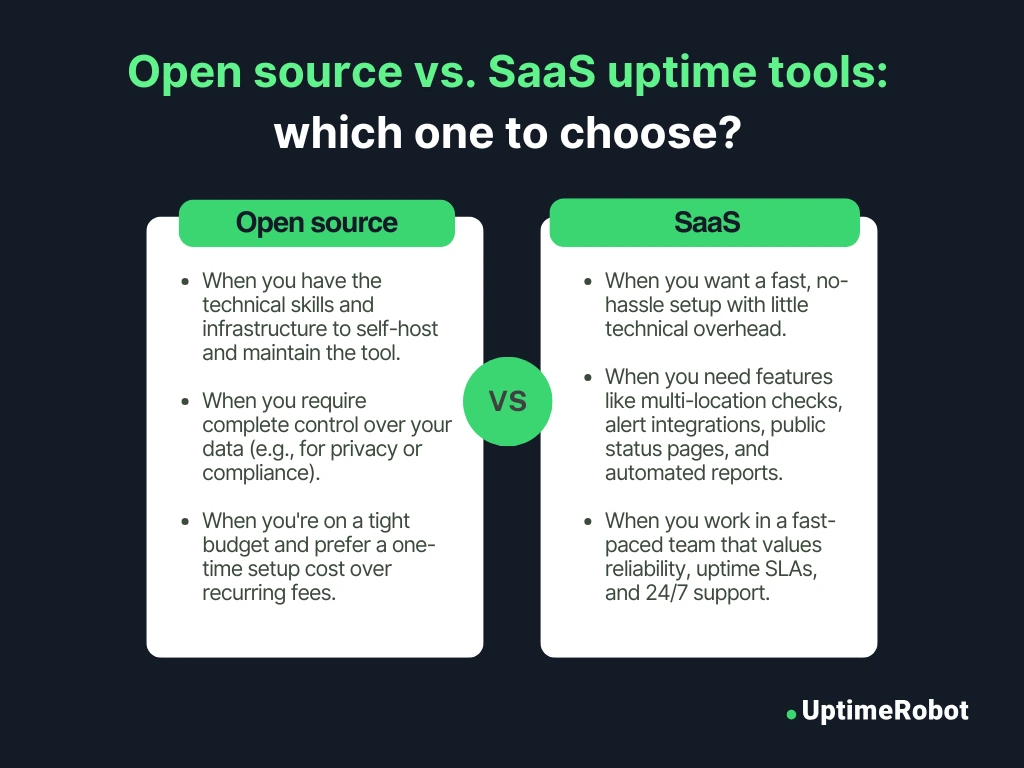
Open source vs. SaaS uptime tools: Which one to choose?
When choosing an uptime monitoring solution, you’ll likely come across two main categories: open source and SaaS (Software-as-a-Service) tools. Understanding how they differ will help you choose the right fit for your team, infrastructure, and budget.
When to use open-source monitoring tools
Open source tools are self-hosted and free to use. You install them on your own servers, giving you full control over setup, customization, and data. Popular options include: Uptime Kuma, Zabbix, and Nagios.
Best for you if:
- You have the technical skills and infrastructure to self-host and maintain the tool
- You require complete control over your data (e.g., for privacy or compliance)
- You’re on a tight budget and prefer a one-time setup cost over recurring fees
Downside: While open source tools save on costs and offer flexibility, they require more time to set up, monitor, and maintain. You’ll also need to handle updates, scaling, and security.
When to use SaaS monitoring tools
SaaS tools are hosted solutions managed by the provider. Just sign up, configure your checks, and you’re good to go. Popular examples include: Uptimerobot, Better Stack, UptimeRobot, and Pingdom.
Best for you if:
- You want a fast, no-hassle setup with little technical overhead
- You need features like multi-location checks, alert integrations (Slack, PagerDuty, etc.), public status pages, and automated reports
- You work in a fast-paced team that values reliability, uptime SLAs, and 24/7 support
Downside: SaaS tools come with ongoing subscription costs, and your monitoring data lives on third-party infrastructure. However, the ease of use and comprehensive features often outweigh the costs for many teams.
Best of both worlds: Hybrid monitoring strategies
Many organizations are adopting a hybrid approach that combines open source and SaaS uptime monitoring tools to balance flexibility, reliability, and cost-efficiency. This strategy allows teams to maintain full control over sensitive systems while benefiting from the ease, scalability, and advanced features of cloud-based solutions.
Why go hybrid:
- Redundancy: Using two systems ensures you don’t miss critical outages if one tool fails.
- Data control + convenience: Self-host open source tools (like Uptime Kuma) to monitor internal services or on-prem systems, while offloading public-facing uptime checks and SLA tracking to a SaaS solution.
- Cross-verification: Comparing uptime metrics from both sources helps eliminate false positives, builds compliance confidence, and ensures higher reliability.
Example hybrid setup:
Use Uptime Kuma to monitor internal applications and services behind a firewall. At the same time, use UptimeRobot, Better Stack or Pingdom to monitor public-facing endpoints and integrate with Slack, PagerDuty, or email for instant alerts and status updates.
Future of uptime monitoring: Trends to watch
As digital infrastructure becomes more complex and user expectations rise, uptime monitoring tools are evolving rapidly. Here are four key trends shaping the future of this space.
1. AI-based anomaly detection
AI and machine learning transform uptime monitoring by proactively detecting anomalies and predicting failures, rather than relying on static thresholds or reactive alerts.
Modern AI-driven systems analyse vast amounts of telemetry data across multiple metrics simultaneously (up to 50+ indicators), identifying subtle failure patterns with approximately 90% accuracy. This advanced analysis reduces mean time to detect and resolve incidents by more than 7 minutes on average.
By predicting failures before they impact users, organizations can significantly cut unplanned downtime and improve overall reliability.
2. Blending synthetic checks with real user monitoring (RUM)
Combining synthetic checks, which are automated tests of critical transactions and APIs, with real user monitoring (RUM) offers a comprehensive view of both uptime and user experience.
Synthetic monitoring continuously tests key paths and APIs from multiple global locations and quickly detects outages. Meanwhile, RUM captures actual user interactions and performance data, validates synthetic results, and reveals real-world impact.
Together, this hybrid approach helps teams identify and fix issues early, link user frustration to backend problems, and optimize both reliability and user experience.
Tools like Pingdom and New Relic provide integrated solutions that blend synthetic checks with live user data, uncovering bottlenecks by geography or device.
3. Monitoring serverless and microservices architectures
Containerized workloads and serverless computing are growing rapidly. This growth has made environments much more complex, as companies now manage hundreds of microservices. Today’s uptime monitoring tools need to handle distributed tracing, collect detailed telemetry, and manage alerts across lots of short-lived components.
Thanks to AI, these systems can automatically map how services connect and help pinpoint root causes quickly, cutting troubleshooting time by as much as 60%.
Platforms like AWS CloudWatch and Dynatrace now offer built-in support for monitoring serverless environments such as AWS Lambda, making it easier to keep everything running smoothly.
4. Regulatory and compliance requirements
With data privacy and security regulations becoming stricter, uptime monitoring tools now need to provide clear audit trails, strong data protection, and comprehensive compliance reports. Industries like healthcare and finance rely on monitoring solutions that include compliance checks and alert systems to detect potential policy violations early.
Many monitoring platforms are enhancing their compliance capabilities to meet these needs. Features such as detailed audit trails, SLA reporting, and GDPR-ready data handling are becoming standard.
For example, tools like Site24x7 and Status.io offer downloadable SLA reports and access logs, which are essential for SOC 2 and HIPAA audits.
Final thoughts: Which tool is right for you?
You’ve explored the top 11 uptime monitoring tools in 2026, including their features, pros, and cons. Here’s a quick summary to help you choose the best fit based on your needs:
- Solo developers & small projects: UptimeRobot, Uptime Kuma
- Growing SaaS & startups: Better Stack, Sematext
- Enterprise: UptimeRobot, Datadog, Site24x7, Pingdom, New Relic
- E-commerce: StatusCake, Uptrends, HetrixTools
If you’re still unsure where to begin, we recommend starting small. UptimeRobot is a simple, reliable tool with a generous free tier, offering 50 monitors and 5-minute check intervals, plus easy setup and essential features to keep your site secure and monitored. You can start monitoring in just 30 seconds.
FAQ
-
Uptime monitoring is the process of continuously checking whether your website, server, or service is available and working properly. It’s important because even a few minutes of downtime can lead to lost revenue, customer frustration, and damage to your brand’s reputation. Monitoring tools help you detect issues early and fix them before users notice.
-
These tools regularly perform checks (HTTP, ping, port, DNS, etc.) from multiple locations to ensure your website or service is online. If something goes wrong, they alert you via email, SMS, Slack, or other channels. Some tools also simulate real user actions or monitor API responses to detect deeper issues.
-
Uptime monitoring checks whether your service is available, while performance monitoring focuses on how well it works (speed, resource usage, errors). You need both to ensure a smooth, uninterrupted user experience.
-
Yes. Even for personal sites or side projects, uptime monitoring ensures your site is always accessible. Tools like UptimeRobot offer free plans with enough features for small-scale monitoring.
-
The industry standard is 99.9% uptime, which equals about 43 minutes of downtime per month. For mission-critical services, aim for 99.99% or even 99.999% (five nines). Many tools help you measure and maintain your uptime target.
-
Common check types include:
- HTTP/HTTPS: Verifies website availability
- Ping: Tests server responsiveness
- TCP/Port: Checks open ports for services like SSH, FTP, etc.
- DNS: Ensures your domain resolves correctly
- SSL/TLS: Monitors certificate status and expiration
- Synthetic user flows: Simulates user interactions like logins or purchases
-
Yes. Frequent outages and slow load times can negatively impact your search engine rankings. Google considers site reliability and speed as ranking factors, so using monitoring tools helps you stay competitive.
-
Yes. Tools like UptimeRobot offer free plans with basic monitoring features. They’re ideal for small websites, developers, and teams just getting started.
-
Public status pages allow you to communicate outages and incidents with transparency. This reduces support tickets and builds trust with users by keeping them informed during downtimes or maintenance windows.
-
For most businesses, 1-minute check intervals are ideal to catch outages quickly. Less critical websites might be fine with 5- or 10-minute intervals. Most tools let you customize this based on your needs and plan.
-
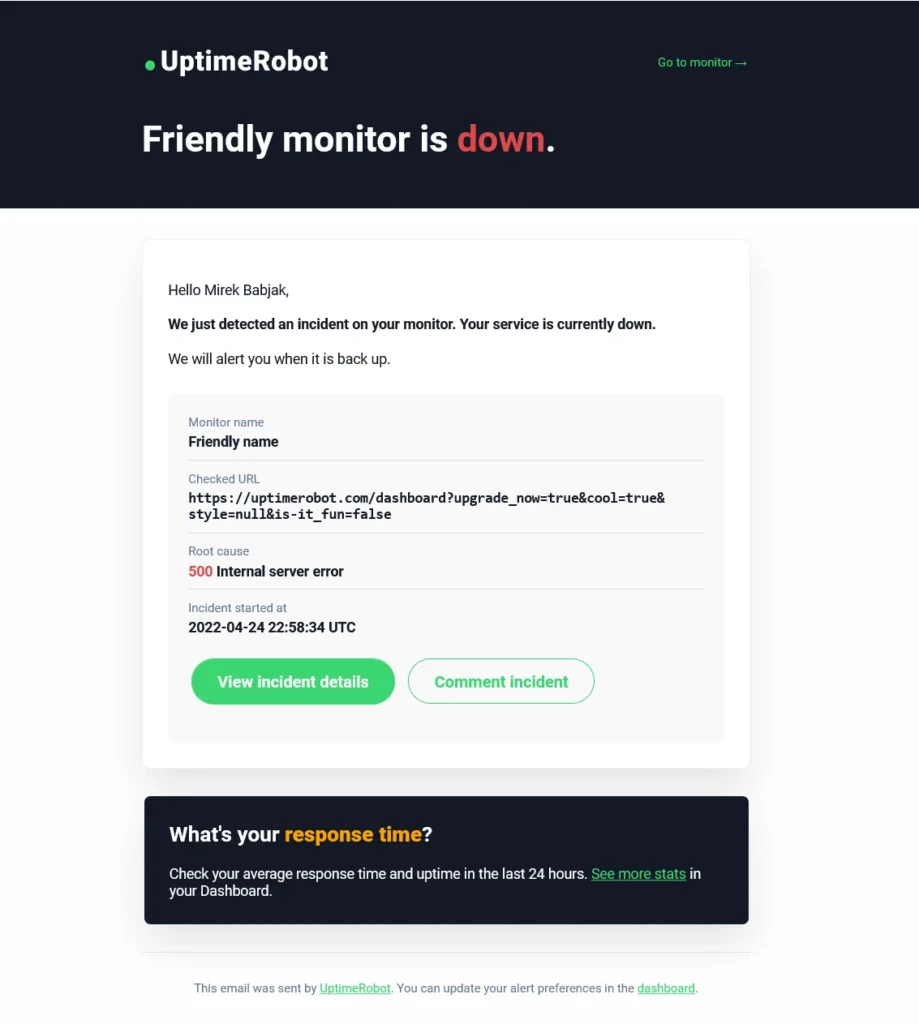
The tool will instantly send alerts to your chosen channels (email, Slack, SMS, etc.). Many also include diagnostics like traceroutes, error codes, or screenshots to help you troubleshoot faster.