Infrastructure monitoring tools give you real-time visibility into your servers, networks, and applications. Think of them like your car’s dashboard.
Instead of opening the hood every time, you glance at the dashboard to see fuel, speed, or engine warnings. Similarly, infrastructure monitoring tools identify issues in your IT systems before they escalate into full-blown breakdowns.
Read on as we explore the best infrastructure monitoring tools of 2026 and show you how to pick the one that fits your organization’s needs.
What are infrastructure monitoring tools?
Infrastructure monitoring tools track the health and performance of your IT systems (servers, VMs, databases, APIs, and cloud services) so teams can spot issues before users do.
Instead of manually checking logs or uptime, these tools collect key metrics (CPU, memory, latency, response times) and alert you when something breaks or slows down. Most also visualize data in real time through dashboards that highlight trends and anomalies.
Monitoring matters because it keeps critical services available, secure, and cost-efficient. By catching small problems early, teams can prevent outages, reduce mean time to resolution (MTTR), and optimize resource use.
Core capabilities include:
- Metric collection: Captures performance data from servers, containers, and apps.
- Real-time alerts: Notifies teams when thresholds are breached.
- Dashboards: Turns raw data into visual insights for faster troubleshooting.
- Diagnostics: Correlates metrics and logs to pinpoint root causes.
- Automation: Some tools can auto-restart services or scale resources when failures occur.
Key takeaways:
- Infrastructure monitoring keeps systems fast, stable, and secure by spotting issues before users do.
- The best tools balance depth (metrics, logs, traces) and ease of use (dashboards, alerts, integrations).
- Startups often need simple uptime checks; enterprises require full observability across clouds and apps.
- Expect to choose between agent-based, agentless, and open-source setups. Each has trade-offs in depth, cost, and complexity.
- Pricing models vary widely (per host, per check, per GB). Hidden costs often come from alert volumes and data retention.
- Modern trend: AI-driven alerting (AIOps), OpenTelemetry, and monitoring-as-code are shaping next-gen infrastructure visibility.
- Start small, scale smart. Begin with a lightweight tool like UptimeRobot, then expand into deeper observability solutions as your infrastructure grows.

Key features to look for
When evaluating infrastructure monitoring tools, you’ll find plenty of options, each with an overwhelming list of features. It’s easy to get lost in the noise. Instead, focus on the essentials that make the biggest difference in your daily operations.
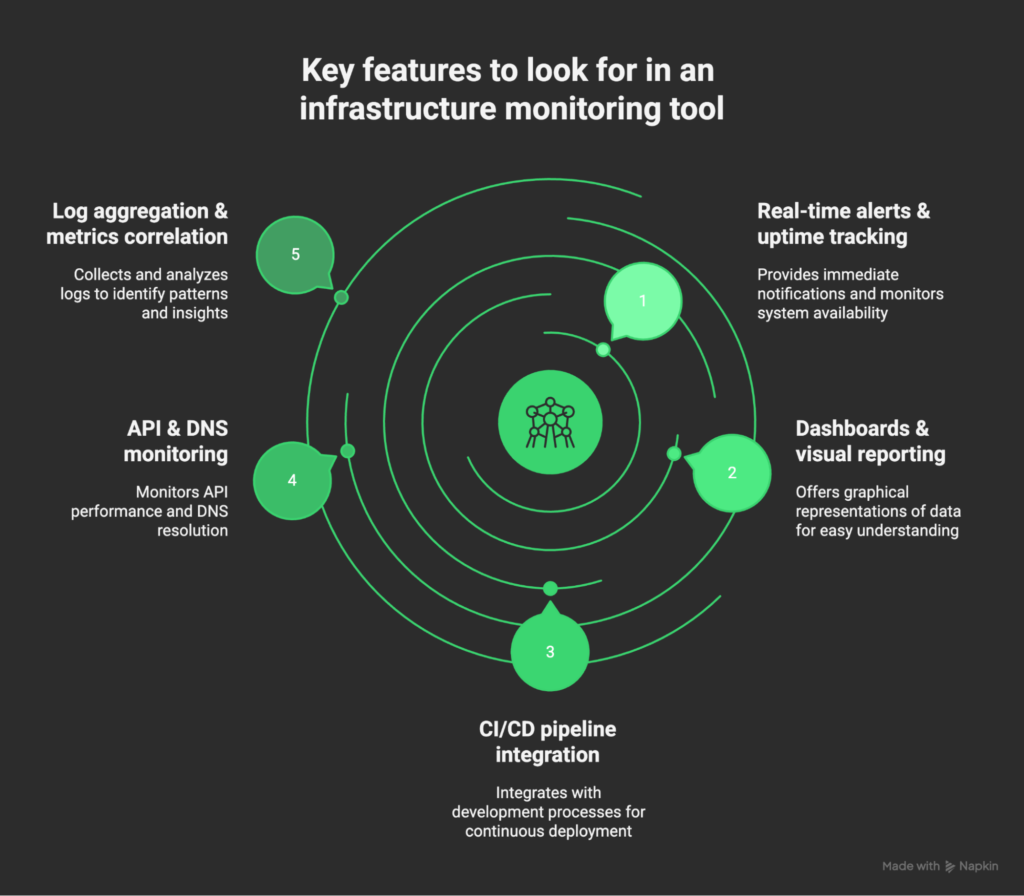
Minimize downtime through instant alerts and uptime monitoring
Downtime is costly. Make sure your monitoring tool provides instant alerts when systems or services fail. Ideally, with configurable thresholds so you’re only notified when action is required. Too many alerts can create noise and lead to alert fatigue.
Gain clarity with dashboards and visual reporting
Raw data is useless without context. Look for customizable dashboards that give engineers a clear, real-time view of infrastructure health, but also offer high-level reporting for leadership. A good dashboard helps you answer both: “What broke?” and “How are we trending over time?”
Improve release confidence with CI/CD integration
Modern infrastructure is dynamic. New code, containers, and services are constantly deployed. A strong monitoring tool integrates with CI/CD pipelines, helping teams catch performance regressions early and monitor changes as they roll out.
Safeguard user experience with API monitoring and DNS health checks
Your users often interact with APIs and DNS before they ever hit your core applications. If your monitoring tool doesn’t track these, you’re flying blind. Look for synthetic checks and DNS monitoring so you can confirm availability and response times from a user’s perspective.
Our tip: Try our API monitoring feature
Troubleshoot smarter with metrics and log aggregation
Not all monitoring platforms approach data the same way. Some focus on metrics (lightweight, time-series data like CPU, memory, latency), while others emphasize logs (detailed event data). Metrics give you the “what,” logs give you the “why.”
The best tools let you correlate both, so you can move from detecting an anomaly to understanding its root cause without switching platforms.
Types of infrastructure monitoring tools
Monitoring tools generally differ by how they collect data, how they’re licensed, and how they integrate. Understanding these categories helps you choose what fits your environment and team.
Agent-based vs. agentless
Agent-based tools install lightweight software on each host to collect granular data (CPU, memory, transactions, logs) even when remote access fails.
Agentless tools rely on protocols like SNMP, WMI, or APIs to pull data remotely, skipping installation but capturing less detail.
| Pros | Cons | |
| Agent-based | Deep visibility, works offline, ideal for app-level monitoring | Requires installation and maintenance on every host |
| Agentless | Quick to deploy, no software footprint | Limited data depth, can miss app-level insights |
Open source vs. commercial
Open source tools like Prometheus and Grafana offer flexibility and are often free or without licensing fees, but they demand setup and maintenance expertise.
Commercial platforms such as Datadog or LogicMonitor deliver faster deployment, scalability, and vendor support at a higher cost.
| Pros | Cons | |
| Open source | Free, customizable, strong community support | Requires in-house expertise, limited enterprise support |
| Commercial | Turnkey setup, enterprise support, advanced features out of the box | Licensing costs, less flexible than open source |
All-in-one platforms vs. modular toolchains
All-in-one platforms combine monitoring, logging, and alerting in one interface, which are perfect for smaller teams that want simplicity and a unified view.
Modular toolchains stitch together specialized tools for metrics, logs, and traces, giving advanced teams more control and flexibility at the cost of extra maintenance.
| Pros | Cons | |
| All-in-one platforms | Unified dashboards, simple setup, one vendor | Vendor lock-in, less customization |
| Modular toolchains | Highly flexible, best-of-breed customization; avoids lock-in | Complex integration, higher maintenance overhead |
Feature comparison: Top infrastructure monitoring tools
Before diving in, here’s a quick look at the tools on our best-of list and how their basic features compare.
| Tool | Uptime monitoring | Log management | Trace collection | Alerting and notification |
| UptimeRobot | Excellent for website, API, and DNS uptime checks | Not supported | Not supported | Real-time alerts via email, SMS, Slack, Teams, or webhooks |
| Better Stack | Robust uptime monitoring with status pages | High-speed log ingestion and search | Limited (focus on logs & uptime) | Advanced, customizable alerts with anomaly detection |
| Datadog | Monitors uptime across hybrid and cloud systems | Centralized log management with AI-based insights | Full distributed tracing for applications | Intelligent, AI-driven alerting and correlation |
| LogicMonitor | Comprehensive uptime tracking for hybrid environments | Log analysis with AI-assisted insights | Basic tracing through integrations | Predictive alerts with anomaly detection |
| Prometheus + Grafana | Supports uptime via custom exporters | Log visualization via Grafana integrations | Basic tracing through OpenTelemetry | Manual alert configuration via Alertmanager |
5 top infrastructure monitoring tools in 2026
Let’s look briefly at the 5 best infrastructure monitoring tools in 2026.
UptimeRobot
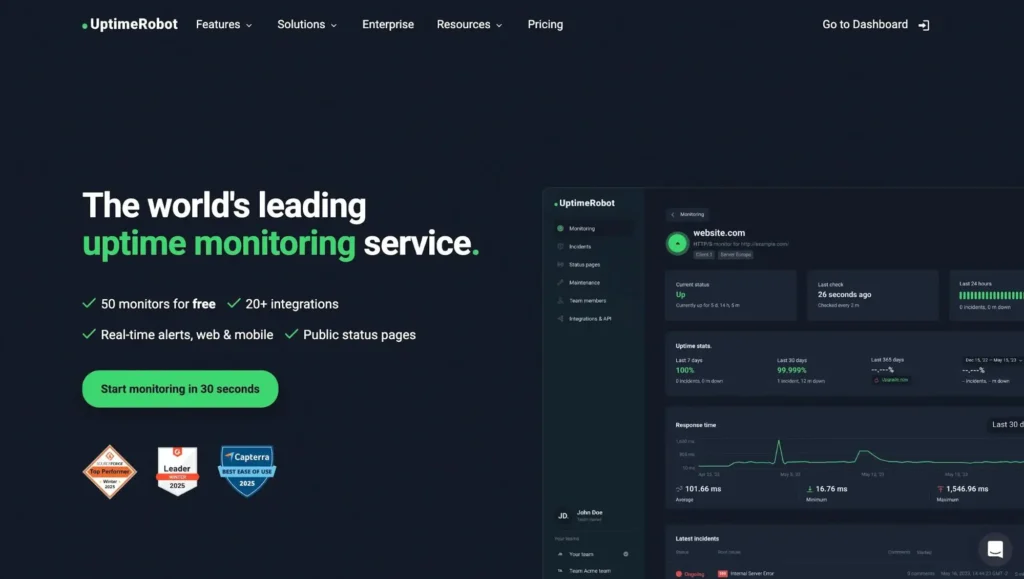
UptimeRobot is a lightweight, affordable monitoring tool built for startups and growing teams that need reliability without complexity. It focuses on uptime and API checks, helping you keep websites, servers, and key services online without drowning in dashboards or setup time.
Key features:
- Monitors websites, servers, ports, APIs, and DNS health from multiple global locations.
- Sends real-time alerts via email, SMS, Slack, Teams, or webhook integrations.
- Provides built-in status pages to share with customers for transparent communication during incidents.
- Supports customizable checks, including HTTP(s), ping, and keyword monitoring.
- Enables quick setup with an intuitive interface, ideal for teams without a dedicated DevOps function.
- Offers a generous free tier (50 monitors with 5 minute checks) and budget-friendly paid plans for scaling needs.
Why users love UptimeRobot: Unlike heavier enterprise platforms, UptimeRobot keeps monitoring simple and fast. You set it up in minutes, get instant alerts when something goes down, and share real-time status pages with customers all without a steep learning curve or bloated dashboards.
It’s ideal for startups, small teams, or anyone who wants reliable uptime visibility without enterprise-level overhead.
Pro tip: Skip the heavy setup. If you just want reliable uptime checks and clean status pages, start with UptimeRobot – it does the essentials better than most.
Datadog
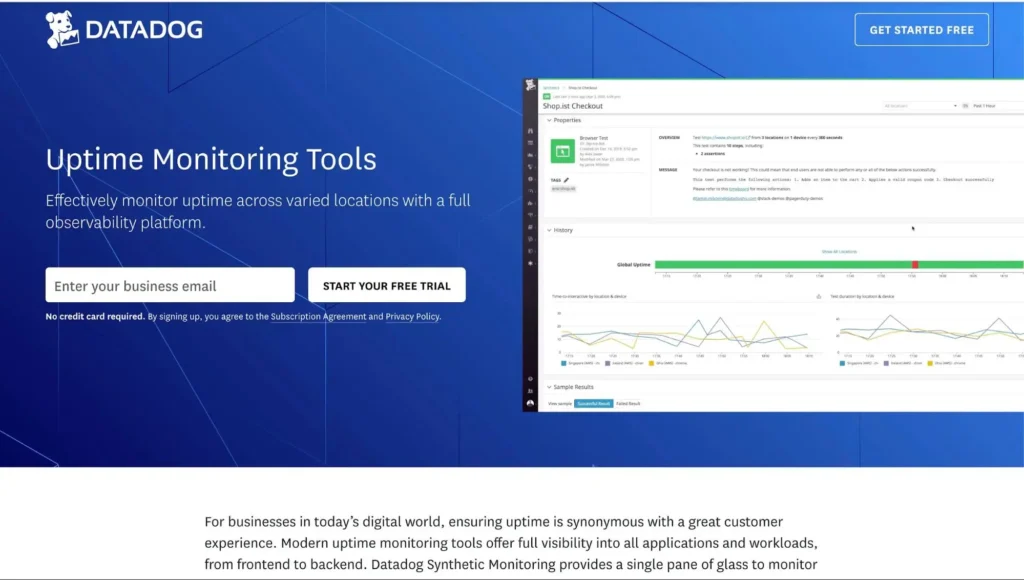
Datadog is an enterprise-grade observability platform that monitors everything from servers and containers to cloud services and apps. It brings metrics, logs, and traces together in one place, giving DevOps teams full-stack visibility and faster root-cause analysis.
Why it stands out: Datadog’s 600+ integrations and AI-driven analytics make it one of the best options for large, complex environments. It scales easily, automates event correlation, and surfaces performance issues before users even notice.
Key features:
- Monitors servers, containers, databases, APIs, and cloud services at scale
- Powerful dashboards and AI-based insights
- Wide range of DevOps integrations
Best for: Enterprises and mature SaaS teams that need a single, unified observability platform and have the budget to match.
Prometheus + Grafana
Prometheus and Grafana together form one of the most popular open-source monitoring stacks. Prometheus handles data collection and alerting, scraping time-series metrics from your infrastructure. Grafana turns that data into rich, customizable dashboards for analysis and visualization.
Why it stands out: This stack offers complete flexibility and control. You can customize every part of your monitoring setup, integrate it with Kubernetes or OpenTelemetry, and scale it as your environment grows, all without licensing costs.
Key features:
- Prometheus scrapes and stores time-series metrics with built-in alerting
- Grafana visualizes data through highly customizable dashboards
- Open-source, extensible, and backed by a strong developer community
Best for: Technical teams that want full control, flexibility, and zero licensing costs.
LogicMonitor
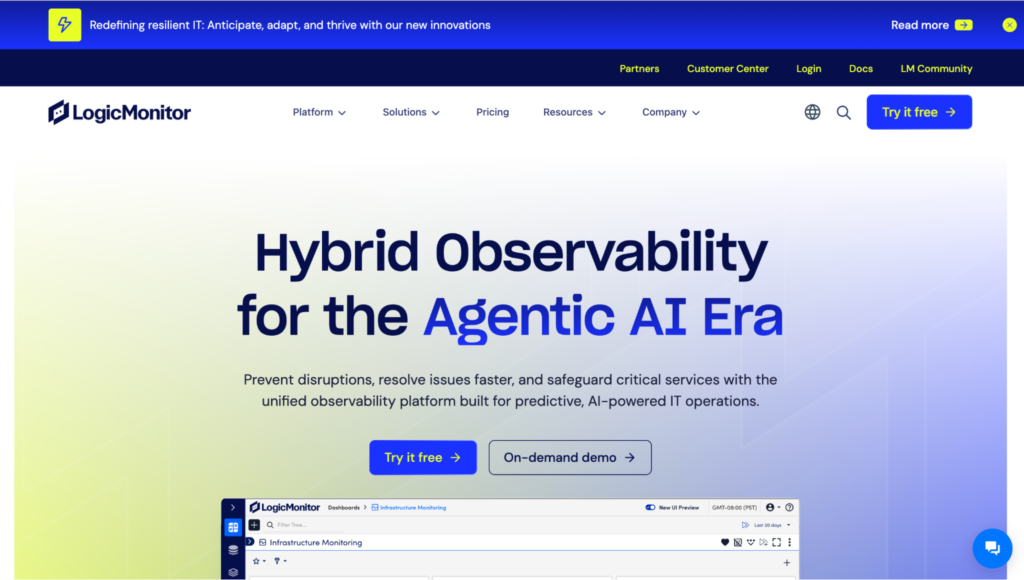
LogicMonitor is a cloud-based observability platform built to monitor hybrid and multi-cloud infrastructures from one dashboard. Its flagship platform, LM Envision, gives teams a unified view of networks, applications, and cloud resources, with AI-powered insights that help predict issues before they escalate.
Why it stands out: LogicMonitor combines deep integrations with predictive analytics, automatically discovering devices and mapping dependencies across your infrastructure. It’s built for scale and visibility without needing heavy manual configuration.
Key features:
- Broad integrations with cloud providers, network gear, and enterprise tools
- Automatic discovery and dependency mapping
- Predictive alerts powered by machine learning
Best for: Large organizations running complex hybrid or multi-cloud environments that want AI-assisted monitoring with minimal manual setup.
Better Stack
Better Stack combines uptime monitoring, log management, and incident response in one clean, developer-friendly platform. Its real-time dashboards and lightning-fast log search make it easy for teams to spot and resolve issues before users notice.
Why it stands out: Better Stack pairs strong functionality with a great user experience. The interface is fast, intuitive, and collaborative, which is ideal for teams that want effective observability without bulky enterprise software.
Key features:
- Uptime, log management, and status pages in one platform
- Collaborative dashboards with modern UI/UX
- On-call scheduling and escalation tools for incident response
Best for: DevOps and engineering teams that want reliable observability and polished design in one place.
Curious how it compares? Check out our full UptimeRobot vs. Better Stack comparison.
How to choose the right monitoring tool
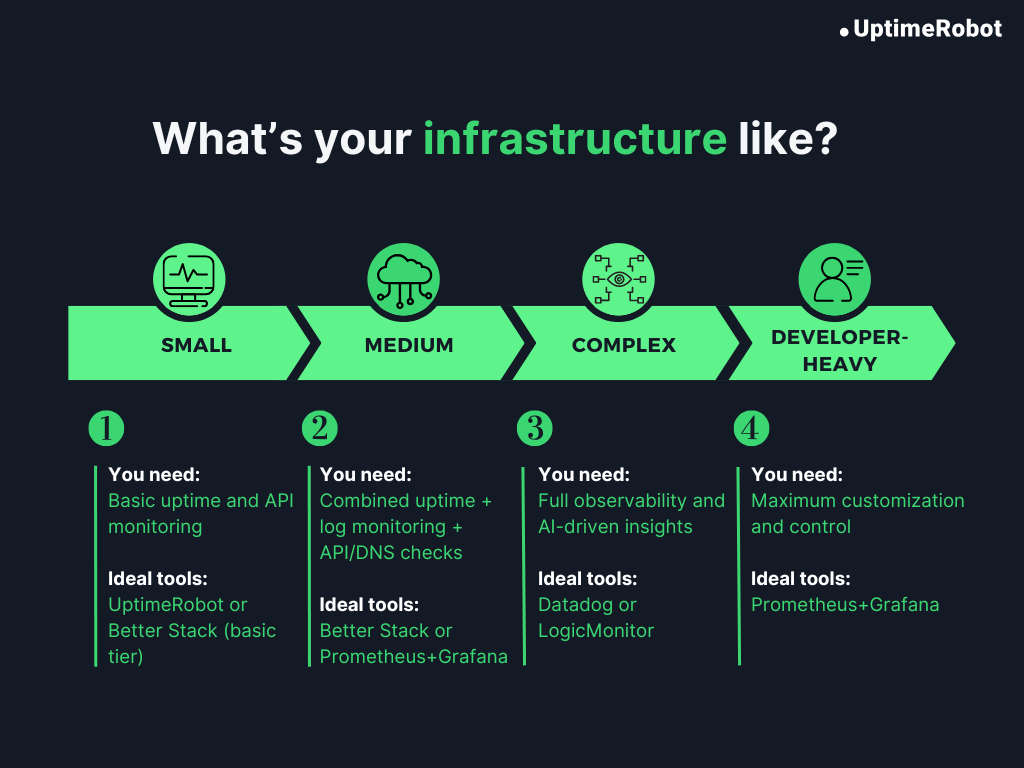
Choosing the right monitoring setup depends on your team size, infrastructure, and experience. Here’s a quick framework:
- Scope: Match the tool to your scale. Startups with a few servers need simple uptime and API checks; large enterprises need full observability across clouds and microservices.
- Compatibility: Pick a tool that fits your stack – Kubernetes, AWS, on-prem, or hybrid.
- Pricing model: Understand how each platform charges (per host, per check, or per GB). Check for hidden costs like alert volume or data retention.
- Learning curve: Open-source tools offer flexibility but require expertise. Managed platforms are easier to deploy but limit customization.
Pro tip: If you’re testing several options, run them side by side for a week. Compare how fast they detect issues, how noisy their alerts are, and how easy the dashboards are to interpret.
Cost comparison & licensing models
Pricing is often the deciding factor when picking a monitoring tool. Most platforms use one of three models:
| Model | How it works | Example tools | Best for |
| Host-based | You pay per host, container, or instance. Costs rise as your infrastructure grows. | Datadog, LogicMonitor | Enterprises with predictable, high-volume infrastructure |
| Monitor-based | Pricing depends on the number of checks (sites, APIs, ports). | UptimeRobot | Startups and SMBs focused on uptime and simplicity |
| Bundled | One subscription covers multiple features like uptime, logs, and incidents. | Better Stack | Teams wanting a single, predictable monthly bill |
As with most services, there can be hidden fees or unclear terms to watch for.
Hidden costs to watch for:
- High alert volumes or long data-retention periods
- Add-ons like tracing, advanced analytics, or premium support
- Scaling usage (more checks, more GBs, or extra hosts)
Pro tip: Estimate what your infrastructure will look like six months from now, not just today. That future-state projection helps you avoid surprise overages later.
Real-world use cases
Monitoring needs vary depending on the size and complexity of your infrastructure. Here are a few real-world scenarios that show how different types of teams use monitoring tools to stay proactive, reliable, and efficient.
Small business tracking uptime across multiple domains
A small e-commerce company runs several regional websites and uses UptimeRobot to monitor uptime across all domains. Instant alerts via Slack or email help them fix issues before customers even notice, keeping revenue steady and operations simple.
Mid-size SaaS using API and DNS monitoring to avoid customer-impacting bugs
A growing SaaS team uses Better Stack and UptimeRobot to monitor API response times and DNS health. When latency spikes or propagation fails, they get notified within seconds and can trace root causes directly in logs, preventing minor bugs from turning into downtime.
Enterprise scaling observability across hybrid cloud environments
Enterprises managing thousands of microservices across AWS, Azure, and on-prem use Datadog or LogicMonitor for unified observability. AI-driven anomaly detection and dependency mapping help them spot capacity issues early and maintain uptime at global scale.
The future of infrastructure monitoring
Infrastructure monitoring is evolving rapidly. Advanced AI algorithms are transforming how organizations track, analyze, and manage their systems. Here are the key trends shaping the future of infrastructure monitoring.
AI/ML for smarter alerting
AI-based monitoring tools are helping teams deal with one of the biggest problems in operations: too many alerts.
Modern AIOps platforms filter noise, group related events, and highlight the few that actually need attention, cutting redundant alerts by as much as 97%. Instead of reacting to every ping, teams can focus on what’s real and fix issues before users notice.
Shift toward observability
Traditional monitoring is giving way to full observability. Instead of tracking servers or networks in isolation, observability connects data from apps, infrastructure, and user experiences into one view.
This unified approach helps teams spot issues faster and understand why they happen, not just that they happened. IBM reports that companies adopting observability have seen incidents drop by up to 90%, while those delaying the shift face higher technical debt and slower recovery times.
OpenTelemetry and vendor-neutral integrations
Teams are leaning on open standards to keep observability flexible and affordable. OpenTelemetry has become the go-to framework for collecting metrics, logs, and traces from different tools. It uses a shared format and consistent tags so data from across your stack actually lines up, making it easier to see what’s happening without being tied to one vendor.
According to Splunk’s State of Observability Report 2024, 78% of tech leaders now use OpenTelemetry, and 57% have reduced observability costs as a result.
Monitoring Infrastructure as Code (IaC)
As Infrastructure as Code (IaC) becomes standard, teams are starting to apply the same approach to monitoring. Alerts, dashboards, and rules are now defined as code and version-controlled alongside infrastructure. This means every new resource comes with monitoring built in, no manual setup, no drift.
The State of IaC 2025 report by Firefly shows 89% adoption, a clear sign that automation is now the norm in DevOps. Extending that automation to monitoring keeps systems aligned, consistent, and ready to scale.
Conclusion
Downtime costs companies billions every year, but preventing it doesn’t have to mean overcomplicating your stack. The right monitoring setup keeps systems fast, stable, and visible without adding noise or expense.
There’s no single “best” platform, only what fits your scale and workflow. Startups often just need simple uptime checks, while larger teams benefit from deeper observability and automation.
If you’re starting fresh, UptimeRobot is an easy entry point: quick to deploy, affordable, and reliable. It gives you a solid foundation before you expand into full observability tools like Datadog, LogicMonitor, or Better Stack.
Want to get 50 monitors with 5 minute checks? Sign up for UptimeRobot now and start monitoring in minutes.
FAQ's
-
They track the health, performance, and availability of your IT systems. By collecting and visualizing data in real time, they help you spot issues early and keep services running smoothly.
-
Monitoring tells you when something’s wrong. Observability helps you understand why. It combines metrics, logs, and traces for a complete view of system behavior.
-
Start with metrics. They give you broad visibility. Add logs and traces as your stack grows. Together, they form the “three pillars” of observability.
-
Agent-based tools offer deeper insights but require installation. Agentless options are easier to deploy but capture less detail. Many teams mix both: agents for critical systems, agentless for quick coverage.
-
Most modern tools integrate with AWS, Azure, and GCP via APIs while also supporting on-prem agents. The result is a single dashboard for your full hybrid environment.
-
Start simple:
- CPU, memory, and disk usage
- Network throughput and latency
- Application response time and error rates
- Uptime or availability
-
Set clear thresholds, use severity levels, and group related alerts into incidents. On-call rotations and escalation rules also keep the noise manageable.
-
Costs usually depend on your number of hosts, data retention period, and feature depth. Begin with core coverage and expand as your infrastructure grows.
-
Yes. Synthetic monitoring can test endpoints for uptime, response time, and valid results, catching issues before users do.
-
If customers rely on your services, yes. A public status page builds trust and reduces support tickets by showing real-time updates during incidents.