The cost of downtime is high. Every minute your website or API is unavailable means lost revenue, damaged customer trust, and a drop in SEO ranking. You can’t avoid downtime completely, but you can minimize its impact by acting quickly.
Uptime monitoring is your first line of defense. It alerts you the moment something goes wrong so you can respond fast and keep losses to a minimum.
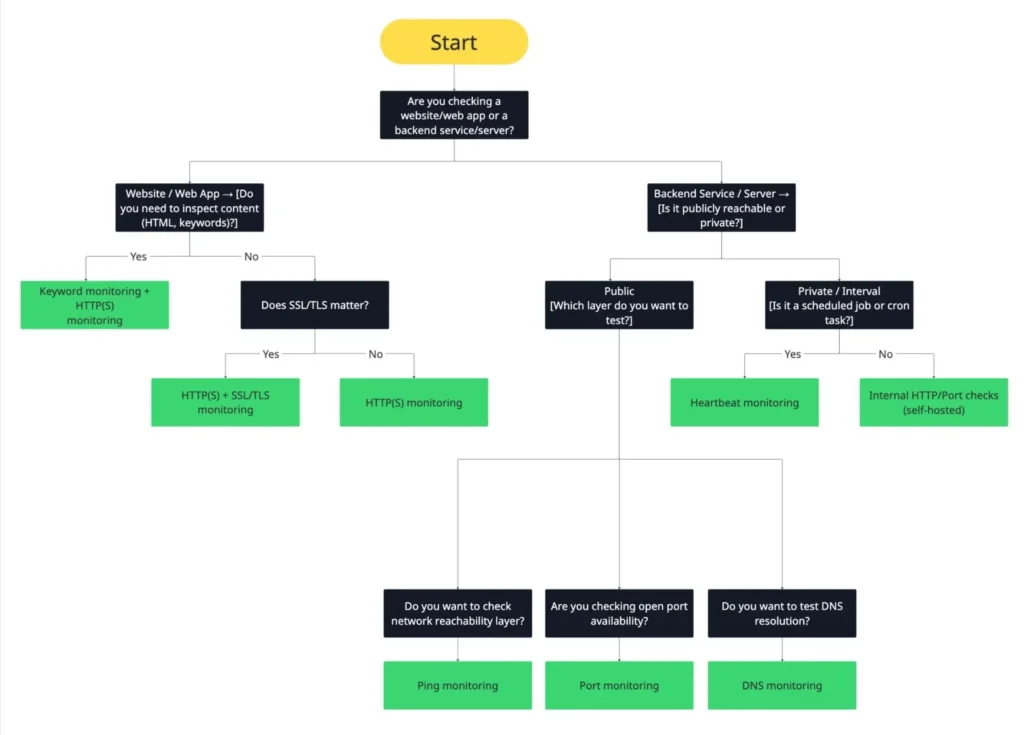
There are several types of uptime monitoring, and each focuses on a different layer of your service. If you choose the wrong one, you might end up with false positives or missed failures. Choose wisely, and you’ll spot issues before your customers ever notice them.
This guide walks you through every major uptime monitoring type, including what each one does and when and how to use them.
Before we dive in, here’s a quick look at how different monitoring layers fit together:
- Synthetic (active) monitoring: Simulated probes that periodically test your service, such as HTTP, ping, or DNS checks.
- Real user (passive) monitoring: Data collected from real users that reflects their experience.
- External checks: Run from public networks to confirm true external availability.
- Internal checks: Run from within your infrastructure to validate private systems and internal jobs.
Together, these layers form the foundation of reliability, observability, and SLO tracking, helping you measure performance, understand failures, and continuously improve uptime.
Key takeaways:
- Uptime monitoring ensures your site or service stays reliable, available, and trusted.
- Each monitor type (HTTP, ping, DNS, SSL, keyword, heartbeat) checks a different layer of your stack.
- No single check is enough; combine multiple monitors for complete coverage.
- Use HTTP(S) for application health, SSL for security, and keyword for content accuracy.
- Add DNS and ping/port to detect network or resolution failures early.
- Include heartbeat monitors to confirm cron jobs and background tasks are running.
- Tune check intervals and alert thresholds to minimize noise and false positives.
- Use status pages and transparent communication to build trust during incidents.

Uptime monitoring 101: definitions & layers
Let’s start by understanding uptime monitoring, its role in reliability frameworks, key metrics and concepts, and common monitoring pitfalls.
What is uptime monitoring?
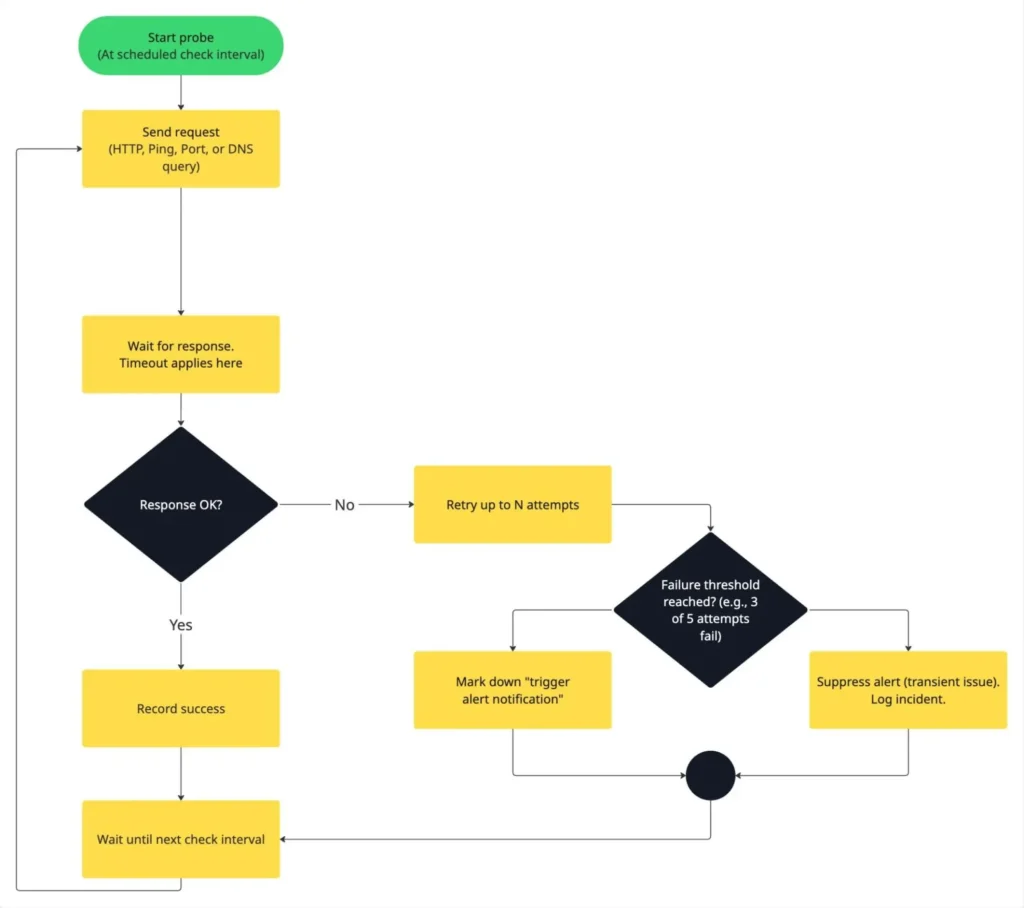
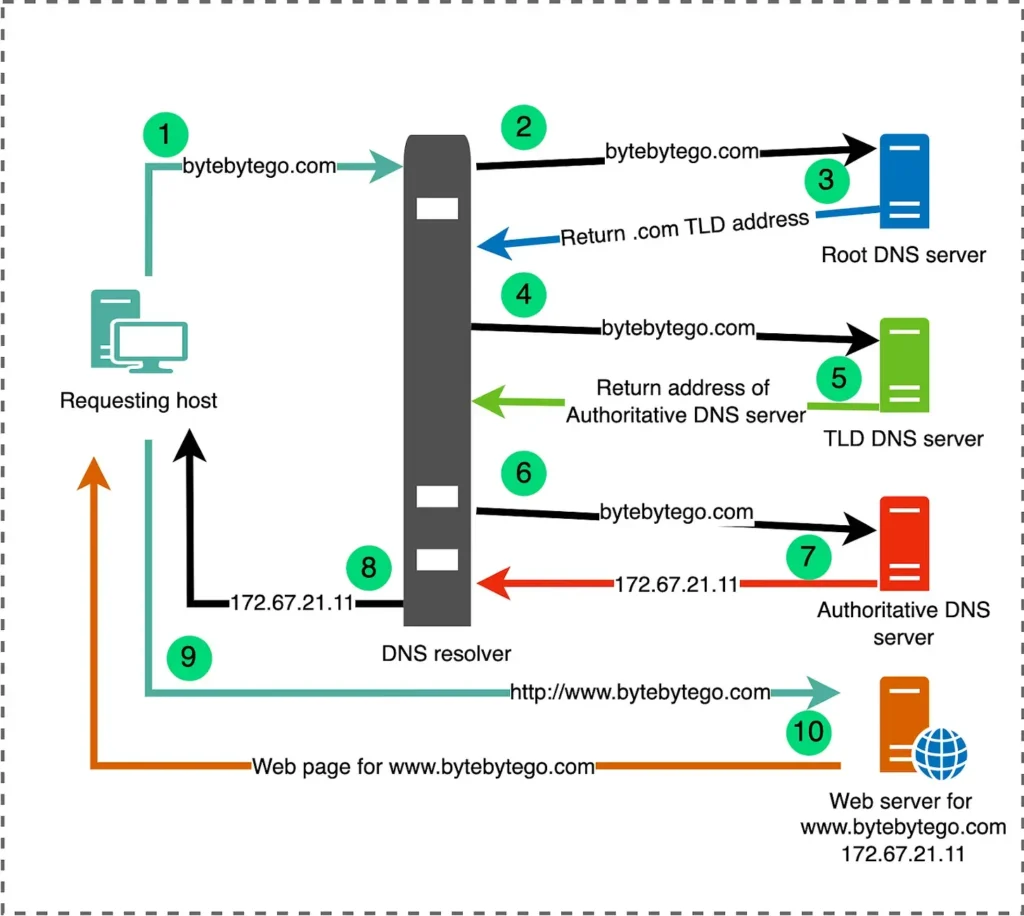
Uptime monitoring is the practice of continuously checking whether your website, API, or digital service is available and performing as expected. Monitoring tools periodically “probe” your service, usually by sending HTTP requests, pings, or TCP connections, to verify that it responds within a set time and with the correct status code.
These probes run from one or more external monitoring nodes, often located across different data centers or regions. If a probe fails (for example, the request times out or returns a 500 error), the monitoring tool marks the check as down and may alert your team after confirming the failure with retries or additional verification.
Synthetic vs real user monitoring
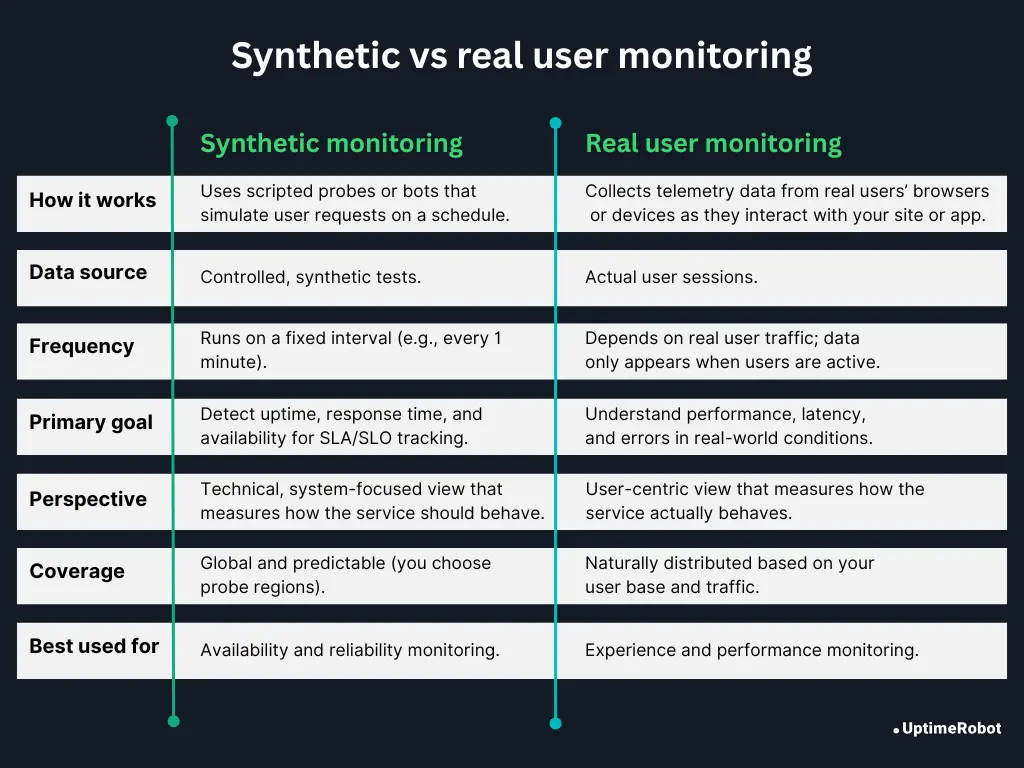
There are two main ways to monitor uptime and availability:
Synthetic (active) user monitoring
Synthetic user monitoring uses scripted probes that mimic real user requests. These checks run on a schedule (e.g., every 1 minute) and test your endpoints for availability, response time, and basic functionality.
Because synthetic checks are predictable and controlled, they’re perfect for uptime alerting, SLA tracking, and regression testing. You always know exactly what’s being tested and when.
Examples:
- HTTP checks against your landing page or API health endpoint
- TCP/ICMP (ping) checks to see if a host is reachable
- DNS resolution checks for your domain
The downside is that synthetic monitoring doesn’t capture what actual users experience. It provides a technical snapshot from the test’s perspective, not the full picture of performance across different devices, networks, or geographies.
Real (passive) user monitoring (RUM)
Real user monitoring, or RUM, shows what real users experience when they interact with your site or app. It passively collects telemetry from actual visitors’ browsers or devices, including latency, geographic variation, frontend errors, CDN behavior, and client-side network issues.
RUM is incredibly valuable for optimizing user experience and identifying regional or device-specific performance problems that synthetic checks can’t see. However, please note that it’s not designed for real-time outage detection. RUM only reports data when users are active, so you won’t receive alerts during low-traffic periods or complete outages.
A good uptime strategy combines both:
- Synthetic checks for proactive detection
- RUM for user-centric insights
The role of uptime monitoring in reliability frameworks
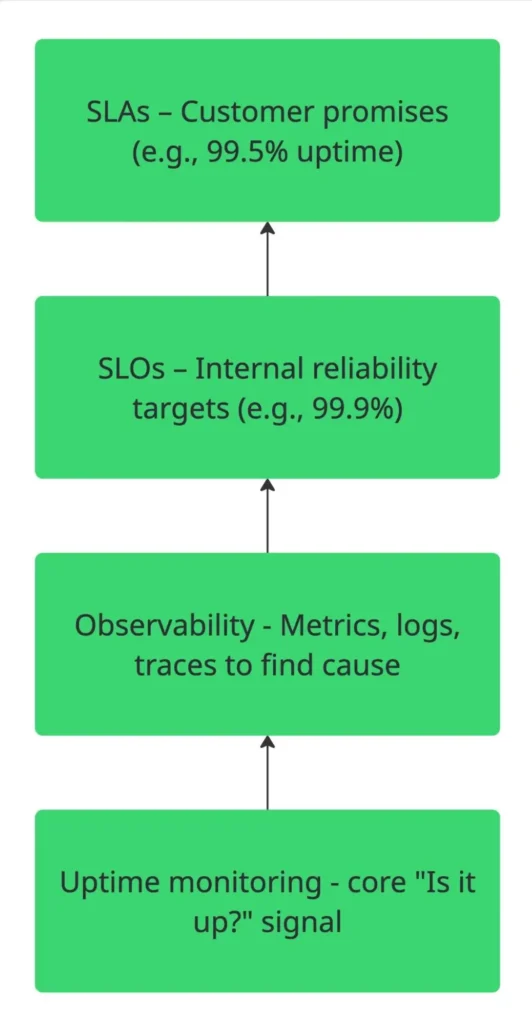
Uptime monitoring provides the most basic, yet most essential, signal. It tells whether your service is up or down. This simple check anchors the higher layers of reliability engineering.
Here’s how uptime monitoring connects to key reliability concepts:
Reliability:
The goal of reliability is to keep services consistently available and functional. Uptime monitoring directly measures this by tracking whether your application or API is reachable and performing as expected.
Observability:
Observability is about understanding why a system behaves a certain way through metrics, logs, and traces. Uptime checks act as the entry point for observability pipelines, the top-level signal that tells you when to look deeper into metrics or traces to find the root cause.
SLOs (Service level objectives):
SLOs define measurable targets for reliability (for example, 99.9% uptime over 30 days). Uptime data is the metric used to calculate and track compliance with these targets, making it a key input for SRE performance reviews.
SLAs (Service level agreements):
SLAs turn internal goals into formal customer commitments (for instance, offering refunds or credits if uptime drops below 99.5%). Uptime reports provide the hard evidence used to verify SLA compliance and maintain customer trust.
Also read: SLA vs. SLO vs. SLI: What’s the difference
Key uptime monitoring metrics and concepts
Before diving into specific monitor types, it’s helpful to understand a few core terms you’ll see in most uptime monitoring tools. These parameters determine how frequently your checks run, how sensitive they are to failures, and how reliably alerts are triggered.
1. Check interval
How often does your monitoring tool run a probe?
Example: Run checks every 60 seconds for continuous coverage without excessive noise.
2. Timeout
The maximum time a probe waits for a response before marking the check as failed.
Example: Consider a request failed if no response is received within 5 seconds.
3. Retry
The number of additional attempts after a failed check before declaring an outage.
Example: Retry up to 3 times before marking a monitor as “down.”
4. Threshold
The number or percentage of consecutive failures required to trigger an alert.
Example: Raise an alert only after 3 out of 5 consecutive probes fail.
5. False positive suppression
Methods used to prevent alerts caused by short, transient issues or local connectivity problems.
Examples: Implement retry logic, use majority voting across multiple regions, or delay alerts until failures are consistently confirmed.
Common monitoring pitfalls & tips
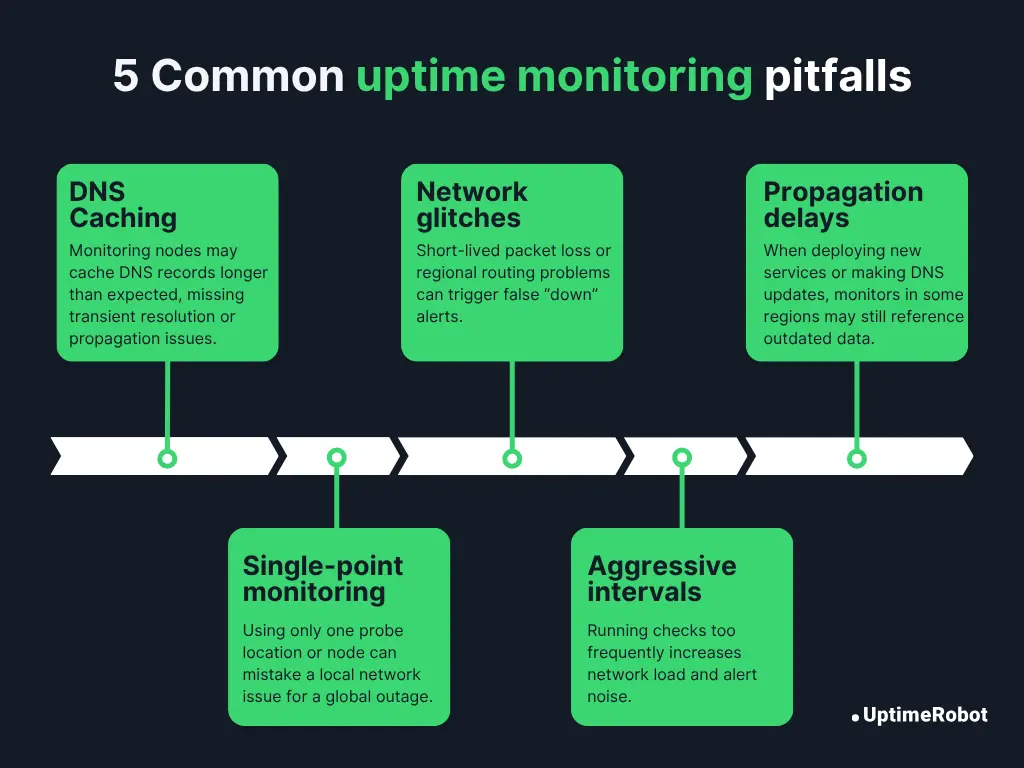
Even a well-designed monitoring setup can produce misleading or noisy results if it doesn’t account for real-world network behavior. Here are some of the most common issues to watch for and how to mitigate them:
1. DNS caching
Monitoring nodes may cache DNS records longer than expected, missing transient resolution or propagation issues.
Tip: Use short TTLs for critical records and test from multiple resolvers.
2. Network glitches
Short-lived packet loss or regional routing problems can trigger false “down” alerts.
Tip: Enable retries and multi-region confirmation before sending alerts.
3. Propagation delays
When deploying new services or making DNS updates, monitors in some regions may still reference outdated data.
Tip: Allow time for propagation and suppress alerts during planned change windows.
4. Single-point monitoring
Using only one probe location or node can cause a local network issue to be mistaken for a global outage.
Tip: Always monitor from multiple regions to confirm failures across locations.
5. Overly aggressive intervals
Running checks too frequently increases network load and alert noise, and in extreme cases can strain your own servers.
Tip: Adjust intervals based on service criticality; fast enough to catch issues, but not so fast that it causes self-inflicted problems.
Decision logic: which monitor when?
Monitor type comparison
| Monitor type | Typical use case | Limitations | Recommended fallback/pairing |
| HTTP(S) | Check website, API, or web app availability and response codes. | Won’t detect DNS issues, network-level failures, or SSL expiration. | Pair with DNS (for resolution) and SSL/TLS (for certificate health). |
| Keyword | Verify specific content or phrases on a web page (like “Welcome” or “Error”). | Sensitive to text changes, dynamic content, or localization. | Combine with HTTP(S) to confirm uptime and content integrity. |
| SSL/TLS | Monitor certificate validity, expiry, and trust chain. | Doesn’t check app logic or detect live handshake failures. | Pair with HTTP(S) to confirm both connectivity and secure handshake. |
| Ping | Verify network reachability of a host or server. | Blocked by firewalls or ICMP filters; can’t confirm app availability. | Pair with HTTP(S) or port to detect service-level failures. |
| Port (TCP) | Check if a specific service port (e.g., 22, 25, 3306) is open and accepting connections. | Doesn’t validate application logic or content-level errors. | Combine with ping (for network) or HTTP(S) (for app layer). |
| DNS | Validate domain resolution, record values, and propagation. | Subject to caching, not all failures are global. | Pair with HTTP(S) to confirm reachability and SSL/TLS for secure endpoints. |
| Heartbeat | Monitor scheduled jobs, cron tasks, or background workers. | Requires outbound access; false alarms if the timing buffer is too tight. | Pair with HTTP(S) to monitor related APIs or dashboards. |
Pro tip: No single monitor covers everything. Combine multiple layers – network (ping), protocol (HTTP/port), domain (DNS), and application (keyword/SSL) – to achieve full-stack visibility and reduce false positives.
Deep dive into each uptime monitoring type supported by UptimeRobot
UptimeRobot provides multiple monitoring types to cover every layer of uptime and performance. Below, we’ll look at how each one works, its ideal use cases, and its possible blind spots.
HTTP(S) monitoring
An HTTP(S) monitor tests your website or API by sending a standard HTTP or HTTPS request, usually a GET or HEAD, to a specified URL. The monitor checks the response status code, verifies the response time, and can optionally inspect headers or content to ensure the page or endpoint behaves as expected.
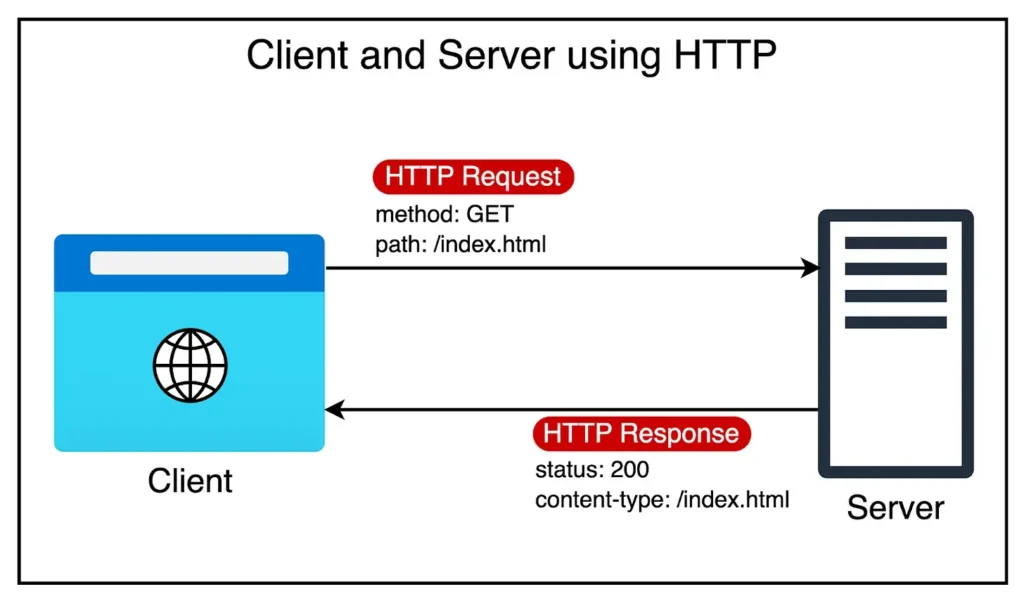
For example, it can:
- Confirm that your homepage returns 200 OK.
- Follow redirects to the final URL.
- Validate the presence of a keyword or JSON key in the response body.
- Flag a site as “down” if it receives an error (like 500, 404) or times out.
Use HTTP(S) monitoring for
- Checking the uptime of public websites (landing pages, blogs, marketing sites).
- Monitoring API endpoints for service availability and response integrity.
- Verifying application health using structured endpoints like /health or /status.
- Confirming post-deployment stability after releases or content changes.
- Testing multi-region behavior, e.g., ensuring your CDN or load balancer returns consistent responses.
| Strengths | Limitations |
| 1. Monitors the most logical layer, the application itself, instead of just the network. 2. Detects application-level failures such as 404 Not Found, 500 Internal Server Error, or slow responses. 3. Provides actionable context (“what failed”) compared to simple ping checks. | 1. Won’t detect DNS resolution issues or network routing failures that occur before HTTP is reached. 2. Can’t identify SSL handshake errors or low-level transport issues if the connection fails before the request. 3. Doesn’t measure resource-level performance (database query time, CPU load, etc.). 4. Vulnerable to false positives from transient CDN or caching layers. |
Best practices
To get the most accurate results from your HTTP(S) monitoring and minimize false alerts, follow these configuration and operational best practices:
- Use custom headers (such as authentication tokens or API keys) when monitoring secured endpoints.
- Define expected status codes explicitly. For example, allow 200-299 to cover all success responses.
- Set response size limits to detect partial or truncated responses.
- Enable redirect following for user-facing URLs that rely on 301 or 302 redirects.
- Choose between regular and advanced checks depending on how deeply you want to inspect content, SSL, or headers.
- Probe non-cached endpoints where possible to avoid masking transient backend errors.
- Test from multiple probe locations to account for CDN behavior and regional variations.
- Configure monitoring at both the load balancer and origin levels to detect routing inconsistencies or unhealthy backend nodes.
- Use retry logic and consecutive failure thresholds to suppress transient alerts caused by brief network or deployment glitches.
Real-world example
Monitor your API’s /health endpoint and verify that the JSON response contains “status”: “ok” or a specific key like “db_connected”: true.
Pair your HTTP(S) monitoring with
- Ping or TCP Port Monitor to distinguish between network-level and application-level failures.
- SSL/TLS Certificate Monitoring to ensure HTTPS failures aren’t caused by expired or misconfigured certificates.
Start monitoring smarter with UptimeRobot.
Ping monitoring (ICMP)
A ping monitor checks whether a server or device is reachable at the network layer using the ICMP (Internet Control Message Protocol). It sends a small echo request packet to the target host and waits for an echo reply.
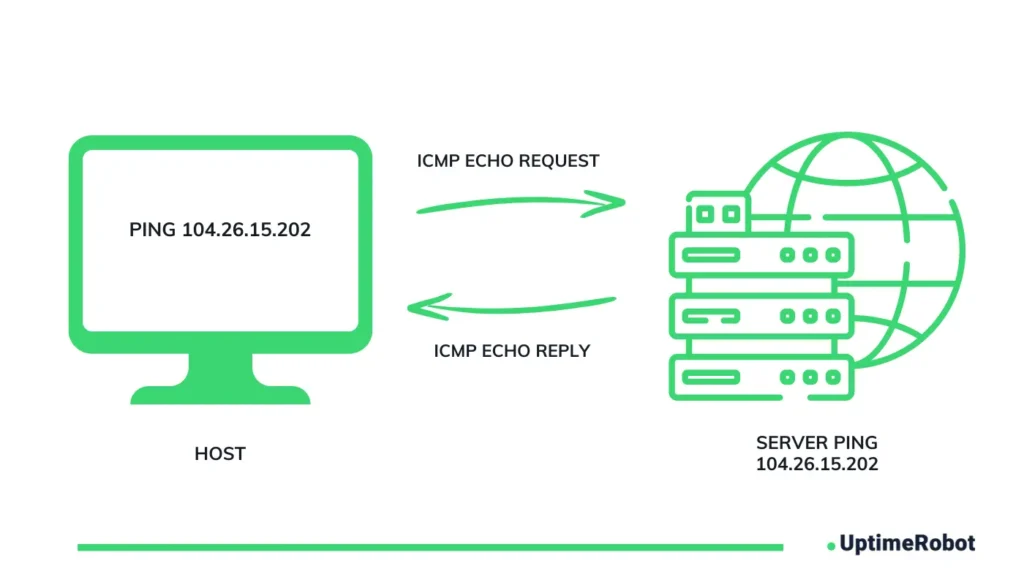
If a reply arrives within the timeout period, the host is considered up. If not, the check is marked as down. The response time gives a rough measure of network latency between the monitoring node and your host.
Ping monitoring doesn’t inspect application content or protocols; it simply verifies whether the server can be contacted over the network.
Use ping monitoring for
- Confirming the basic reachability of a server, router, or network device.
- Checking that a host is alive, even before higher-level services (like HTTP or SSH) are tested.
- Baseline network monitoring to observe latency trends or packet loss over time.
- Quickly verifying whether an outage is due to total network loss or application failure.
| Strengths | Limitations |
| 1. Extremely lightweight and fast; minimal network overhead. 2. Useful as a first-level availability check before higher-layer protocols. 3. Helps distinguish network outages from application-level problems. | 1. Many hosts and firewalls block ICMP traffic, leading to false negatives. 2. Cannot detect HTTP, SSL/TLS, or application-specific failures. 3. A server might respond to ping but have its web server down, resulting in false positives. 4. Doesn’t validate DNS resolution, TCP connectivity, or service performance. |
Best practices
Ping monitoring is best used as a foundational network-layer check. Follow these practices to ensure accurate reachability testing and avoid misleading results:
- Pair ping with higher-level checks, such as HTTP or TCP, to confirm both network reachability and application availability.
- Set practical timeout values (around 5-10 seconds) to allow for normal latency without masking real outages.
- Use moderate check intervals (typically 1-5 minutes) to balance responsiveness with alert stability and noise control.
- Correlate ping results with other monitors to quickly determine whether an incident stems from network connectivity or application failure.
- Account for ICMP filtering. Some network routes, devices, or firewalls may drop ping packets while still serving real traffic normally.
- Check firewall and DDoS protection settings to make sure ping probes are not being rate-limited or silently ignored.
- Validate probe consistency across regions and packet sizes, since large ICMP packets or routing differences can produce inconsistent results.
Real-world example
Monitor the public IP of your production server to confirm network reachability from multiple regions. If ping fails but HTTP and TCP checks pass, the issue might be ICMP blocking, not a real outage.
Pair ping monitoring with
- HTTP(S) Monitor to confirm that the web service itself is up.
- TCP Port Monitor to validate that a specific application port (like 443 or 22) is open and responsive.
Set up a ping monitor in UptimeRobot
Port monitoring
A port monitor (also known as a TCP monitor) checks whether a specific TCP port on a host is open and accepting connections. It works by attempting to establish a TCP handshake with the target IP and port. For example, example.com:22 for SSH, or mail.example.com:25 for SMTP.
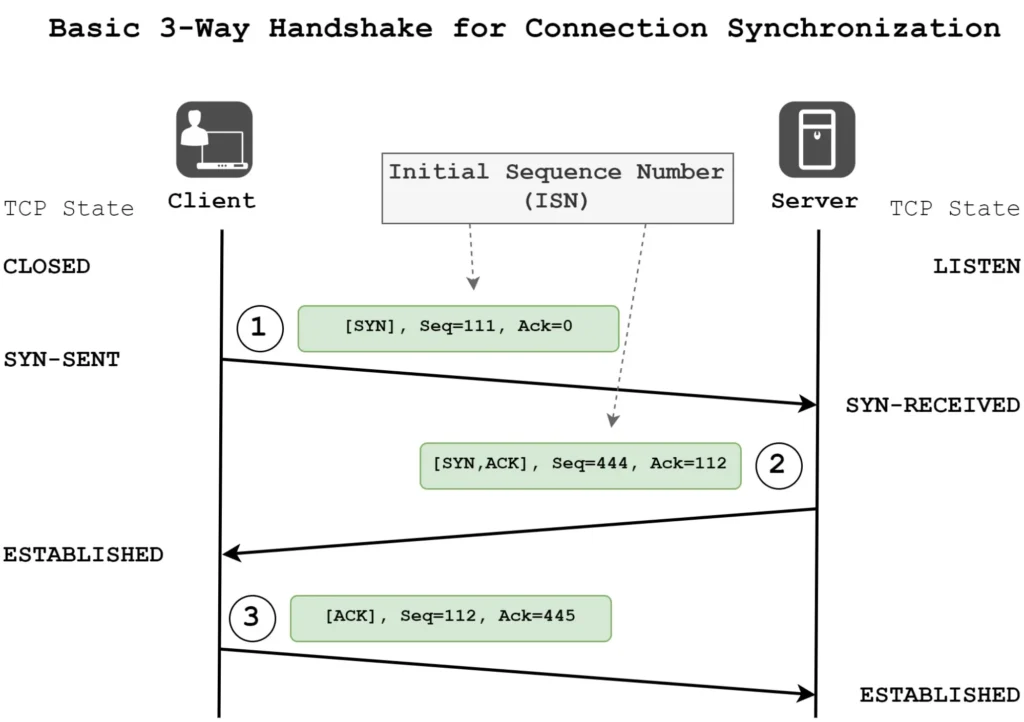
If the connection completes successfully within the timeout window, the port is considered up. If the connection times out or is refused, the check is marked down. This test checks whether a service is running on the target port and can be reached.
Use port monitoring for
- Monitoring infrastructure services like SSH (22), SMTP (25), POP3 (110), or database ports (MySQL 3306, PostgreSQL 5432).
- Verifying custom TCP-based applications or microservices running on non-standard ports.
- Checking backend systems that don’t expose HTTP interfaces (e.g., Redis, MQTT, FTP).
- Validating whether a firewall rule or NAT is allowing external connectivity.
| Strengths | Limitations |
| 1. Detects service-level outages and verifies if a daemon or listener is reachable. 2. Useful for non-HTTP protocols, expanding coverage beyond web-based services. 3. Lightweight and fast. Only attempts a TCP handshake, not a full protocol exchange. | 1. Doesn’t verify protocol correctness or content-level behavior. It only confirms a connection. 2. A service can accept TCP connections but still fail internally (e.g., frozen app or logic errors). 3. Can’t validate SSL/TLS certificates or application response codes. 4. Firewalls, NAT, or rate-limiting can cause intermittent or misleading results. |
Best practices
TCP port monitoring helps you confirm that key services stay reachable and responsive at the network level. Use these tips to make your checks more accurate and avoid false alerts:
- Specify the correct port and protocol for each service (for example, port 22 for SSH or 443 for HTTPS when not using an HTTP monitor).
- Adjust timeout settings to match expected response times, allowing extra margin for slower or resource-heavy services.
- Configure expected responses or handshake verification (if supported) to catch partial or incomplete connections.
- Set interval frequency based on priority. Use short intervals for critical ports and longer ones for background or non-critical services.
- Run checks from multiple regions to identify connectivity, routing, or firewall differences across networks.
- Validate firewall and ACL configurations to ensure legitimate monitoring traffic is not being blocked internally.
- Correlate port results with application-level monitors to detect cases where the TCP connection succeeds but the service logic fails.
- Avoid overly aggressive intervals. Rate-limiting or DDoS protection systems may interpret repeated probes as suspicious traffic and block them.
Real-world example
Monitor port 25 on your mail server to confirm that SMTP is responding. If it fails while ping still works, the network is fine, but the mail daemon (Postfix, Sendmail) isn’t accepting connections.
Pair port monitoring with
- Ping Monitor to detect whether the host itself is reachable.
- HTTP(S) or Keyword Monitor if your service also exposes a web or health endpoint.
- Heartbeat Monitor to confirm the underlying process or cron job feeding the service is still running.
Use UptimeRobot’s Port Monitor to detect connection issues at the network layer before they turn into full-service outages.
DNS monitor
A DNS monitor verifies that your domain name system (DNS) is resolving correctly and consistently. It works by querying DNS records (like A, AAAA, CNAME, or MX) for a specific domain and checking that the returned values match what you expect.
DNS monitors can detect:
- Resolution failures (e.g., NXDOMAIN, SERVFAIL)
- Incorrect or unauthorized record changes
- Propagation issues after a DNS update
- High lookup latency indicating DNS server performance problems
Advanced configurations can monitor both recursive (public resolver) and authoritative (your DNS host) servers, offering a complete picture of domain health and propagation.
Use DNS monitoring for
- Ensuring that your domain resolves to the correct IP address or CNAME.
- Detecting DNS misconfigurations (like broken MX or CNAME chains).
- Monitoring DNS propagation after record updates or migrations.
- Alerting on unauthorized changes caused by hijacking or misapplied automation.
- Verifying email deliverability by checking MX records.
| Strengths | Limitations |
| 1. Catches DNS-level issues early before they cascade into full service outages. 2. Detects unauthorized or accidental record changes quickly. 3. Monitors domain health independently of web or network layers. 4. Helps isolate whether an outage is due to DNS resolution vs application failure. | 1. Propagation delays after legitimate record changes can trigger false alerts. 2. Caching behavior in recursive resolvers can obscure transient DNS issues. 3. Regional differences in DNS infrastructure can produce inconsistent results. 4. Doesn’t verify application reachability, only that DNS resolution works. 5. Complex setups using DNSSEC may experience validation or signature expiry issues that affect monitoring accuracy. |
Best practices
DNS monitoring helps detect resolution issues and unauthorized record changes before they impact service availability. Follow these practices to maintain reliable and complete coverage:
- Monitor all relevant record types for your infrastructure:
- A / AAAA for web or app servers
- MX for mail delivery
- CNAME for service aliases
- TXT for SPF/DKIM or verification records
- Track and alert on resolution errors such as NXDOMAIN or SERVFAIL to catch configuration or propagation problems early.
- Measure DNS latency to identify resolver or network performance issues that could affect response times.
- Set up change detection alerts for critical records to detect unauthorized updates or hijacks.
- Align check intervals with TTL values to avoid redundant alerts during expected propagation cycles.
- Ensure check intervals are shorter than TTLs when tracking fast-changing records, so transient updates are visible.
- Account for caching effects by testing from multiple resolvers or regions to detect delayed or inconsistent updates.
- Validate DNSSEC configurations regularly to prevent failures caused by expired signatures or missing DS records.
- Create separate monitors for split-horizon setups (internal vs external DNS) to confirm both environments resolve correctly.
Real-world example
Monitor the A record for api.example.com and verify it always resolves to your production IP (203.0.113.10). If the record changes unexpectedly or fails to resolve, you’ll know immediately before your HTTP checks start failing.
Pair DNS monitoring with
- HTTP(S) Monitoring to correlate DNS and application availability.
- Ping or TCP Port Monitor to confirm that the resolved IP is reachable.
- SSL/TLS monitoring to ensure the certificate remains valid for the same domain.
Set up a DNS Monitor in UptimeRobot to catch resolution issues, misconfigurations, or propagation delays before they impact users.
SSL/TLS certificate monitoring
An SSL/TLS certificate monitor checks the validity and health of your HTTPS certificates. It periodically connects to your domain over SSL/TLS (usually via port 443) and validates the presented certificate against key criteria:
- Whether it is valid and trusted by known certificate authorities (CAs).
- Whether it is not expired or about to expire.
- Whether the certificate chain (intermediate + root) is complete and valid.
- Optionally, whether the certificate has been revoked (via CRL or OCSP checks).
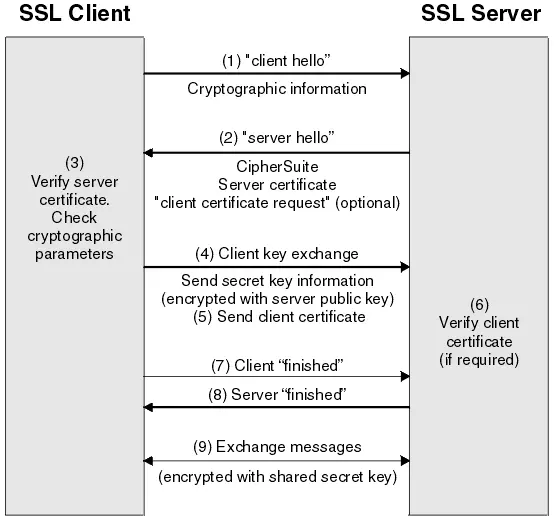
The monitor reports on days until expiry, issuer details, and chain integrity, alerting you before users or clients experience HTTPS errors.
Use SSL/TLS certificate monitoring for
- Ensuring websites and APIs always present valid SSL certificates.
- Monitoring public-facing endpoints that require encrypted communication.
- Tracking certificate health across multi-domain or wildcard setups.
- Preventing service disruptions caused by expired or misconfigured certificates.
- Auditing certificate changes after automation or DevOps deployments.
| Strengths | Limitations |
| 1. Provides early warning before certificates expire, preventing downtime and browser security errors. 2. Detects misconfigured certificate chains or untrusted intermediates. 3. Helps maintain compliance for HTTPS, APIs, and secure client communications. 4. Catches automation failures (e.g., when Let’s Encrypt renewals silently fail). | 1. Does not test handshake performance or detect latency under load. 2. Won’t identify weak ciphers, protocol vulnerabilities, or TLS configuration flaws. 3. Some tools only test from a single region, missing geo-specific certificate issues. 4. Doesn’t verify whether the certificate matches all subdomains or SAN entries unless explicitly configured. |
Best practices
SSL/TLS monitoring helps prevent unexpected certificate expirations and misconfigurations that can disrupt secure connections. Use these practices to maintain continuous HTTPS availability and trust:
- Set proactive alert thresholds. Configure reminders at least 30 days before expiry and a final warning at 14 days to allow time for renewal and validation.
- Monitor intermediate certificates as well as the primary leaf certificate, since intermediates can expire first and silently break the trust chain.
- Track certificate chain changes to detect unauthorized replacements or unexpected CA issuers.
- Verify hostnames and SAN entries to confirm that each certificate correctly covers your domain and any wildcard subdomains.
- Enable OCSP and CRL checks (when supported) to detect revoked or invalid certificates in real time.
- Monitor wildcard and multi-domain certificates across all critical subdomains to ensure consistent coverage and early detection of misaligned renewals.
- Validate regional differences. Load balancers and CDNs (content delivery networks) may present different certificates from edge nodes, so include multi-region checks.
- Account for OCSP or CRL latency by allowing a short retry window if revocation endpoints are temporarily slow or unavailable.
- Supervise automated renewal systems (like Let’s Encrypt, AWS ACM, or Certbot) with external monitoring to confirm they actually deploy renewed certificates correctly.
Real-world example
Monitor https://api.example.com for SSL expiry. The check sends alerts 30 and 7 days before the certificate expires, giving DevOps time to renew it before clients lose access.
Pair SSL / TLS certificate monitoring with
- HTTP(S) Monitoring to verify end-to-end HTTPS health.
- DNS Monitor to detect misrouted or hijacked domains that present unexpected certificates.
- Port Monitoring on 443 to detect full service unavailability (e.g., if the web server goes down).
Set up an SSL/TLS Monitor in UptimeRobot to stay ahead of certificate expirations and avoid user-facing HTTPS errors.
Keyword monitoring
A keyword monitor checks whether a web page is available, and whether its content is correct. It works by performing an HTTP(S) request to a target URL, fetching the response body, and scanning it for a specific phrase or string.
You can configure it to alert when the keyword:
- Exists (expected phrase should be present), or
- Does not exist (forbidden phrase should be absent).
This allows the monitor to verify both the presence of critical content (such as “Welcome to ExampleCorp”) and the absence of error states (“500 Internal Server Error”, etc.).
Use keyword monitoring for
- Ensuring that a landing page or marketing site shows the correct message or call-to-action.
- Verifying technical pages like /status or /version for specific indicators.
- Confirming redirected content (e.g., final destination includes a keyword).
- Checking login or post-login pages for personalized text.
- Detecting website defacement, content hijack, or cache corruption.
| Strengths | Limitations |
| 1. Detects logic-level or rendering failures, even if the server returns 200 OK. 2. Useful for identifying incorrect pages (e.g., app error pages, stale content). 3. Helps spot unauthorized content changes or defacement attacks. 4. Simple to configure and works across most public websites. | 1. Content changes (copy updates, date stamps, personalization) can trigger false positives. 2. Dynamic or AJAX-driven pages may load text after the initial request, making monitoring unreliable. 3. Localization or A/B testing can cause variations in the monitored phrase. 4. Doesn’t validate network or certificate health, only what the HTTP body contains. |
Best practices
Keyword monitoring verifies that your website or application is not only online, but also delivering the correct content. Follow these practices for reliable, low-noise checks that accurately reflect user experience:
- Select stable and unique phrases that rarely change, such as a tagline, footer text, or fixed UI element.
- Avoid volatile or dynamic content like timestamps, prices, or randomized values that may trigger false alerts.
- Use both “exists” and “does not exist” rules to confirm correctness.
- Set up multiple checks on critical pages to validate both uptime and content integrity from different perspectives.
- Adjust case sensitivity and partial match options to fine-tune how the monitor interprets results.
- Verify how JavaScript-rendered pages load, since non-browser monitors may not execute scripts or render dynamic content.
- Test through multiple regions and languages if your site uses CDNs or geo-based content, ensuring consistency across audiences.
- Account for caching and redirects by checking origin responses directly or by comparing multiple probe locations.
- Optimize response sizes and parsing for large pages to avoid timeouts or delays when scanning for keywords.
Real-world example
Monitor your application’s login page and verify that the text “Welcome, USER” appears after authentication. Alternatively, set a “does not exist” check for “Error” to make sure users never see a backend failure page.
Pair keyword monitoring with
- HTTP(S) Monitoring for full availability and content validation.
- SSL/TLS Monitoring to ensure secure delivery of the verified content.
- DNS Monitor to confirm the domain consistently resolves to the correct environment.
Use UptimeRobot to make sure your site’s critical text, messages, or data always appear as expected.
Heartbeat/cron monitoring
A heartbeat monitor (also called a cron or push monitor) tracks whether scheduled tasks or background jobs are running as expected. Unlike other uptime checks, it works in reverse, your service sends a signal (or “ping”) to the monitor instead of the monitor testing your service.
When you set up a heartbeat monitor, the system gives you a unique URL (for example, https://heartbeat.uptimerobot.com/xyz123). Your cron job, script, or background process must send an HTTP request (usually a simple GET or POST) to that URL each time it runs.
If the monitor doesn’t receive a ping within the expected interval (plus a small buffer), it considers the job missed or down. This makes it ideal for detecting silent failures in scheduled jobs that don’t run continuously.
Use heartbeat monitoring for
- Monitoring scheduled jobs like backups, data imports, or nightly syncs.
- Ensuring cron tasks or ETL pipelines actually execute on schedule.
- Verifying long-running processes or daemons periodically sends “I’m alive” signals.
- Tracking on-prem or private systems that can make outbound calls but aren’t publicly accessible.
| Strengths | Limitations |
| 1. Uses reverse logic to alert you when expected activity doesn’t happen. 2. Perfect for jobs that should run on schedule, not continuously. 3. Works well for internal systems behind NAT or firewalls (as long as outbound HTTP is allowed). 4. Low overhead, as it requires only a lightweight HTTP call. | 1. The monitored system must have outbound internet access to reach UptimeRobot. 2. Time skew or job delays may cause false alarms if buffer windows are too strict. 3. Can’t directly measure the success/failure of the job’s internal logic, only whether it ran. 4. Network or proxy issues can block outgoing pings even if the job itself succeeded. |
Best practices
Heartbeat monitoring helps confirm that scheduled jobs and background tasks are running as they should. Use these best practices to reduce false alerts and keep your job tracking reliable:
- Set a grace period or buffer window slightly longer than the job’s normal interval (around 10-20% extra) to allow for delays or temporary load spikes.
- Account for execution jitter, especially for jobs triggered by external data loads, varying runtimes, or shared system resources.
- Send pings at both job start and completion when duration matters, helping detect stalled or incomplete runs.
- Define custom alert windows for non-critical or infrequent tasks, such as weekly reports, to reduce unnecessary notifications.
- Include context parameters (like job name, status, or instance ID) in the ping URL or payload for faster debugging and correlation.
- Synchronize system clocks using NTP to prevent time drift that can cause false “missed” alerts.
- Verify firewall and proxy rules so that outbound HTTP pings from internal servers are not blocked or filtered.
- Set a reasonable ping frequency – avoid excessive calls that could overlap intervals or create noise.
- Keep heartbeat URLs private and secure, treating them like credentials to prevent unauthorized or spoofed pings.
Real-world example
A daily database backup script sends a heartbeat to https://heartbeat.uptimerobot.com/xyz123 after completion. If the monitor doesn’t receive the ping within 25 hours, it alerts the DevOps team, signaling the backup didn’t run or failed silently.
Pair heartbeat / cron monitoring with
- Ping Monitoring for network reachability of the host running the job.
- HTTP(S) Monitoring to confirm that any dependent web endpoints are up before the job executes.
- Port Monitoring if the job interacts with a specific TCP service (like a database).
Use UptimeRobot’s Cron Job Monitoring to confirm job execution, detect missed runs, and gain visibility into your internal automation.
Comparative overview: which checks catch which failures?
Different monitors operate at different layers of the stack. No single monitor can catch every type of failure. The most reliable setups combine multiple monitors to ensure full coverage and minimize false alarms.
Failure mode detection matrix
| Failure mode | HTTP(S) | Ping | Port | DNS | SSL/TLS | Keyword | Heartbeat |
| DNS down/misconfigured | ⚠️ Partial | ❌ | ❌ | ✅ | ⚠️ Partial | ⚠️ Partial | ❌ |
| Server unreachable (network issue) | ❌ | ✅ | ✅ | ⚠️ Partial | ❌ | ❌ | ❌ |
| Firewall block / ICMP filtered | ⚠️ Partial | ❌ | ⚠️ Partial | ✅ | ❌ | ❌ | ⚠️ Partial |
| SSL/TLS expired or invalid | ⚠️ Partial | ❌ | ❌ | ❌ | ✅ | ❌ | ❌ |
| Application error (HTTP 500, 404) | ✅ | ❌ | ⚠️ Partial | ❌ | ❌ | ✅ | ❌ |
| Content error (wrong page, broken HTML, defaced site) | ⚠️ Partial | ❌ | ❌ | ❌ | ❌ | ✅ | ❌ |
| Cron / scheduled job failed. | ❌ | ❌ | ❌ | ❌ | ❌ | ❌ | ✅ |
How different monitors work together for complete coverage
The most resilient uptime setups combine multiple monitor types in logical cascades so that when one check fails, another helps identify where the problem lies. Using checks at the DNS, network, transport, and application levels helps you tell false alarms from real issues and find the root cause faster.
Below are several recommended combinations and how they complement one another:
1. DNS + HTTP + keyword
This monitoring trio provides full visibility from domain resolution to application correctness.
- DNS confirms that your domain name resolves to the correct IP address.
- HTTP verifies that the endpoint responds properly and within expected time limits.
- The keyword ensures the content returned is the right content, not an error or placeholder page.
Example: If your HTTP monitor reports a failure, check the DNS monitor first. If DNS resolution fails, the outage is likely a name server or propagation issue. If DNS works but keyword monitoring fails, the site is up but serving the wrong or incomplete content (for example, an “Under Maintenance” page).
This combination is particularly useful for public-facing websites, marketing pages, and e-commerce platforms where both availability and correctness matter.
2. HTTP + port + ping
This stack helps you differentiate between application-level and network-level failures.
- Ping verifies basic reachability at the network layer.
- Port confirms that a specific TCP port (e.g., 443 for HTTPS, 22 for SSH) is open and accepting connections.
- HTTP checks the application’s actual responsiveness and logic.
Example: If HTTP is down but ping still responds, your host is reachable, but the web server or app process has failed. If both Ping and Port fail, the issue is deeper, possibly a network outage, firewall block, or host crash.
This combination is ideal for APIs, web apps, and backend services, where distinguishing between infrastructure and application faults saves valuable troubleshooting time.
3. HTTP + SSL/TLS
This pairing ensures secure availability.
- HTTP confirms that the endpoint responds successfully.
- SSL/TLS validates that the certificate is valid, trusted, and unexpired.
Example: If HTTP checks begin failing due to “certificate expired” or “SSL handshake” errors, your SSL/TLS monitor will already have warned you days earlier. This prevents avoidable downtime and user-facing HTTPS errors, especially important for secure APIs, customer portals, or payment systems.
4. Heartbeat + HTTP
This combination ties background job reliability with service uptime to give a complete operational picture.
- Heartbeat verifies that scheduled jobs (like backups, reports, or sync tasks) execute on schedule.
- HTTP confirms that the service or API these jobs depend on is up and reachable.
Example: If a nightly data pipeline fails to send its heartbeat but HTTP checks remain green, the service is fine, but the job itself didn’t run, possibly due to a scheduler or permission error. If both fail, it’s likely a broader outage affecting multiple layers.
This pairing is perfect for internal automation, ETL pipelines, or cron-driven integrations where both the job and the API must work together.
Best practices for smarter alerting
False alerts waste time and reduce trust in your monitoring setup. To make every alert meaningful, configure your monitors to filter out transient or localized issues before they escalate.
- Correlate multiple signals: Trigger alerts only when two or more monitors, ideally from different regions or types, fail at the same time.
- Use suppression windows: Add short delays (a few seconds to a minute) before sending an alert to filter out momentary network hiccups.
- Set consecutive failure thresholds: Require several consecutive failures (e.g., 3 out of 5 checks) before declaring a true outage.
- Implement adaptive thresholds: Automatically widen tolerance during planned maintenance or expected peak loads to reduce noise.
- Confirm from multiple regions: Validate failures across geographic locations to ensure an issue is global, not regional.
| A good rule of thumb: One monitor detects; two confirm; three correlate. |
Beyond the basics: advanced uptime monitoring concepts
Once your monitoring setup is running smoothly, it’s time to look beyond basic uptime checks. The following advanced topics explore real-world factors that influence how your monitors behave. Understanding these nuances helps you interpret results more accurately and design a monitoring system that’s both smarter and quieter.
Regional & geographical vantage point effects
Monitoring results can vary based on where your probes are located. A site might perform perfectly in the US but fail in Asia because of CDN edge issues, ISP routing differences, or regional firewall restrictions. Always check performance from multiple locations to understand whether an issue is global or regional.
What you can do:
- Test from several regions before declaring an outage.
- Set up monitors in diverse probe locations to catch regional failures early.
- Compare response times by geography to identify latency bottlenecks or routing issues.
DNS caching & TTL vs check interval
DNS monitoring depends heavily on time-to-live (TTL) values and caching behavior. If your check interval is longer than the TTL, you may miss transient DNS issues. If it is too short, you may only see cached responses and miss propagation problems.
What you can do:
- Align check intervals to your TTL, roughly ½ to 1× the TTL value.
- Clear or refresh the DNS cache on probe nodes after important DNS changes.
Monitoring behind load balancers, CDNs & reverse proxies
When your service sits behind a load balancer or CDN, monitors may only see the edge, not the origin server. This can lead to false confidence if the edge is healthy but the origin is failing, or unnecessary alerts if only one node is having issues.
What you can do:
- Add origin-level checks for internal endpoints behind your load balancer.
- Monitor both CDN-facing URLs and origin URLs separately to compare results.
Handling transient network glitches & flapping
Not every failed probe means your system is actually down. Short network hiccups or temporary packet loss can trigger false alerts if you alert too quickly. You can reduce noise by building tolerance into your alerting logic.
What you can do:
- Require consecutive failures (for example, 3 out of 5) before triggering an alert.
- Add a brief alert delay of 30 to 60 seconds to allow for short recoveries.
- Use majority voting across regions or nodes before escalation.
- Record every incident, but alert only on sustained or repeated failures.
Dealing with interim issues (propagation & staging)
When deploying DNS updates, configuration changes, or new services, you may experience a propagation window where some monitors see old data while others see new results. These temporary inconsistencies are normal and should not be treated as outages.
What you can do:
- Pause or suppress alerts during planned changes to avoid false notifications.
- Mark maintenance or migration periods clearly in your dashboards.
- Run parallel checks during rollouts to compare the new setup with the old one.
Managing alert fatigue
Too many alerts can desensitize your team and lead to missed critical incidents. Your goal should be to make every alert relevant, timely, and actionable.
What you can do:
- Categorize monitors by importance: critical, important, or informational.
- Set escalation policies so minor issues reach operations first, and major ones reach engineering.
- Apply rate limiting or deduplication in tools like Slack, PagerDuty, or OpsGenie.
- Review alert logs monthly and remove redundant or noisy checks.
Integration with dashboards & observability
Uptime data tells you what happened, but observability tells you why. Integrating your uptime checks with performance dashboards lets you correlate downtime with infrastructure metrics and application logs.
What you can do:
- Feed uptime data into Grafana, Datadog, or Prometheus dashboards.
- Overlay downtime markers on charts showing latency, CPU, or error rates.
- Use this data to spot trends between external availability and internal performance.
API usage & automation
Automation helps you manage monitors at scale, ensuring consistency across environments while saving time and reducing manual errors. By integrating monitoring with your deployment and maintenance workflows, you can keep your checks up to date without constant human intervention.
What you can do:
- Automatically create or update monitors during CI/CD deployments.
- Add tags or labels to group monitors by team or system.
- Use API calls to fetch uptime metrics for custom dashboards or reports.
- Auto-pause monitors during maintenance windows to prevent false alerts.
Automate every monitor in minutes with UptimeRobot. Try now!
Future monitoring trends
Monitoring is evolving beyond simple availability checks. Modern practices combine synthetic monitoring, multi-step transactions, and real user data to provide a comprehensive view of system health.
What you can do:
- Use multi-step checks to simulate real-world actions, such as login, checkout, or API sequences.
- Add multi-hop probes to validate dependencies (DNS → API → database).
- Combine synthetic data with Real User Monitoring (RUM) for context-rich insights.
- Explore AI-based anomaly detection to adjust alert thresholds automatically.
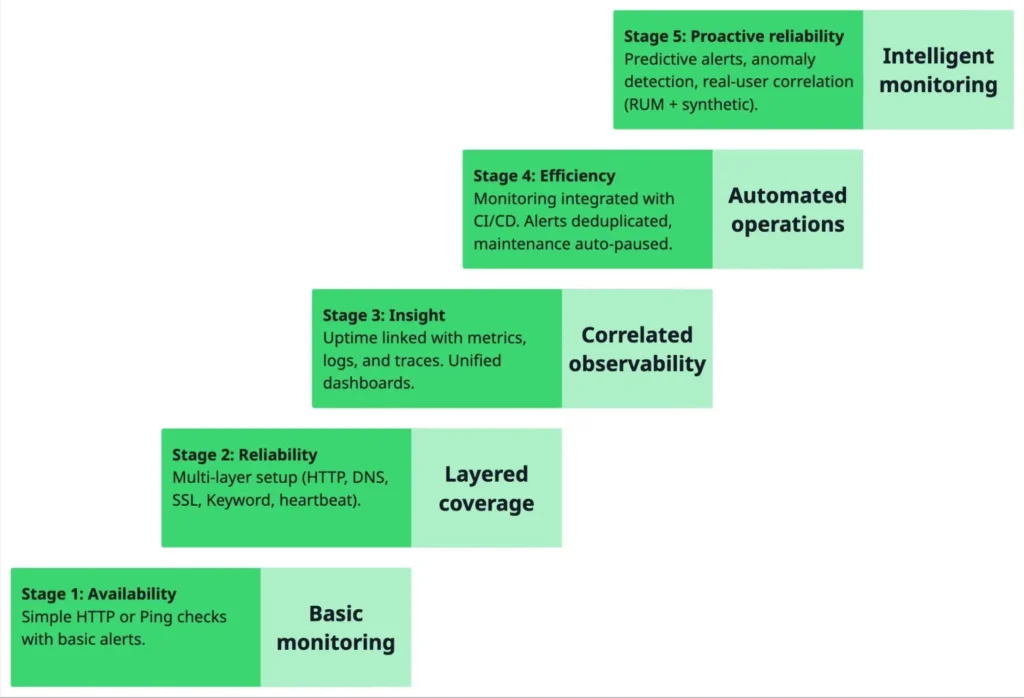
As your monitoring strategy evolves, it naturally moves through levels of sophistication, from simple uptime checks to intelligent, automated systems that predict and prevent downtime. The Monitoring Maturity Model helps you understand where you currently stand and what to aim for next.
Troubleshooting & common issues
Even well-configured monitoring setups occasionally produce confusing or inconsistent results.
Here are some of the most common issues and how to interpret and fix them.
“My HTTP monitor shows ‘down’, but the site is up”
Chances are, you’ve seen this one yourself; it’s one of those notorious “false down” cases. If an HTTP monitor reports downtime even though your site loads in a browser, the cause is often network-path variance or timing issues between monitoring nodes and your users.
In other words, what your browser sees and what a monitoring probe experiences can differ based on where and how the request is made.
Possible causes:
- DNS latency or caching: The monitor may query an outdated DNS record while your local resolver uses a fresher one.
- Routing asymmetry: The path from the monitor’s data center to your server may be temporarily congested or blocked.
- Firewall or geoblocking: Your server might restrict requests from certain IP ranges used by monitoring services.
- Timeout sensitivity: The site responded slowly and hit the monitor’s timeout limit, even though it eventually loaded.
How to fix it
Check your web server logs for the monitor’s IP, run a traceroute or mtr from a similar region, and verify DNS TTLs and propagation.
False alarms from keyword checks
False alarms from keywords checks are because keyword monitors rely on exact text matching, so even a small content or layout change can trigger a false alert. What looks like a harmless text tweak to you might look like a failure to the monitoring tool.
Possible causes:
- Minor wording or markup changes (e.g., “Welcome!” → “Welcome back!”).
- Template updates or new HTML structure.
- Dynamic data like timestamps, A/B test variants, or localized phrases.
How to fix it
Fix it by using stable text fragments that rarely change, and set monitors in “does not exist” mode for known error keywords (like “503 Service Unavailable”). Before deploying content updates, test keyword monitors to ensure your phrases still match the expected output.
SSL/TLS monitor alerts too early
Sometimes, SSL monitors trigger alerts even after certificates have been successfully renewed, particularly when intermediate certificates or the chain order change. These alerts can appear premature but usually stem from short-lived inconsistencies during propagation.
Possible causes:
- The monitoring node caches an older chain temporarily.
- An intermediate certificate expired or was replaced before all endpoints were updated.
- The SSL renewal script issued a new cert from a different CA, triggering a “change” alert.
How to fix it
Use openssl s_client -showcerts -connect example.com:443 to validate the full certificate chain and confirm propagation. Allow a short grace period after renewal before re-enabling strict monitoring, and configure your SSL monitors to re-verify automatically once the new chain is fully distributed.
Heartbeat monitor misses
Heartbeat monitors rely on precise timing. If a job runs late or overlaps intervals, the monitor may interpret it as a missed ping even though the task executed successfully. These false misses often point to timing or configuration issues rather than real failures.
Possible causes:
- The cron job runs late due to system load, resource contention, or queued processes.
- Clock drift or timezone mismatches cause reported intervals to fall outside the expected schedule.
- The buffer or alert window is configured too tightly, leaving no tolerance for normal variation.
How to fix it
Fix it by adding a buffer threshold (for example, expected interval + 10-20%) to accommodate slight timing jitter. Ensure all systems synchronize their clocks via NTP to maintain accurate scheduling.
For long-running jobs, send two pings, one at the start and another upon successful completion, to differentiate between slow execution and missed runs.
Port monitor works, but the service is broken inside
A port monitor confirms that a network connection can be established, but it doesn’t test what happens after the connection is made. In other words, it can tell you that a service is listening, not whether it’s functioning correctly.
Example:
Port 3306 on a database server might be open and accepting connections, but queries could still fail due to authentication errors, misconfigurations, or data corruption. From the monitor’s perspective, the port is “up,” even though the service behind it is effectively down.
How to fix it
Supplement your TCP checks with application-level monitors that validate actual functionality. For example, use an HTTP or keyword monitor on a /health or /status endpoint that runs a lightweight query or dependency check. This lets you detect logical failures, not just connectivity issues.
Irregular or conflicting monitoring alerts
Sometimes alerts don’t tell the whole story. If a notification seems suspicious or inconsistent, treat it as a chance to investigate rather than react immediately. Here’s a systematic way to debug and validate what’s really happening:
- Cross-check other monitors: Compare results across types. For instance, if HTTP fails but ping and DNS are normal, the issue is likely application-level, not network-related.
- Review diagnostic data: Inspect the response code, error message, and failing region provided by the monitoring platform.
- Use network tools for verification:
- dig or nslookup → verify DNS resolution and propagation.
- traceroute or mtr → analyze network paths and latency.
- curl -v → manually reproduce HTTP responses and headers.
- Check system and access logs: Review web server, load balancer, or firewall logs to see whether the probe request actually reached your system.
- Leverage historical data: Examine previous alerts or uptime history to identify recurring patterns or regional anomalies that might explain the issue.
Putting it all together: best practice blueprint
Now that we’ve explored how different monitor types work, let’s turn theory into practice.
Here’s how to design a layered, cost-efficient uptime monitoring setup that balances reliability, signal quality, and alert noise, whether you’re tracking a public site, an API, or a private cron job.
Step-by-step “Uptime monitor setup recipe”
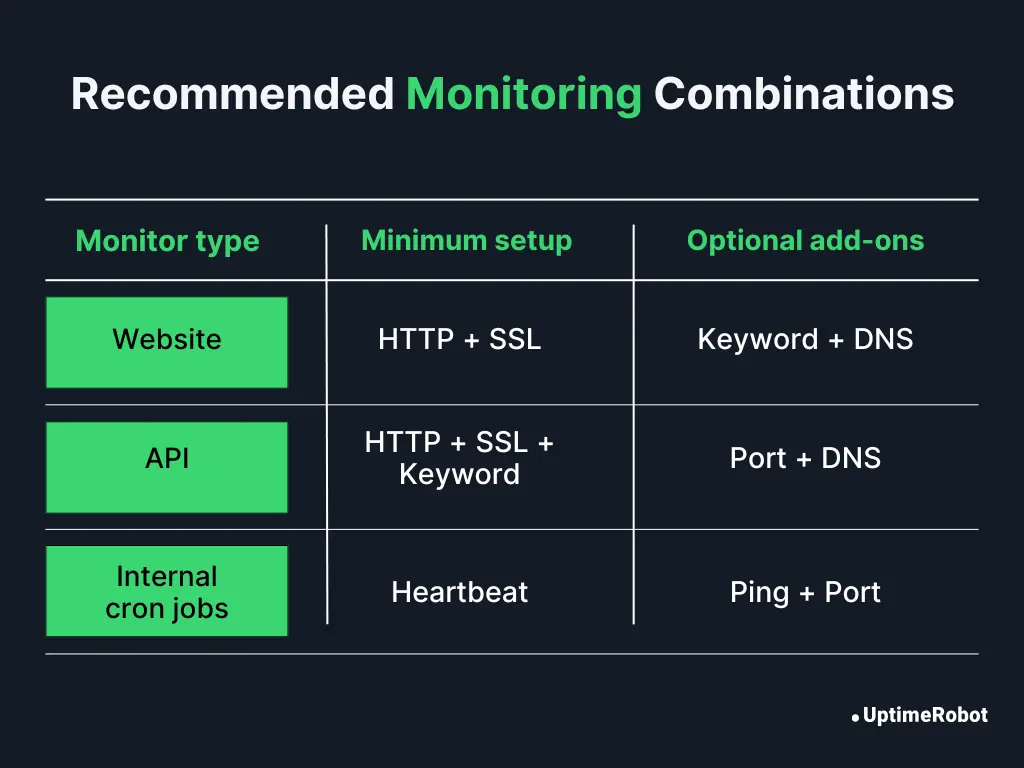
1. For a public website
Goal: Detect availability, SSL health, and user-facing content integrity.
Recommended setup:
- HTTP(S) monitor: Your primary uptime signal (e.g., every 1 minute).
- SSL/TLS monitor: Alerts before certificate expiry (30/14 days).
Optional add-ons:
- Keyword monitor: Verify homepage text like “Welcome to ExampleCorp.”
- DNS monitor: Detect resolution issues or hijacks.
Tip: If you use a CDN, add checks from multiple regions and one direct-origin check (bypassing CDN) for diagnosis.
2. For an API or web service
Goal: Detect endpoint health, status code correctness, and response accuracy.
Recommended setup:
- HTTP(S) monitor: Point it at a /health or /status endpoint returning JSON.
- Keyword monitor: Verify presence of a known key (e.g., “status”: “ok”).
- SSL/TLS monitor: Catch certificate chain or renewal issues.
Optional add-ons:
- Port (TCP) monitor: Validate the listening socket (e.g., port 443 or 8080).
- DNS monitor: Detect API domain resolution issues.
Tip: Use custom headers (tokens or environment tags) and check both staging and production APIs to detect pre-release regressions.
3. For internal cron jobs or background workers
Goal: Ensure scheduled tasks actually execute and complete successfully.
Mandatory monitoring setup:
- Heartbeat monitor: Expect a ping every run (e.g., hourly, daily).
Optional add-ons:
- Ping or port monitor: Validate the host or service availability if reachable.
- HTTP(S) monitor: Optional if the job exposes a health URL or dashboard.
Tip: Include start and end heartbeats for long-running jobs to detect partial failures or hung executions.
Rule of thumb: Always have at least two monitors per critical system: one for availability (HTTP/port) and one for correctness (keyword/heartbeat).
Monitoring budget & check interval planning
Once you finalize your monitoring setup, it’s important to plan your budget and resource allocation. Every monitor type introduces both cost and system load, depending on its check frequency and number of probe locations.
Frequent checks provide faster detection and tighter SLAs, but they also generate more data, higher API usage, and greater alert volume. Less frequent checks reduce cost and noise but may delay incident detection.
The goal is to find a balance between responsiveness and efficiency, ensuring that critical systems are monitored aggressively, while non-critical services are checked at more economical intervals.
Here is a quick check interval reference table you can use when planning your setup:
| Check interval | Detection speed | Cost/load | Use for |
| 1 minute | Fastest | Highest | Critical APIs, SLAs |
| 5 minutes | Balanced | Moderate | Public sites, dashboards |
| 15 minutes | Economical | Low | Low-priority or backup services |
| 1 hour+ | Minimal | Minimal | Long-running batch jobs |
Tip: Use short intervals for public endpoints or SLA-bound systems, and longer intervals for background tasks or low-traffic internal services.
Communicating incidents: status pages & transparency
The third and often most overlooked step in a monitoring strategy is communication. When outages occur, keeping your stakeholders informed builds trust and reduces uncertainty. Status pages and incident communication tools help you stay transparent throughout an incident, from detection to resolution.
Follow these best practices for incident communication:
- Public status pages: Share real-time uptime data and incident updates (e.g., status.example.com) to keep users informed without flooding support channels.
- Incident templates: Prepare predefined messages for common states such as degraded performance, partial outage, and resolved.
- Root-cause follow-ups: Publish post-incident summaries explaining what happened, what was fixed, and what improvements were made to prevent recurrence.
Also read: A comprehensive guide to status pages in 2026.
The monitoring setup essentials in one view
Here’s a quick summary of how to build and maintain an effective uptime monitoring system in real-world use:
- Use HTTP(S) monitoring to track core service availability and application responsiveness.
- Add SSL/TLS monitoring to maintain certificate health and secure connections.
- Use keyword monitoring to verify content correctness and detect logic-level or rendering errors.
- Include DNS monitoring to catch domain resolution or propagation issues early.
- Add heartbeat checks for internal or scheduled jobs to confirm that background tasks run reliably.
- Tune check intervals and alert logic to balance detection speed with alert noise and avoid fatigue.
Summary
No single monitor can tell the whole story. Real reliability comes from layering them: HTTP(S) for uptime, SSL for security, keyword for correctness, DNS for resolution, and heartbeat for background jobs. Together, they give you a complete picture of how your system truly behaves.
The power of monitoring lies in layering. When you combine different checks, you spot problems faster and understand them better. That’s what turns simple uptime tracking into reliable, real-world observability.
When you design your setup, remember to think in layers:
- Website or API? Start with HTTP(S).
- Need content verification? Add keyword.
- Behind a firewall or internal? Use port or heartbeat.
- Concerned about resolution or SSL? Add DNS and TLS checks.
Take a moment to audit your current monitoring setup. Make sure each critical layer is covered and nothing is left to chance. A few thoughtful adjustments today can save hours of firefighting tomorrow.
If you’re ready to put this into action, UptimeRobot makes it easy to build a layered monitoring stack that fits your exact needs. Simple to start, powerful as you grow!