TL;DR (QUICK ANSWER)
DNS security protects the Domain Name System, the backbone of how the internet works, from being hijacked, UDP monitoring checks how a service behaves, not just whether it responds. Because UDP doesn’t confirm delivery, issues like packet loss, jitter, and latency can degrade performance without triggering a clear outage.
Effective UDP monitoring relies on continuous checks, response validation, and tracking key metrics over time. UptimeRobot makes it easier to monitor UDP ports alongside other services, helping you detect problems early and avoid user-facing issues.
Some outages are obvious, others aren’t.
With UDP, or User Datagram Protocol, a service can stay technically “up” while silently dropping packets, adding latency, or failing intermittently. From the outside, everything looks fine. From the user’s perspective, it isn’t.
That’s what makes UDP harder to monitor and easier to miss.
UDP is built for speed. It powers real-time services like VoIP, video streaming, online gaming, and DNS. But because it doesn’t confirm delivery, it also creates blind spots that traditional monitoring can’t catch.
We’ll explain how UDP monitoring works, what metrics actually matter, and how to monitor UDP services in a way that reflects real performance, not just whether a port is open.

Key takeaways
- UDP prioritizes speed over reliability, which makes monitoring more complex
- A service can appear “up” while still dropping packets or responding inconsistently
- UDP monitoring focuses on behavior, including latency, jitter, and packet loss
- No response doesn’t always mean downtime; it can also indicate firewalls, packet loss, or invalid requests
- Key metrics to track include packet loss, jitter, latency, and throughput
- Monitoring should focus on ports tied to critical services like DNS, NTP, and VPN access
- UptimeRobot allows you to monitor UDP ports alongside HTTP, ping, and DNS checks from one dashboard
What is UDP and why is it harder to monitor?
UDP stands for User Datagram Protocol. It operates at the transport layer and is designed for speed and low overhead.
Instead of establishing a connection before sending data, UDP sends packets, called datagrams, directly to the destination. There’s no handshake, no confirmation, and no retransmission if something gets lost.
This is known as a best-effort delivery model. Data is sent, but delivery isn’t guaranteed.
Applications like VoIP, video streaming, online gaming, and DNS rely on UDP because they prioritize speed over perfect accuracy. A dropped frame or packet is usually less noticeable than a delay caused by retransmitting data.
From a monitoring perspective, this design creates a challenge.
With TCP (Transmission Control Protocol), a failed connection attempt is a clear signal. The handshake either completes, or it doesn’t. Monitoring tools can rely on that to determine whether a service is available.
With UDP, there’s no equivalent signal. A monitoring system can’t simply wait for a connection to fail. It has to send packets and interpret what happens next.
If a UDP probe gets no response, the cause isn’t always obvious. The service might be down, but the packet could also be dropped by a firewall, lost in transit, or ignored because the request wasn’t valid.
That ambiguity is what makes UDP monitoring more complex. Instead of a simple up or down check, it requires context, interpretation, and a better understanding of how the service is expected to behave.
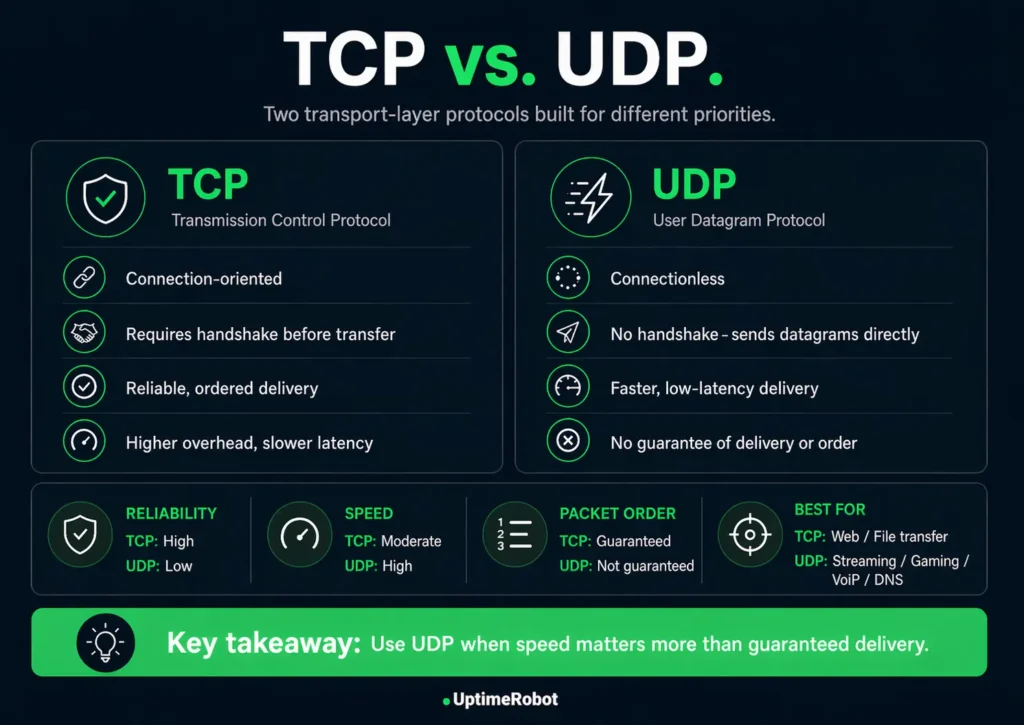
TCP vs. UDP: What’s the difference?
TCP and UDP both operate at the transport layer, but they’re built for different priorities.
TCP is designed for reliability. It establishes a connection before sending data and ensures everything arrives in the correct order. If something is lost, it retransmits it.
UDP takes a simpler approach. It sends data immediately, without waiting for confirmation or retrying failed packets. That makes it faster, but less predictable.
For monitoring, this changes what you can rely on.
TCP provides a clear signal through its connection process. If the handshake fails, the issue is immediately visible.
UDP doesn’t offer that signal. Availability alone isn’t enough to understand service health, so monitoring has to account for performance and consistency as well.
TCP vs. UDP comparison table
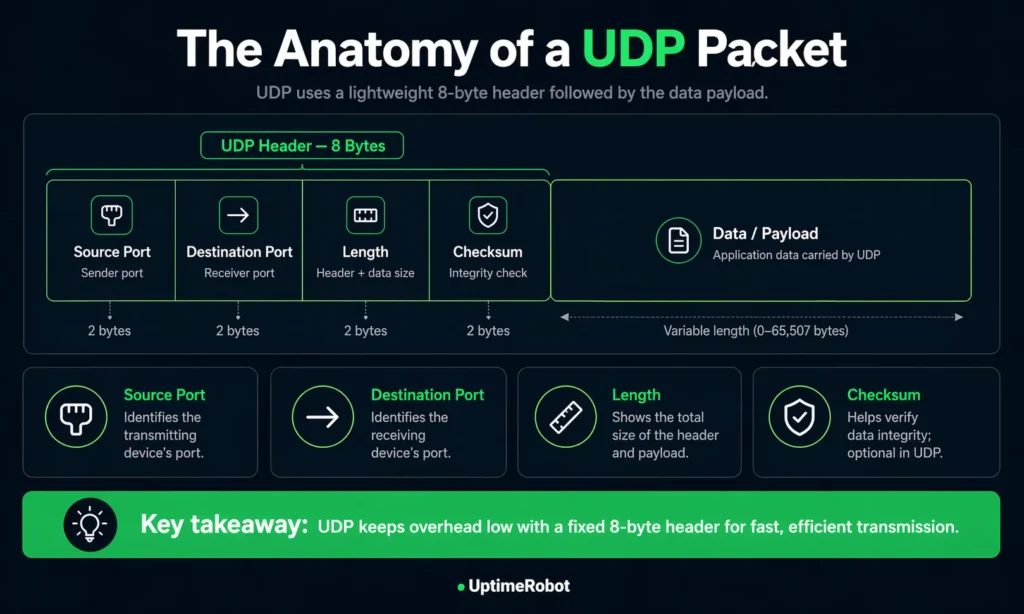
The anatomy of a UDP packet
UDP is intentionally lightweight, and that shows in how its packets are structured.
Each packet consists of a small header followed by the payload. The header is always 8 bytes long, which keeps overhead low and helps UDP stay fast.
The header includes four fields:
- Source port: identifies the sending application
- Destination port: identifies the receiving application
- Length: the total size of the header and payload
- Checksum: used to detect data corruption during transmission
The payload carries the actual data being sent.
Unlike TCP, UDP packets don’t include sequencing, acknowledgements, or retransmission logic. The protocol doesn’t track state or guarantee delivery. It simply sends data and moves on.
For monitoring, this matters.
Without delivery guarantees or connection state, there’s no built-in signal to confirm success. Monitoring has to rely on how a service responds over time, not just whether a packet was sent.
Anatomy of a UDP packet
What is UDP monitoring & how does it work?
UDP monitoring checks whether a UDP-based service is reachable, responsive, and behaving as expected over time.
A typical UDP check works like this:
- A monitoring system sends multiple UDP packets to a target host and port
- The service may respond, depending on how it’s configured and whether the request is valid
- The system evaluates whether a response is received within a defined timeout, how many packets are lost, and optionally, whether the response contains an expected value
If the response doesn’t meet these conditions, the check is marked as failed.
No response doesn’t always mean the service is down. The packet might be dropped by a firewall, lost in transit, or ignored because the request didn’t match what the service expects. Some services won’t respond at all unless the probe is correctly formatted.
Because of that, effective UDP monitoring focuses on behavior over time rather than single responses.
It looks at patterns like:
- Response consistency
- Latency trends
- Packet loss under real conditions
This is also why modern UDP monitoring setups go beyond “port open” checks.
Why basic UDP checks aren’t enough
One of the biggest challenges with UDP monitoring is avoiding false positives.
A generic UDP probe might get no response even when a service is working perfectly. For example, a DNS server will only reply to a properly formatted query. Sending a random packet to port 53 can make a healthy service look down.
On the flip side, a service might respond, but with incorrect or degraded data.
Effective UDP monitoring needs to reflect real service behavior.
Instead of relying on basic reachability checks, you can:
- Send protocol-specific payloads (such as DNS queries or SIP requests)
- Define acceptable packet loss thresholds
- Validate responses against expected patterns or keywords
These checks help distinguish between:
- A service that is unreachable
- A service that is reachable but misconfigured
- And a service that is responding incorrectly under load
Without this level of validation, UDP monitoring can produce misleading results, especially in production environments where firewalls, routing rules, and regional differences affect how traffic behaves.
With UDP, a port appearing open doesn’t mean the service is actually working. What matters is whether it responds correctly, consistently and from the regions your users depend on. That’s where proper monitoring makes the difference.
Alex Ioannides, Head of DevOps & Security, UptimeRobot
Key metrics UDP monitoring tracks
UDP issues often show up as gradual performance degradation rather than clear outages, which makes tracking the right metrics essential.
Here are the key metrics to focus on:
| Metric | What it measures | Why it matters | Typical threshold |
| Packet loss | Percentage of packets that never arrive | Even small losses degrade real-time services | <1% for VoIP, <0.5% for streaming |
| Jitter | Variation in packet arrival timing | Causes buffering, choppy audio, and lag | <30ms for VoIP |
| Latency (RTT) | Round trip time for packets | Affects responsiveness and user experience | <100ms ideal (RTT), <300ms max (RTT for real-time apps) |
| Throughput | Volume of data transmitted over time | Indicates capacity and load handling | Application-specific (validated through load testing, not fixed thresholds) |
Packet loss is usually the first warning sign. Even small increases can cause noticeable issues in voice and video applications.
Jitter is just as important. Irregular packet timing can disrupt playback even when overall loss is low.
Latency sets the baseline for responsiveness. If it climbs too high, interactions start to feel delayed or unresponsive.
Throughput identifies capacity issues. As a service approaches its limits, latency and packet loss often increase alongside it.
The key is to track these metrics continuously and establish a baseline for what “normal” looks like in your environment. Once you have that, deviations become much easier to detect and act on.
How to monitor UDP ports manually
Manual checks can help you quickly verify whether a UDP service is reachable or behaving as expected. They’re useful for troubleshooting, but they don’t replace continuous monitoring.
On Windows
You can use netstat -an in Command Prompt to list open ports and see which ones are using UDP.
Tools like TCPView provide a more visual way to inspect active connections and identify which processes are using specific ports.
On Linux
ss -tuln is the fastest way to list listening TCP and UDP ports. The older netstat -tuln command shows similar output but is less efficient on busy systems.
To map ports to processes, lsof -i is often the most useful option.
Active testing and packet inspection
For active checks, tools like nc -u (netcat in UDP mode) let you send packets to a specific port and observe whether the service responds.
Running tcpdump at the same time can help confirm whether packets are arriving at the target system, which is useful when diagnosing firewall issues or packet loss.
When manual checks are useful
These methods give you a snapshot of what’s happening at a specific moment. They can confirm whether a port is open or whether traffic is reaching a service, but they don’t track trends, detect intermittent issues, or trigger alerts.
Manual checks work best as a quick diagnostic step alongside automated monitoring, not as a replacement for it.
Automated UDP monitoring tools
Automated monitoring runs checks continuously and alerts you when something changes, giving you visibility you won’t get from one-off tests.
A good setup should let you:
- Run checks at regular intervals
- Define timeouts and failure thresholds
- Validate responses when needed
- Track performance metrics over time
- Send alerts through channels your team already uses
Some tools also support custom payloads, which helps when a service expects a specific type of request before responding.
There are several approaches to automated UDP monitoring.
Open-source tools like Zabbix or Nagios support UDP checks through plugins, though more advanced setups often require custom scripts. Prometheus with the Blackbox Exporter is another common option for teams already using a metrics-based stack.
For a simpler setup, UptimeRobot’s UDP monitoring lets you track the availability and behavior of UDP-based services without building custom scripts or tooling. You can configure a target host and port, define packet loss thresholds, send protocol-specific payloads, and validate responses using expected keywords.
The right choice depends on your setup. Smaller teams often prioritize ease of use, while larger environments may need deeper customization and integration with existing observability systems.
UDP monitoring in firewall and security contexts
UDP monitoring sits at the intersection of availability and security.
Checking whether a UDP port is reachable from outside your network tests both the service itself and the firewall rules and routing that allow traffic to reach it.
DNS is a good example. Most DNS traffic runs over UDP port 53. If a monitoring check gets no response, the issue isn’t always the DNS service itself.
It could be:
- A firewall blocking traffic
- A routing problem between networks
- Or, a misconfigured resolver
Monitoring tells you something is wrong, but it doesn’t always tell you where. That’s why it’s often useful to test from multiple locations or run checks from inside your network to narrow down the cause.
There’s also a security angle.
UDP is easier to exploit than TCP because it doesn’t require a connection. Attackers can send large volumes of packets without completing a handshake, and they can spoof source addresses more easily.
This is why UDP is commonly used in:
- DDoS flood attacks
- Amplification attacks (for example via DNS or NTP)
- Port scanning and probing
Monitoring surfaces these issues early.
Unusual spikes in traffic, inconsistent responses, or sudden drops in availability can all point to misconfigurations or malicious activity. Watching patterns over time makes it easier to spot anomalies before they escalate.
Monitoring tells you something is wrong, but not always where. Running checks from both outside and inside your network helps narrow it down. If a service responds internally but not externally, the issue is likely in firewall rules or routing rather than the service itself.
UDP monitoring in cloud and distributed environments
In real-world setups, UDP issues often show up in ways that aren’t immediately obvious. For instance, a DNS service might respond normally from one region but intermittently fail from another due to firewall rules or routing changes.
Internally, everything appears healthy, but users in affected regions experience timeouts or degraded performance. Without multi-location monitoring and response validation, this kind of issue can go unnoticed until it starts impacting users directly.
Monitoring UDP becomes more complex in cloud and distributed environments. As services spread across regions and dynamic infrastructure, endpoints increase and network paths become less predictable.
Cloud provider dashboards typically focus on infrastructure-level metrics such as CPU usage, network throughput, or instance health. While useful, they don’t always reflect how a UDP service behaves at the protocol level.
This creates blind spots. A latency spike or packet loss in one region may affect only a subset of users, while everything else appears normal. Without targeted monitoring, these issues are easy to miss.
Distributed systems also introduce more variability.
Latency and availability should be evaluated per region rather than against a single global threshold. A service can appear healthy from one location while being slow or unreachable from another, which is why multi-location monitoring is essential.
Dynamic infrastructure adds another layer. In environments like Kubernetes, services can move or restart frequently, which makes static monitoring setups tied to fixed IP addresses unreliable. Monitoring needs to adapt as the system changes, either through service discovery or flexible configuration.
Maintaining visibility as systems scale comes down to a few things:
- Running checks from multiple locations
- Tracking performance trends over time
- Adjusting thresholds based on real usage patterns
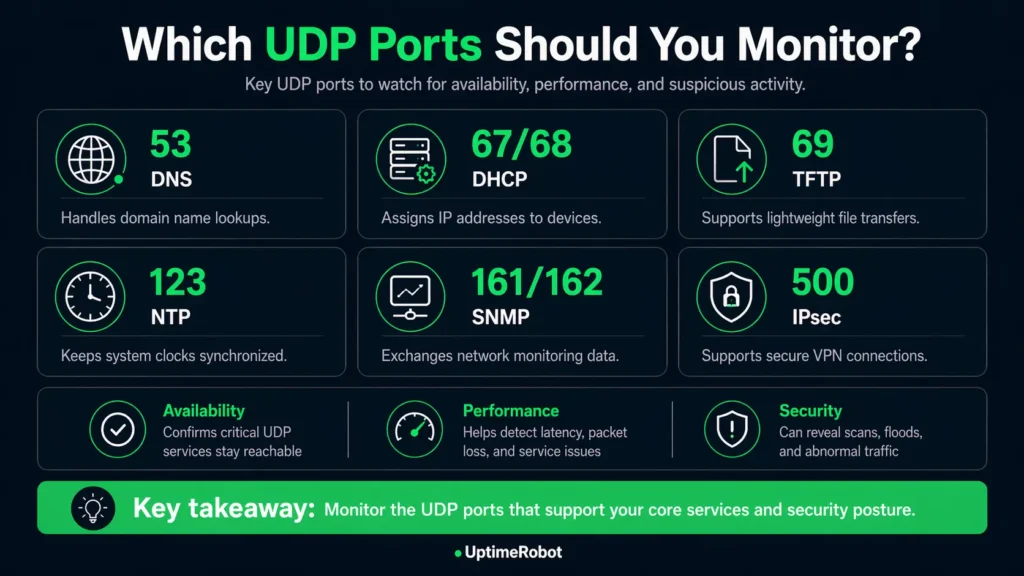
Which UDP ports should you monitor?
The ports you monitor should reflect how your systems actually operate.
There’s no universal list that fits every setup. A VoIP platform, a gaming server, and a SaaS application will all depend on different UDP services. Focus on the ports that support your core functionality and anything that could impact availability or security.
Some ports show up across many environments:
- Port 53 (DNS): Handles domain resolution. If this fails, users can’t reach your services even if everything else is running
- Ports 161/162 (SNMP): Used for monitoring network devices and infrastructure. If these go down, you lose visibility into your own systems
- Port 51820 / 1194 (VPN endpoints): Used by services like WireGuard and OpenVPN. Issues here block remote access and internal connectivity
- Port 5060 (SIP/VoIP): Supports call setup for voice systems. Instability leads to dropped or failed calls
Other UDP ports to monitor
Rather than monitoring everything, start with:
- Ports tied to user-facing services
- Infrastructure services that support connectivity and stability
- Any ports that are exposed externally or critical to security
From there, expand based on how your system behaves in production.
What to do next
Start with the UDP services your system actually depends on, such as DNS, VPN endpoints, or VoIP infrastructure. Focus on the ports behind those services instead of trying to monitor everything at once.
Make your checks reflect real usage. Use protocol-aware payloads so services respond properly, set packet loss thresholds that match acceptable performance, and validate responses with expected keywords where it makes sense.
Then watch how those services behave over time. Run checks from multiple locations, track latency, jitter, and packet loss trends, and base alerts on patterns rather than one-off failures.
If you want to set this up without extra tooling, UptimeRobot’s UDP monitoring supports packet loss thresholds, custom payloads, keyword validation, and multi-location monitoring from a single dashboard.
Join UptimeRobot to start monitoring your UDP services with just a few clicks and catch issues before they affect your users.
-
TCP monitoring checks connection-based services and verifies that a handshake can be established. UDP monitoring focuses on connectionless services, measuring responsiveness, latency, and consistency rather than relying on connection state.
-
It depends on how critical the service is and how quickly you need to detect issues.
For most setups, checks every few minutes are enough. For real-time or user-facing services, shorter intervals provide better visibility and faster detection.
Frequency is only part of the setup, though. Fast checks are most useful when alerts reach the right people immediately. Make sure notifications are routed through the channels your team already uses, whether that’s email, Slack, Microsoft Teams, PagerDuty, webhooks, or other integrations, so packet loss, latency spikes, or service outages can be investigated quickly.
With UptimeRobot’s UDP monitoring, you can run checks as frequently as every 30 or 60 seconds depending on your plan, which helps catch packet loss, latency spikes, or service degradation before they impact users. -
UDP monitoring can reveal packet loss, high latency, jitter, and inconsistent responses. It can also surface signs of network misconfiguration or abnormal traffic patterns.
-
Yes, UptimeRobot lets you set up multiple monitors across different services, networks, and locations from a single dashboard.
You can combine different monitoring types depending on your setup, including:
Website & endpoint monitoring for HTTP(S) services and APIs
Ping monitoring for basic network availability
Port monitoring or checking whether services are reachable on specific ports
Cron job monitoring to track scheduled tasks and background jobs
API monitoring for tracking API availability, response times, and endpoint performance across public or internal services
UDP monitoring for connectionless services like DNS or VoIP
Everything sits in one dashboard, so you don’t have to juggle separate tools for each type of check.