TL;DR (QUICK ANSWER)
Telemetry is the automated collection and transmission of data from systems. It produces metrics, logs, and traces that describe how applications and infrastructure behave in real time. Monitoring uses that data to detect known problems, while observability uses it to investigate unexpected ones.
A well-designed telemetry pipeline covers instrumentation, transport, storage, and analysis. Effective telemetry focuses on high-signal data with enough context to support debugging, alerting, and performance tuning without creating unnecessary noise, cost, or overhead.
In software systems, telemetry is what makes visibility possible. It captures things like response times, errors, resource usage, and request flows across services. That data is what monitoring tools, alerting systems, and observability platforms rely on to detect problems and understand why they happen.
Telemetry on its own doesn’t fix anything. But without it, teams are left guessing. As systems become more distributed and dynamic, telemetry is no longer optional.
It’s the foundation that makes reliable monitoring, alerting, and incident response possible.

Key takeaways
- Telemetry is the automated, continuous collection of data from systems, not a tool or platform on its own.
- Telemetry data powers monitoring, alerting, and observability workflows.
- Metrics, logs, and traces are the core types of telemetry data, each answering different questions.
- Monitoring uses telemetry to detect known problems. Observability uses it to explore unknown ones.
- Good telemetry focuses on signal quality, not data volume.
- Without reliable telemetry, teams lose visibility and incidents take longer to resolve.
What is telemetry?
Telemetry is the automated, continuous measurement and transmission of data from systems to a central place for analysis. In software and infrastructure, that means applications, services, and devices emitting data about their internal state and behavior without manual input.
The key idea is automation. Telemetry is generated constantly, in the background, as systems run. No one clicks a button or files a report. The data flows whether things are healthy or failing.
Telemetry is also foundational. It is not a dashboard, an alert, or an observability platform. It’s the raw input those tools depend on. Without telemetry, there is nothing to monitor, alert on, or investigate.
Another important distinction is intent. Telemetry data is produced for machines first, not humans. It is structured so it can be aggregated, queried, correlated, and analyzed at scale.
Human-readable views come later.
In short, telemetry answers a simple question: what is happening inside the system right now?
A short history of telemetry
Telemetry existed long before software systems did. The term comes from the Greek tele (remote) and metron (measure), and early forms of telemetry were developed to measure conditions in places humans couldn’t easily reach.
In the early 20th century, telemetry was used in industrial systems, railways, and utilities to transmit measurements like pressure, temperature, and voltage over electrical lines. These systems relied on analog signals and dedicated communication channels.
Telemetry took a major leap during the mid-20th century with aviation and space exploration. Aircraft began transmitting engine performance and flight data back to ground stations in real time. Space missions pushed this even further. Satellites and spacecraft relied entirely on telemetry to report internal conditions, navigation data, and system health from thousands of kilometers away.
As computing systems became networked, telemetry moved into digital infrastructure. In the 1980s and 1990s, servers and network devices started emitting metrics and logs that could be collected centrally. Protocols like SNMP (Simple Network Management Protocol) standardized how network telemetry was exposed and consumed.
The meaning of telemetry expanded again with distributed and cloud-native systems. Microservices, containers, and ephemeral infrastructure made manual inspection impossible.
Telemetry evolved from basic system metrics into rich streams of metrics, logs, and traces that describe how requests move through complex systems.
Today, telemetry helps teams see how complex, distributed software behaves while it’s running, not after something breaks.
How telemetry works end to end
Telemetry is a pipeline that moves data from running systems to people and automation that can act on it.
At a high level, the process follows the same flow across most environments.
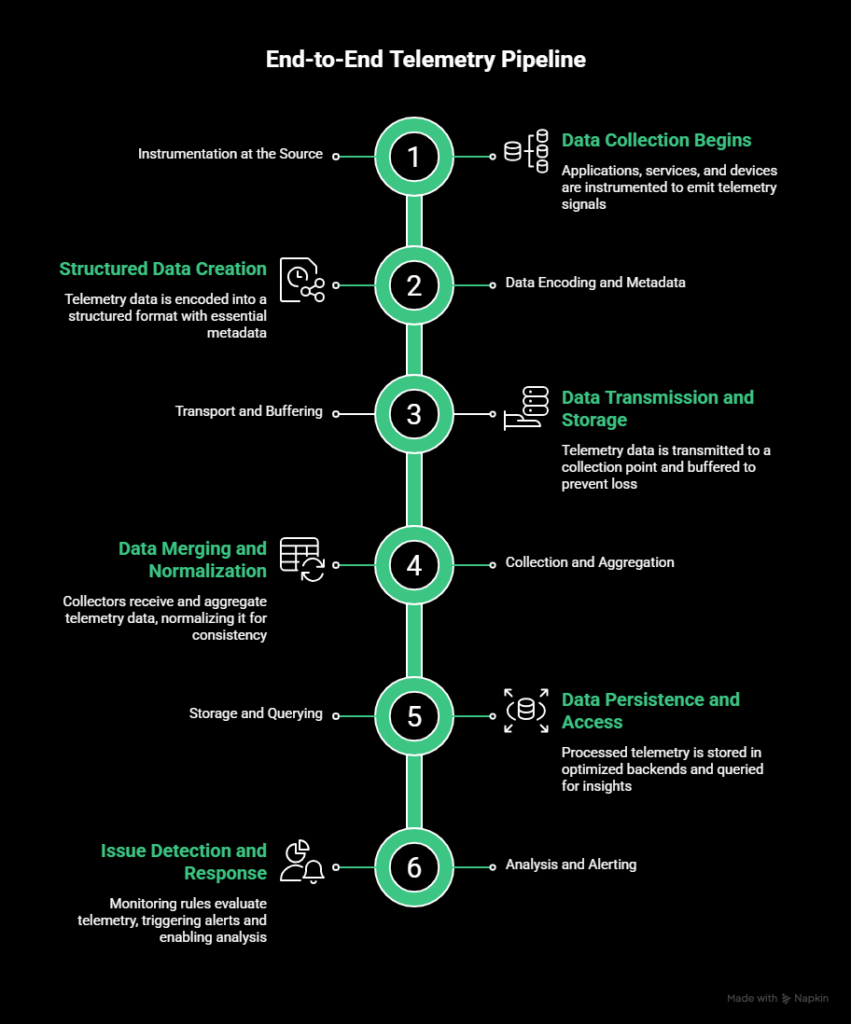
Instrumentation at the source
Telemetry begins where data is produced. Applications, services, and devices are instrumented to emit telemetry signals.
This can happen through libraries embedded in application code, system agents running on hosts, or external probes that observe behavior.
Instrumentation defines what data is collected. That might include request latency, error counts, memory usage, or the path a request takes through multiple services.
Data encoding and metadata
Once generated, telemetry data is encoded into a structured format. This step includes attaching metadata such as timestamps, service names, environments, regions, or request identifiers.
Good metadata is critical. Without it, telemetry becomes hard to filter, aggregate, or correlate across systems.
Transport and buffering
Telemetry data is then transmitted to a collection point. Depending on the system, this may happen through push-based models, pull-based scraping, message queues, or streaming protocols.
Because systems can fail or spike unexpectedly, telemetry pipelines usually include buffering. This prevents data loss during brief outages and smooths bursts of high-volume telemetry.
Collection and aggregation
Collectors receive telemetry data from many sources and aggregate it. This may involve merging streams, batching events, sampling traces, or dropping low-value data to control volume.
At this stage, telemetry is often normalized so different systems can be queried consistently.
Storage and querying
Processed telemetry is stored in backends optimized for different data types. Metrics are stored as time series, logs as indexed records, and traces as linked spans.
Query engines sit on top of storage to support dashboards, alerts, and ad hoc investigation.
Analysis and alerting
Finally, telemetry is used to detect issues and support decision-making. Monitoring rules evaluate telemetry against thresholds or conditions.
Alerts notify responders when action is required. Analysts and engineers query historical data to understand what happened and why.
This pipeline runs continuously.
Telemetry is always flowing, whether anyone is actively looking at it or not.
Types of telemetry data
Telemetry data usually falls into three core categories: metrics, logs, and traces. Each type captures a different aspect of system behavior. None of them is sufficient on its own.
Together, they provide a more complete view of what’s happening.
Metrics
Metrics are numeric values collected over time. They are structured, lightweight, and designed for aggregation.
Common examples include CPU usage, memory consumption, request latency, error rates, and request volume. Metrics are typically stored as time-series data, which makes them efficient to query and visualize over long periods.
Metrics are best for answering questions like:
- Is the system healthy?
- Is performance trending up or down?
- Did something cross a known threshold?
Because metrics are aggregated, they scale well and are ideal for dashboards and alerting. The tradeoff is context. Metrics can tell you that latency spiked, but not why it happened.
Logs
Logs are records of discrete events. They’re usually text-based and emitted when something happens, such as an error, a state change, or a completed operation.
Examples include error messages, stack traces, authentication attempts, and job execution output. Logs can be unstructured plain text or structured formats like JSON.
Logs are valuable for investigation. They provide details that metrics can’t, such as error messages, request payloads, or execution paths. They’re often the first place engineers look when diagnosing failures.
The downside is volume and cost. Logs grow quickly, can be noisy, and require careful indexing and retention strategies to stay manageable.
Traces
Traces describe how a single request moves through a system. They’re particularly important in distributed environments where a request may touch many services.
A trace is made up of spans. Each span represents an operation, such as a database query or an API call, along with timing and metadata. Spans are linked together to show the full path of a request.
Traces are best for answering questions like:
- Where is latency being introduced?
- Which service caused this request to fail?
- How do different components interact under load?
Because traces can be expensive to collect at scale, they are often sampled. Even partial trace data can reveal performance bottlenecks that metrics and logs miss.
Metrics vs. logs vs. traces
Each type answers different questions. Metrics show patterns. Logs explain events. Traces reveal flow. Effective telemetry systems collect all three and use them together.
| Data type | What it captures | Best for | Main limitation |
| Metrics | Numeric values over time | Health checks, trends, alerting | Limited context |
| Logs | Discrete event records | Debugging and root cause analysis | High volume and noise |
| Traces | Request-level flow | Distributed system debugging | Sampling and cost |
Telemetry vs. monitoring vs. observability
Telemetry, monitoring, and observability are often used interchangeably, but they’re not the same.
They represent different layers of system visibility, and confusing them usually leads to gaps in how teams detect and investigate issues.
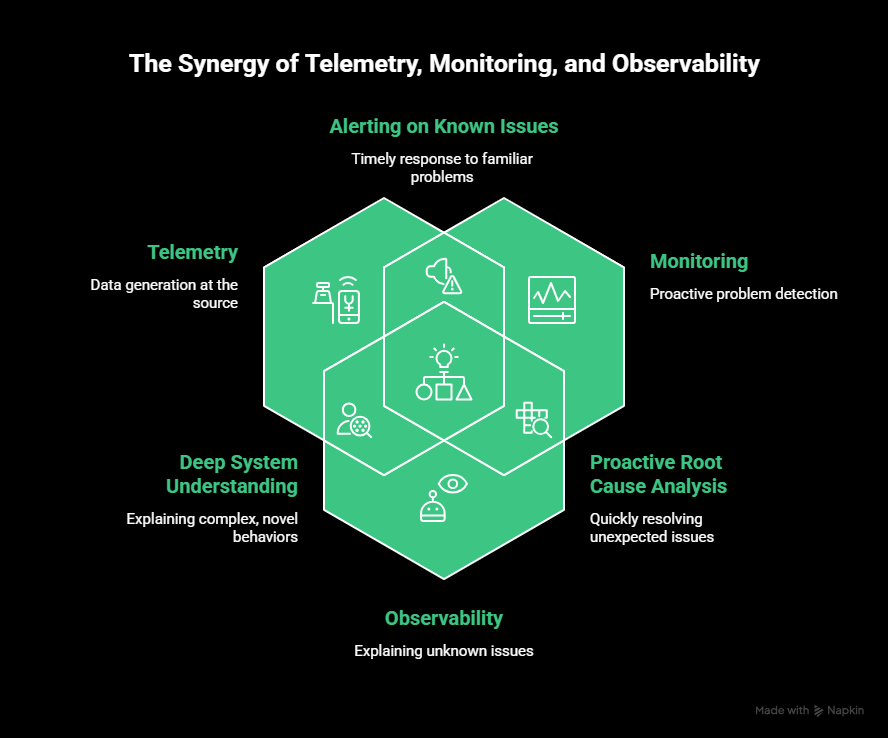
Telemetry: the raw data
To reiterate, telemetry is the data your systems emit. Metrics, logs, and traces all fall under telemetry. It is produced continuously and automatically by applications, services, and infrastructure.
Telemetry on its own does not answer questions or trigger action. It exists so other systems can do that work.
If telemetry stops flowing, monitoring and observability stop working with it.
Monitoring: answering known questions
Monitoring is what you build on top of telemetry. It uses predefined rules, thresholds, and conditions to detect known failure modes.
Examples include:
- Alert if error rate exceeds 1%
- Notify the team if response time stays above 500 milliseconds
- Mark a service as down if it fails multiple checks in a row
Monitoring is effective when you already know what can go wrong and how to detect it. It is especially useful for uptime, availability, and performance guarantees.
The limitation is that monitoring only answers questions you already thought to ask.
Observability: exploring unknowns
Observability is the ability to understand why a system behaves the way it does, especially in unexpected situations. It is not a single tool, but a property of how well your system exposes its internal state.
Observability relies on rich, high-quality telemetry. It allows engineers to ask new questions after an incident occurs, without redeploying code or adding new instrumentation.
For example:
- Why are requests slow only in one region?
- What changed just before this error pattern started?
- Which service introduced latency into this request path?
These are questions monitoring alone cannot answer.
How they fit together
The relationship is sequential:
- Telemetry produces the data.
- Monitoring watches for known problems.
- Observability helps explain unknown ones.
A system can have monitoring without observability, but it cannot have observability without telemetry. Strong telemetry makes both monitoring and observability more effective.
Telemetry architecture and pipelines
Telemetry architecture describes how data moves from running systems to the tools that analyze and act on it. A good telemetry pipeline is reliable, scalable, and flexible enough to evolve as systems change.
At a high level, telemetry architecture is about four decisions: where data is collected, how it is transported, how it is processed, and where it is sent.
Agent-based vs. agentless telemetry
One of the first design choices is how telemetry is collected.
Agent-based telemetry uses software agents or SDKs that run alongside applications or on hosts. These agents collect metrics, logs, and traces directly from the system. This approach offers deep visibility and fine-grained control, but it adds operational overhead and requires maintenance.
Agentless telemetry relies on external checks, APIs, or platform integrations to collect data without installing software on the target system. This simplifies the setup, but usually provides less detail.
Most modern environments use a mix of both. Agents handle internal signals like resource usage or traces, while agentless approaches monitor external behavior such as availability or response time.
Collectors, gateways, and aggregators
Telemetry rarely flows directly from every system to a final storage backend. Instead, it passes through intermediate components that manage scale and reliability.
Collectors receive telemetry data from many sources and act as a central intake point. Gateways sit between environments and external systems, controlling traffic and enforcing security or rate limits. Aggregators combine and batch data to reduce volume and improve efficiency.
These layers make it easier to:
- Buffer data during spikes or outages
- Apply consistent processing rules
- Route different telemetry types to different destinations
This separation also prevents telemetry pipelines from becoming a single point of failure.
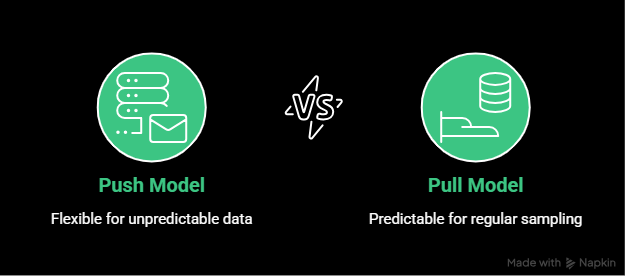
Push vs. pull models
Telemetry systems typically use one of two collection models.
In a push model, systems send telemetry data to a collector or endpoint as events occur. This is common for logs and traces, where data volume and timing are unpredictable.
In a pull model, a central system periodically requests data from endpoints. This is common for metrics, where regular sampling is useful and predictable.
Each model has tradeoffs. Push models are flexible but can overload receivers if not controlled. Pull models are easier to reason about but require endpoints to be reachable and responsive.
Most modern telemetry pipelines support both, depending on the signal type.
Edge vs. centralized collection
As systems become more distributed, telemetry collection increasingly happens at the edge.
Edge collection means processing telemetry close to where it is generated. Processing telemetry closer to the source can lower latency, reduce bandwidth costs, and limit data exposure, especially in IoT, mobile, and globally distributed systems.
Centralized collection simplifies management and querying, but can become expensive or slow at scale.
Many architectures use a hybrid approach. Telemetry is partially processed or sampled at the edge, then forwarded to centralized systems for long-term storage and analysis.
Telemetry pipelines in practice
A typical telemetry pipeline looks like this:
- Applications and services emit telemetry data.
- Agents or SDKs collect and enrich it.
- Collectors aggregate and buffer it.
- Data is routed to storage and analysis systems.
- Monitoring and alerting act on it.
The key point is that telemetry is a flow, not a point-in-time action. Designing this pipeline thoughtfully determines how usable, reliable, and cost-effective your telemetry will be over time.
Telemetry standards and open ecosystems
As telemetry became central to modern systems, fragmentation quickly became a problem.
Different tools collected data in different formats, used different naming conventions, and required custom instrumentation. That made it hard to switch vendors, correlate data, or scale observability without rework.
Telemetry standards exist to solve that.
Why telemetry standards matter
Without shared standards, telemetry pipelines become brittle. Teams end up locked into specific vendors or forced to maintain parallel instrumentation paths for metrics, logs, and traces.
Standards help by:
- Defining common data formats and protocols
- Making telemetry portable across tools
- Reducing duplicate instrumentation work
- Improving consistency across teams and services
In practice, this means you can change where telemetry data is sent without changing how it’s collected.
OpenTelemetry as the common layer
OpenTelemetry has emerged as the de facto standard for telemetry collection. It provides a unified framework for generating, processing, and exporting metrics, logs, and traces.
OpenTelemetry includes:
- Language-specific SDKs for instrumenting application code
- Agents and collectors for infrastructure-level telemetry
- A common protocol for transporting telemetry data
- Semantic conventions that standardize naming and metadata
The most important idea behind OpenTelemetry is vendor neutrality. You instrument once and decide later where the data goes.
Vendor-neutral instrumentation
With OpenTelemetry, telemetry data can be routed to multiple backends without re-instrumenting applications. Metrics might go to one system, logs to another, and traces to a third.
That flexibility matters when:
- Teams use different tools for different signals
- Organizations migrate between observability platforms
- Cost or performance requirements change over time
It also lowers risk. Telemetry stops being tied to a single product decision.
Consistency through semantic conventions
OpenTelemetry defines semantic conventions for common concepts like HTTP requests, databases, messaging systems, and cloud resources. These conventions standardize attribute names and structures.
Consistent semantics make telemetry easier to query, correlate, and share across teams. They also ease confusion when dashboards or alerts span multiple services.
Standards unfortunately don’t eliminate complexity, but they contain it. They give teams a stable foundation to build observability without constantly reworking instrumentation.
Telemetry data quality and best practices
Collecting telemetry is easy. Collecting useful telemetry is harder.
High-quality telemetry improves incident response and system understanding. Poor-quality telemetry creates noise, cost, and false confidence.
Focus on signal, not volume
More data doesn’t automatically mean better visibility. Collecting everything often makes for dashboards full of metrics no one trusts.
Good telemetry prioritizes signals that reflect real system health and user impact.
That usually means:
- Fewer, well-chosen metrics
- Logs that capture failures and state changes, not every success
- Traces that focus on critical request paths
If telemetry doesn’t influence decisions or alerts, it’s probably not worth collecting.
Manage cardinality deliberately
High-cardinality data, such as user IDs or request IDs, is powerful but expensive. It increases storage cost and query complexity.
Use high-cardinality attributes where they add investigation value, especially in logs and traces. Avoid them in metrics unless they’re strictly controlled.
Sampling and aggregation help strike a balance between visibility and cost.
Add context through enrichment
Telemetry without context is hard to interpret. Adding metadata like environment, region, service name, or deployment version makes data far more useful.
Context allows teams to:
- Compare behavior across environments
- Correlate incidents with releases
- Filter noise during investigations
Enrichment should happen early in the pipeline so all downstream systems benefit.
Keep naming consistent
Inconsistent naming is one of the fastest ways to degrade telemetry quality. Agree on naming conventions for metrics, log fields, and trace attributes.
Consistent naming makes dashboards easier to read and prevents alerts from breaking due to mismatched names.
Validate the pipeline itself
Telemetry pipelines fail in the form of agents crashing, collectors backing up, and data drops without obvious errors.
Monitor the telemetry pipeline like any other production system. Alert on missing data, ingestion delays, and processing failures. Telemetry you can’t trust is worse than telemetry you don’t have.
Challenges and tradeoffs of telemetry
Telemetry makes modern systems observable, but it also introduces real costs and constraints. Collecting data at scale isn’t free, and poorly designed telemetry can slow teams down instead of helping them move faster.
Understanding these tradeoffs is instrumental to building telemetry that actually supports operations.
Data volume and cost
Telemetry data grows quickly. Metrics are relatively cheap, but logs and traces can explode in volume, especially in high-traffic or highly distributed systems.
Storage, indexing, and querying all add cost. Retention policies become a balancing act between historical insight and budget. Many teams discover too late that collecting everything by default is unsustainable.
The tradeoff is visibility versus cost. Reducing volume through aggregation, sampling, or shorter retention windows saves money, but limits how far back you can investigate incidents.
Performance overhead
Instrumentation adds overhead. Emitting metrics, writing logs, and propagating trace context all consume CPU, memory, and network bandwidth.
In most cases this overhead is small, but at scale it becomes noticeable. Poorly implemented instrumentation can increase latency or amplify load during traffic spikes.
Teams must balance observability depth with system performance, especially in latency-sensitive services.
Noise vs. signal
Telemetry is only useful if it highlights what matters. Collecting too many low-value signals creates noise that hides real issues.
This shows up as:
- Dashboards with hundreds of unused metrics
- Alerts firing constantly for non-critical conditions
- Logs that bury meaningful errors in routine output
Limiting noise requires deliberate choices about what to collect and how to alert on it. This often means saying no to some data, even if it is easy to collect.
Alert fatigue and false positives
Telemetry feeds alerting systems, and poorly tuned telemetry leads directly to alert fatigue. If teams are paged too often for low-impact events, they stop responding quickly or mute alerts entirely.
The tradeoff is sensitivity versus trust. Aggressive alerts catch issues early but increase false positives. Conservative alerts reduce noise but risk slower detection.
Good telemetry supports layered alerting, where high-confidence signals trigger immediate response and lower-confidence signals provide context rather than pages.
Privacy and compliance risks
Telemetry can unintentionally capture sensitive data. Logs and traces may include user identifiers, request payloads, or personal information if not carefully controlled.
This creates compliance risks under regulations such as GDPR or HIPAA. Scrubbing or redacting sensitive fields protects users, but can remove context that engineers rely on during debugging.
Teams need clear policies about what data is allowed in telemetry and regular audits to enforce them.
| Challenge | What goes wrong | Practical mitigation |
| Data volume and cost | Logs and traces grow rapidly. Storage, indexing, and querying costs scale faster than expected. | Use sampling for traces, aggregate metrics, shorten retention windows, and tier storage (hot vs cold). Avoid collecting everything by default. |
| Performance overhead | Instrumentation consumes CPU, memory, and bandwidth. Poor implementation can increase latency under load. | Benchmark instrumentation impact. Use lightweight agents. Apply adaptive sampling. Avoid excessive synchronous logging in hot paths. |
| Noise vs signal | Dashboards fill with unused metrics. Alerts trigger on low-impact events. Important signals get buried. | Define clear signal ownership. Remove unused metrics regularly. Alert on user impact, not raw system fluctuations. |
| Alert fatigue and false positives | Teams get paged too often and start ignoring alerts. Trust in alerting drops. | Use layered alerting. Separate paging alerts from informational alerts. Tune thresholds using real incident history. |
| Privacy and compliance risks | Logs and traces capture sensitive data unintentionally. Regulatory exposure increases. | Enforce structured logging. Redact sensitive fields at ingestion. Define allowlists for telemetry attributes. Audit telemetry pipelines regularly. |
Telemetry use cases across industries
Telemetry is not limited to software platforms. Any system that needs to operate reliably at scale uses telemetry to understand its behavior and respond to change.
Software and DevOps
In software systems, telemetry supports uptime monitoring, performance optimization, and incident response. Engineers use telemetry to track latency, error rates, resource usage, and request flows across services.
Teams use this data to detect outages, assess deployment impact, and debug production issues.
IoT and edge systems
IoT devices rely on telemetry to report sensor readings, device health, and connectivity status from remote or constrained environments.
Telemetry facilitates proactive maintenance, fleet monitoring, and anomaly detection when physical access is limited or impossible.
Telecommunications
Telecom systems use telemetry to monitor network performance, signal quality, and traffic patterns across large, distributed infrastructures.
Real-time telemetry lets operators detect congestion, outages, or degradation before
customers are affected.
Automotive and transportation
Modern vehicles generate telemetry from sensors, control systems, and onboard computers. That data supports diagnostics, predictive maintenance, and safety systems.
In fleet environments, telemetry is used to track vehicle health, location, and efficiency across thousands of assets.
Healthcare and medical devices
Telemetry in healthcare supports continuous monitoring of patient vitals and medical device status. It’s needed for early intervention, remote care, and operational oversight in clinical environments.
Strict privacy and reliability requirements make telemetry quality especially critical in this domain.
Environmental and infrastructure monitoring
Telemetry is widely used to track environmental conditions such as air quality, weather patterns, water levels, and energy usage.
These systems often operate at large scale and rely on telemetry to detect changes, trigger alerts, and support long-term analysis.
The future of telemetry
Telemetry is shifting from passive data collection to active system understanding. As systems become more complex, telemetry needs to do more than report raw signals. It needs to provide context, reduce noise, and support faster decisions.
Smarter analysis and anomaly detection
Static thresholds don’t scale well. Future telemetry systems rely more on adaptive baselines and anomaly detection that learn normal behavior over time.
Instead of alerting when a metric crosses a fixed value, systems can detect when behavior deviates from expected patterns based on time, load, or environment.
Better correlation across signals
Metrics, logs, and traces are increasingly analyzed together rather than in isolation. Correlating these signals makes it easier to move from detection to explanation.
For example, a latency spike becomes more useful when it is automatically linked to a specific trace pattern, deployment change, or error log cluster.
Telemetry closer to the edge
As workloads move closer to users and devices, more telemetry processing happens at the edge. It lowers bandwidth costs, reduces latency, and makes it easier to comply with data residency rules.
Edge-aware telemetry also supports environments where connectivity is intermittent or constrained.
Telemetry as part of incident response
Telemetry is becoming more tightly integrated with alerting and incident workflows. Instead of separate systems, telemetry increasingly feeds directly into response tooling, automation, and post-incident analysis.
The overarching goal is shorter feedback loops. Less time spent collecting context, more time spent resolving issues.
Telemetry is no longer just about visibility. It is becoming a core input to how systems adapt, recover, and improve over time.
Final thoughts
Telemetry is the foundation of modern system visibility. It is how applications, services, and devices report what they are doing in real time, without waiting for someone to ask.
Metrics show trends. Logs explain events. Traces reveal how requests move through distributed systems. Together, they make monitoring possible and observability meaningful.
Good telemetry depends on a well-designed pipeline that captures the right signals, adds context, and limits noise, but poor telemetry creates blind spots and alert fatigue.
As software systems grow more distributed and dynamic, telemetry becomes less of an add-on and more of a requirement. If you want reliable monitoring, effective alerting, and real observability, it starts with getting telemetry right.
FAQ's
-
No. Telemetry is the data your systems produce. Monitoring uses that data to detect known problems through predefined rules and alerts. Monitoring depends on telemetry, but telemetry exists independently of monitoring.
-
Telemetry data is used to understand system behavior, detect failures, analyze performance, and investigate incidents. It powers dashboards, alerts, and observability workflows across software, infrastructure, and physical systems.
-
Yes. Monitoring only works for conditions you already expect. Telemetry provides the raw signals needed to investigate unexpected issues, understand system behavior, and support observability.
-
OpenTelemetry is an open standard for collecting metrics, logs, and traces. It allows teams to instrument systems once and send telemetry data to different tools without being locked into a specific vendor.
-
Telemetry is too much when it adds cost, noise, or confusion without improving decisions or response time. Good telemetry prioritizes high-signal data and uses sampling, aggregation, and retention policies to stay manageable.
-
No. Telemetry is used in many domains, including IoT, healthcare, automotive systems, telecommunications, and environmental monitoring. Any system that needs remote visibility and reliable operation can benefit from telemetry.