TL;DR (QUICK ANSWER)
Bandwidth is the maximum data capacity of a network connection, not a guarantee of performance. Real-world performance depends on latency, throughput, congestion, and traffic patterns.
Monitoring usage over time helps you plan for peaks, control costs, and prevent slowdowns during sustained load.
Optimizing payload size, caching, and traffic bursts reduces strain without simply buying more capacity.
When you work in tech, bandwidth is a fundamental pillar of understanding. It affects how fast data moves (not to be confused with speed), how systems communicate, and how users experience your product. And if you’ve ever troubleshot performance issues or scaled infrastructure, it’s probably been front and center on your dashboard.
Even though it may seem like it, bandwidth isn’t just a number on a spec sheet, but a real-world constraint that impacts everything from page load times to cloud costs.
We’ll cover how bandwidth impacts performance, reliability, and user experience, and how to work with it instead of just reacting to it.

Key takeaways:
- Bandwidth measures data capacity over a network connection
- It directly affects load times, streaming, and app responsiveness
- Different use cases require different bandwidth levels
- Monitoring bandwidth helps prevent bottlenecks and outages
- Throttling and data caps can limit real-world performance
What is bandwidth?
Bandwidth is the maximum amount of data that can be transmitted over a network connection in a given period of time.
It’s measured in bits per second, usually Mbps or Gbps. When someone says they have a 100 Mbps connection, they’re describing the maximum capacity of that link.
Bandwidth is about how much data can move at once. It’s not a guarantee of how fast everything will feel.
Theoretical vs. effective bandwidth
The number on your plan or hosting contract is the theoretical maximum. That’s the best-case scenario under ideal conditions. In real-world usage, effective bandwidth is lower.
Capacity gets reduced by:
- Network congestion
- Shared connections
- Protocol overhead
- Packet loss
- Hardware limits
A 100 Mbps connection doesn’t mean you will consistently transfer 100 megabits every second.
It means that is the ceiling. What you actually get depends on everything happening on that connection at the same time.
Maximum capacity vs. actual usage
Bandwidth sets the limit and usage determines performance.
If multiple users or services share the same link, they compete for that capacity. As demand increases, the available bandwidth per request drops.
This is why advertised bandwidth rarely matches real-world performance. The capacity may be there, but it is rarely used under perfect conditions.
Bandwidth defines the upper bound. How close you get to that bound depends on traffic patterns, network conditions, and how efficiently your systems use the connection.
Bandwidth vs. speed vs. latency vs. throughput
If you’re monitoring uptime, diagnosing slow load times, or optimizing APIs, knowing the difference between these terms will keep you from applying the wrong fix when you encounter an issue.
We’ve already defined bandwidth as the maximum data capacity of a connection, so we’ll only cover the other 3 in this section.
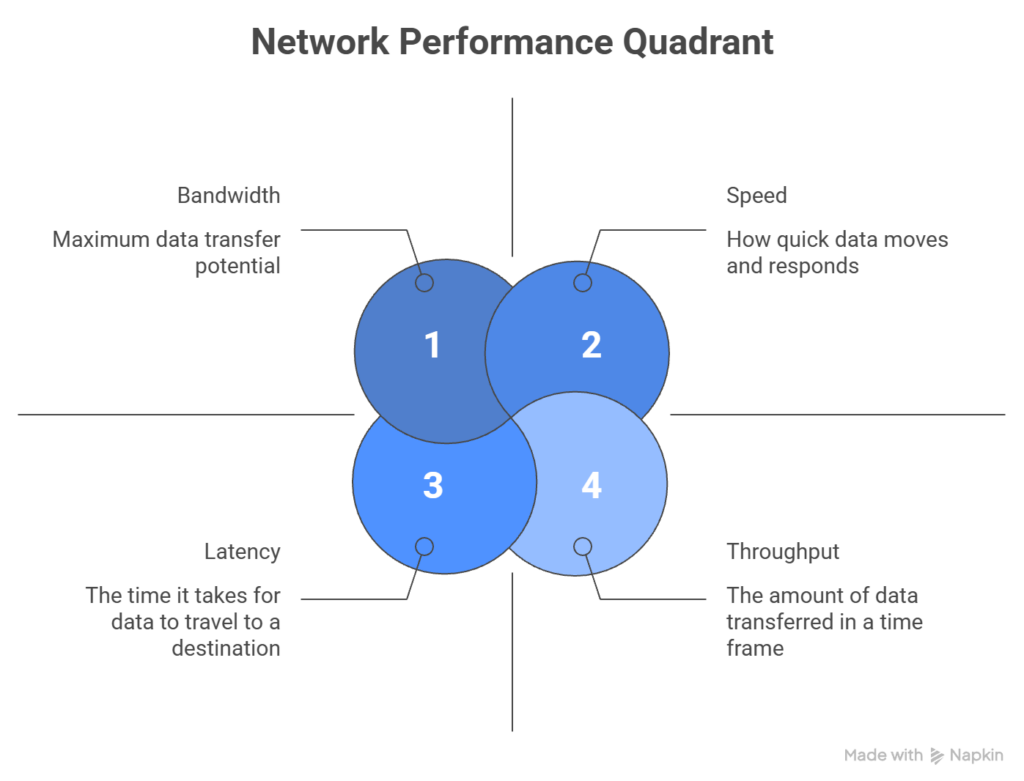
Speed: how fast data travels
Speed is a vague term in networking. Most people use it to mean how quickly data moves from point A to B, but that’s actually a combination of bandwidth and latency, not speed.
When someone says their internet is “fast,” that usually means:
- High bandwidth (lots of data at once)
- Low latency (minimal delay)
- High throughput (actual performance)
So, speed is more of a perceived experience, not something you can measure directly.
Latency: the delay before data moves
Latency is the time it takes for a data packet to travel from the source to the destination, measured in milliseconds (ms). Lower latency means faster response times, and higher latency means slower response times.
Example: A 20 ms latency means it takes 20 milliseconds for a request to reach the server and start processing.
For real-time applications like VoIP, gaming, or live monitoring dashboards, latency matters much more than bandwidth. You could have a 1 Gbps connection, but if the latency is 300 ms, the performance will still be sluggish.
Throughput: the data transfer rate
Throughput is the amount of data successfully transferred over a network in a specific time frame. It’s often lower than the theoretical bandwidth due to congestion, latency, packet loss, or hardware limits.
Example: On a 100 Mbps connection, if you’re consistently getting 60 Mbps during peak hours, your throughput is 60 Mbps.
How bandwidth, speed, latency, and throughput interact
Here’s how these 4 concepts relate:
| Concept | What it measures | Units | Affected by |
|---|---|---|---|
| Bandwidth | Max data capacity | Mbps, Gbps | ISP plan, hardware, network type |
| Latency | Delay before data transfer starts | ms | Distance, routing, congestion |
| Throughput | Actual data transferred | Mbps, Gbps | Bandwidth, latency, packet loss |
| Speed | Perceived performance | N/A (subjective) | All of the above |
While these terms denote different aspects of your network, a bottleneck in any one of them can degrade performance.
For example:
- High bandwidth with high latency will still feel slow
- Low throughput with good bandwidth and latency might indicate packet loss.
- Low latency with low bandwidth may cause your connection to break under heavy traffic
What are the types of bandwidth?
Bandwidth is not limited to internet speed. It exists at multiple layers of a modern stack, from network connections to internal hardware components.
Understanding where bandwidth lives helps you identify bottlenecks more accurately.
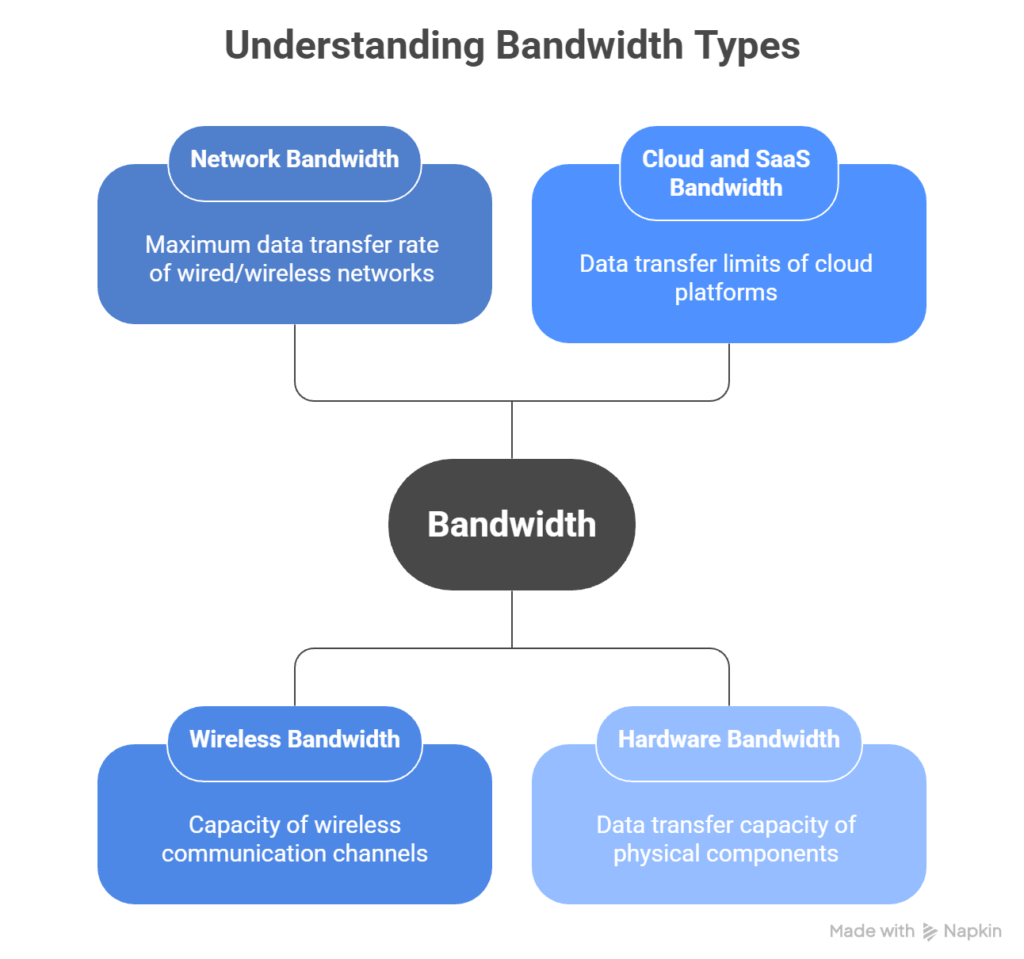
Network bandwidth
Network bandwidth is the maximum data transfer rate of a wired or wireless network connection, measured in Mbps or Gbps. This is the bandwidth most people think of when talking about internet speed.
In practical terms, network bandwidth defines how much data can move between two points, like a server and a client, within a given time.
In a SaaS context, network bandwidth affects:
- How fast users can load your app
- How quickly APIs respond
- How well real-time features like video or chat perform
If your monitoring tool tracks latency and packet loss alongside bandwidth usage, you’ll know whether slowness is due to network limits or something else.
Wireless bandwidth
Wireless bandwidth refers to the capacity of Wi-Fi, cellular, or other radio-based connections.
Unlike wired links, wireless bandwidth is shared and more variable. Signal strength, interference, and device density all affect effective capacity.
A Wi-Fi router rated at 600 Mbps does not provide 600 Mbps to each device. That capacity is divided across connected clients and reduced by environmental factors.
Wireless bandwidth limitations often show up as inconsistent performance rather than total outages.
Cloud and SaaS bandwidth
Cloud and SaaS bandwidth covers the data transfer limits and throughput capabilities of cloud platforms and SaaS providers, including both ingress (data coming in) and egress (data going out) bandwidth.
Many cloud providers charge for outbound data. High-volume APIs, media delivery, or cross-region replication can significantly increase costs.
Bandwidth constraints at this layer affect how quickly services sync data, serve assets, or respond to requests under load.
Hardware bandwidth
Hardware bandwidth is the data transfer capacity inside a machine. This includes memory bandwidth, disk I/O bandwidth, and network interface capacity.
For example, a high-speed SSD may support thousands of MB per second, but performance is still limited by bus speed, CPU throughput, or NIC capacity.
In high-performance systems, internal bandwidth can become the bottleneck even when network capacity is sufficient.
How bandwidth works in practice
Bandwidth sounds simple: data per second. In actuality, it’s shaped by how packets move, how traffic competes, and how long the load lasts.
Packet transmission basics
Data doesn’t travel as one continuous stream, it’s instead broken into packets.
Each packet includes:
- Payload data
- Routing information
- Protocol overhead
Routers forward packets hop by hop until they reach their destination. Along the way, packets can be delayed, reordered, or dropped. If packets are lost, they’re retransmitted, which increases total bandwidth usage and lowers effective performance.
So, even if your connection is rated at 100 Mbps, packet behavior affects what you actually experience.
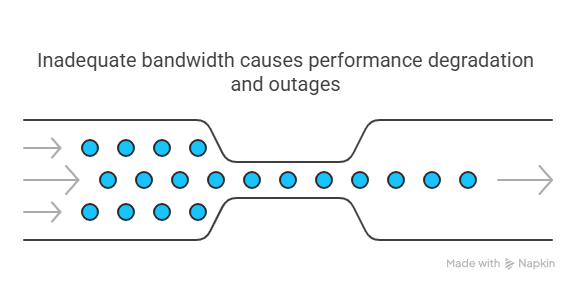
Congestion and contention
Bandwidth is shared. On a local network, devices compete for available capacity. In cloud environments, virtual machines share physical interfaces. On the public internet, traffic competes across multiple routing paths.
When demand exceeds available capacity, the network starts queueing packets. Those queues introduce delay. If buffers fill up, packets get dropped and retransmitted. As that cycle repeats, latency increases and effective throughput declines. That’s congestion.
Contention is similar, but more localized. It happens when multiple users or services share the same link or interface.
For instance:
- Multiple tenants on shared hosting
- Multiple services using the same API gateway
- Several internal jobs running at once
Performance doesn’t degrade evenly, it becomes inconsistent.
Bursty vs. sustained traffic
Short bursts are easy to handle. Sustained pressure is not.
A connection might tolerate brief spikes without visible issues. But if traffic remains elevated for minutes or hours, queues grow and performance drops.
Examples:
- A marketing campaign driving steady traffic
- A nightly data export running for 45 minutes
- A background sync process pushing large payloads
Sustained load exposes weak points faster than short spikes.
Why short speed tests are misleading
Speed tests measure performance under controlled conditions for a short period of time.
They usually:
- Run a single large transfer
- Test when the network is relatively idle
- Avoid real-world contention
That doesn’t reflect production behavior.
Real systems deal with many concurrent requests, mixed payload sizes, protocol overhead, and variable routing paths. A connection that benchmarks well in isolation can struggle under real traffic patterns.
Bandwidth performance is situational. It depends on who else is using the connection, how long traffic lasts, and how efficiently data is transmitted.
How much bandwidth do you really need?
How much bandwidth is enough depends on your traffic patterns, payload sizes, and growth expectations. Here’s what to consider.
Start with your baseline traffic
If your site or app is already live, check your current usage. Most hosting providers and CDNs offer bandwidth usage reports.
Look at:
- Average daily and monthly usage in gigabytes or terabytes
- Peak usage during traffic spikes or product launches
- Download-heavy endpoints like media files, reports, or large API responses
If your site averages 200 GB per month but spikes to 500 GB during campaigns, plan for the peak, not the average.
If you’re launching something new, here’s how you can estimate based on expected traffic with a simple formula:
(Average page size in MB) × (Monthly visitors) × (Pages per visit)
So, if your average page is 2 MB, and you expect 10,000 monthly visitors viewing 3 pages each, you get:
2 MB × 10,000 × 3 = 60,000 MB or ~58.6 GB per month
Add a 20-30% buffer to absorb traffic spikes and growth.
Factor in API and backend usage
For API-driven apps, bandwidth isn’t just about web traffic.
You’ll also need to account for:
- API response sizes: JSON and XML payloads add up fast
- Frequency of requests: High-frequency polling or third-party integrations drive usage
- Mobile and IoT clients: Make smaller requests, but at higher volume
If your API returns 100 KB per call, and averages 50,000 calls per day:
100 KB × 50,000 = ~4.77 GB per day, or ~143 GB per month
That’s one endpoint. Then, you multiply by the number of endpoints and clients to get a full picture.
Consider media, downloads, and third-party usage
If you host video, audio, or downloadable files, bandwidth needs will spike quickly. A single 100 MB video downloaded 1,000 times per month adds 100 GB to your usage.
You should also check for:
- Embedded third-party content routed through your domain
- Public APIs or status pages that external users hit frequently
- Monitoring tools that ping your endpoints regularly (like UptimeRobot)
Match bandwidth to hosting and CDN limits
Once you know your estimated usage, compare it to your hosting or CDN (content delivery network) plan. Some providers throttle speed after a certain limit, while others charge overage fees.
If you’re using a CDN, make sure it’s caching static assets effectively. That alone can cut origin server bandwidth by 60-90%, depending on your cache hit ratio.
Don’t forget internal and staging environments
Internal tools, staging servers, and CI/CD pipelines also consume bandwidth, especially if they run automated tests or sync large datasets regularly. This is easy to overlook because it’s not user-facing traffic, but the reports will catch your team off guard at the end of the month.
If your team runs performance tests or deploys often, include that in your estimate from the start.
Once you have a handle on your usage, the next step is to ensure you’re tracking it in real-time.
Measuring and monitoring bandwidth
Measuring bandwidth once is not the same as monitoring it over time.
A bandwidth test measures the maximum capacity of a connection at a specific moment. It tells you what the link can handle under test conditions.
Monitoring tracks real usage continuously. It shows how much bandwidth is actually being consumed during normal operations, traffic spikes, and deployments.
Both are useful, but they answer different questions.
What bandwidth monitoring tracks
Bandwidth monitoring focuses on how much data moves through your systems over time.
Common metrics include:
- Inbound traffic, or data entering your servers or services
- Outbound traffic, or data leaving your infrastructure
- Traffic patterns during peak hours
- Usage by protocol or service
This gives you visibility into where capacity is being used and when.
Peak vs. average usage
Average usage tells you what a typical day looks like. Peak usage tells you whether your system can survive a spike.
If your average bandwidth usage is 200 GB per month but traffic jumps 3x during a product launch, the peak is what determines whether users see slowdowns or timeouts.
Capacity planning should be based on peaks, not averages.
Interpreting results correctly
Raw numbers don’t tell the whole story. You need context.
Look for:
- Sudden spikes that may indicate abuse, misconfiguration, or unexpected demand
- Gradual growth trends that suggest scaling needs
- Bandwidth drops to zero, which can signal outages or routing issues
- Response time increases without matching traffic growth, which may point to congestion or saturation
Short speed tests can also be misleading. A quick test might show full capacity during a quiet moment. Real users rarely operate under ideal conditions.
Continuous monitoring shows how bandwidth behaves under load, not just in isolation.
Why monitoring over time matters
Tracking bandwidth over weeks and months helps with:
- Capacity planning
- Forecasting hosting or CDN costs
- Identifying recurring traffic patterns
- Correlating deploys or campaigns with traffic changes
Bandwidth is not static. Usage patterns shift as products evolve, features change, and traffic grows. Monitoring over time gives you a realistic view of demand, not just a snapshot.
Bandwidth limitations, throttling, and data caps
Bandwidth can be constrained in two different ways. Sometimes the limit is physical, and sometimes it’s policy-driven.
Understanding the difference helps you diagnose the real cause of slowdowns.
Bandwidth limitations
Bandwidth limitations are the hard capacity limits of a connection. Once traffic reaches that limit, additional requests compete for the same pipe.
Common triggers include:
- Traffic surges during launches or promotions
- Large file transfers such as media or backups
- High internal service-to-service communication
When demand exceeds available capacity, requests queue. Latency increases. Some connections time out. This is a capacity problem.
Throttling
Throttling is different. It is an intentional slowdown imposed by a provider or platform.
Cloud platforms, APIs, and ISPs often apply throttling based on usage policies, instance size, or rate limits. The connection may still have physical capacity, but traffic is restricted by rules.
Examples include:
- API rate limits such as 1,000 requests per minute
- Cloud egress limits tied to instance tiers
- ISP “fair use” policies after high monthly consumption
In this case, performance drops because of enforcement, not congestion.
Data caps
Data caps limit total usage over a billing period.
Once you exceed the allowance, providers may:
- Charge overage fees
- Slash transfer speeds
- Suspend service
This is common with CDN plans, API gateways, and cloud storage tiers.
Data caps do not affect instantaneous speed directly. They affect long-term cost and availability.
Congestion vs. throttling
Congestion happens when too many users compete for the same capacity, and throttling happens when a provider deliberately restricts traffic.
The symptoms can look similar, but the cause is very different.
If your traffic is within expected levels but performance drops consistently at specific thresholds, you’re likely hitting a policy limit rather than a technical bottleneck.
Bandwidth management and optimization
Managing bandwidth is about controlling where data goes and how much of it moves at once. Poor usage shows up as slow APIs, timeouts, rising costs, or sudden outages during traffic spikes.
Here’s how to approach it practically.
Monitor usage at the source
Before optimizing anything, figure out where the traffic is coming from.
Look at:
- Which endpoints generate the most traffic
- Whether spikes align with launches, campaigns, or deploys
- Whether third-party scripts or integrations are pulling large assets
Bandwidth problems are rarely random. They usually follow traffic patterns.
Reduce payload size
APIs and media responses are common bandwidth drains.
At scale, small inefficiencies compound quickly.
You can reduce usage by:
- Returning only necessary fields in API responses
- Paginating large datasets
- Enabling gzip or Brotli compression
- Using binary formats when appropriate
- Caching responses with proper headers
Even a 30-50% reduction in payload size can significantly decrease monthly data transfer.
Control traffic bursts
Traffic rarely arrives evenly. It spikes.
Use:
- Rate limiting to protect against abuse or accidental overload
- Quality of Service policies in internal networks
- Backoff strategies for retry logic
These don’t increase bandwidth. They prevent it from being overwhelmed.
Offload static assets
Static content should not consume origin bandwidth. Move images, CSS, JavaScript, and downloads to a CDN.
Proper caching alone can reduce origin bandwidth usage by more than half in many applications.
Adapt to user conditions
Not every user needs the same payload.
You can reduce bandwidth usage by:
- Serving lower-resolution media on slow connections
- Deferring non-critical scripts
- Lazy-loading images and video
This improves perceived performance while lowering data transfer. Bandwidth optimization is rarely about one dramatic fix. It’s a series of small, deliberate reductions.
Common bandwidth myths and misunderstandings
Bandwidth gets blamed for everything. Sometimes correctly, but often not.
Here are the most common misconceptions.
More bandwidth always improves performance
Not necessarily.
If latency, packet loss, or server response time is the bottleneck, increasing bandwidth won’t help. A larger pipe doesn’t fix routing delays or overloaded backends.
Bandwidth equals speed
Bandwidth defines capacity and speed is what users feel.
You can have high bandwidth and still experience slow performance if latency or congestion is high.
Speed tests reflect real-world performance
Speed tests measure short bursts under ideal conditions.
They don’t reflect sustained load, multi-user traffic, backend bottlenecks, or peak-hour congestion.
Real performance depends on how your system behaves under actual demand.
Unlimited plans are unlimited
Most “unlimited” plans include fair use policies, soft caps, or throttling triggers.
Read the fine print. Bandwidth is often constrained in practice even when marketing says otherwise.
Future trends affecting bandwidth
Bandwidth demands are increasing, but not evenly. This is a short look at what’s changing.
High-resolution and real-time media
Video continues to grow in bitrate and resolution. Real-time communication is less tolerant of delay than static content.
Even if your app isn’t media-heavy, embedded tools can increase your bandwidth footprint.
Distributed and edge architectures
Traffic is becoming more distributed across regions and edge networks.
This eases latency but makes bandwidth patterns more fragmented. Monitoring needs to reflect that.
Machine-to-machine traffic
IoT and automated systems generate steady background traffic. Individually small, collectively significant.
These systems can create bandwidth pressure without obvious user-facing symptoms.
AI workloads
AI APIs and model calls can be bandwidth-intensive, especially with image or audio data.
Traffic patterns may be bursty and unpredictable.
Bandwidth planning increasingly requires visibility into outbound as well as inbound traffic.
Protocol evolution
New protocols such as HTTP/3 and QUIC change how connections are established and maintained.
They can improve reliability, but they also change how bandwidth usage appears in monitoring systems.
Conclusion
Bandwidth problems usually show up indirectly in the form of slower response times, inconsistent performance, or timeouts during traffic spikes.
Monitoring uptime and response time across regions helps you detect those patterns early. Instead of guessing whether you’re hitting congestion, throttling, or capacity ceilings, you get visibility into how your systems behave under load.
If you want to track performance trends and catch issues before users notice them, you can start monitoring with UptimeRobot for free.
FAQ's
-
Bandwidth is the maximum amount of data that can be transmitted over a connection in a given time. It’s usually measured in Mbps or Gbps. Think of it as the capacity of a connection, not how fast something feels.
-
No. Bandwidth is capacity. Speed is the perceived experience, which depends on bandwidth, latency, congestion, and throughput together.
-
Bandwidth is measured in bits per second. Most consumer and business connections use megabits per second or gigabits per second. Monitoring tools measure actual usage over time to show how much of that capacity is being used.
-
Low effective bandwidth can be caused by congestion, shared connections, throttling, packet loss, hardware limits, or heavy concurrent usage. Sometimes the advertised capacity is simply being saturated.
-
You can reduce bandwidth usage by compressing payloads, caching responses, using CDNs, limiting unnecessary API calls, optimizing media files, and controlling traffic spikes with rate limiting.