TL;DR (QUICK ANSWER)
SaaS monitoring runs scheduled checks on critical endpoints, including login, dashboard, billing, and public APIs. It measures uptime, response time percentiles, and error rates from multiple regions. SaaS monitoring also tracks third-party dependencies like payment and email APIs. Teams define alert thresholds for sustained latency or failure and route incidents through clear escalation paths. As the product grows, monitoring expands to include regional performance tracking and historical reliability data.
SaaS monitoring tracks whether your application is available, fast, and working as expected for real users. It measures uptime, response time, and errors from the outside, not just inside your infrastructure.
SaaS applications run across cloud providers, APIs, CDNs, and third-party services. Even if your server is online, users can still experience slow dashboards, failed logins, or broken checkout flows. Traditional server monitoring does not catch these issues.
A 99.9% uptime SLA (service level agreement) allows up to 43.8 minutes of downtime per month. It says nothing about response time spikes or partial outages. If your typical 200ms response jumps to 900ms during peak traffic, users feel it immediately.
Effective SaaS monitoring focuses on response time, availability, and user impact, before customers report a problem.

Key takeaways
- SaaS monitoring measures uptime, response time, and errors from an external perspective.
- A system can be “up” but still slow or partially broken.
- Uptime percentages do not reflect latency spikes or degraded features.
- Multi-location checks reduce false positives and detect regional issues.
- Monitoring must alert you before performance problems turn into incidents.
What is SaaS monitoring?
SaaS monitoring is the continuous tracking of a SaaS application’s availability, response time, errors, and overall performance. It helps teams detect outages, slowdowns, and integration failures before users are affected.
Unlike traditional on-premise software, SaaS applications run across cloud infrastructure, APIs, CDNs, and third-party services. A failure in any layer can degrade the user experience, even if your main server is online.
There are two sides to SaaS monitoring:
- Monitoring the SaaS you build: ensuring your product is available and fast for customers.
- Monitoring the SaaS you depend on: verifying that tools like payment gateways, email providers, or identity services are working as expected.
Each requires a different monitoring setup. If Stripe fails, your checkout fails. If your email provider slows down, onboarding flows break. Your uptime depends on more than your own code.
There is also an internal vs. external perspective:
- Internal monitoring tracks logs, metrics, and infrastructure health inside your system.
- External monitoring checks your application from outside, the same way users access it.
External checks often detect issues internal dashboards miss. A server can report “healthy” while users in Europe experience five-second response times.
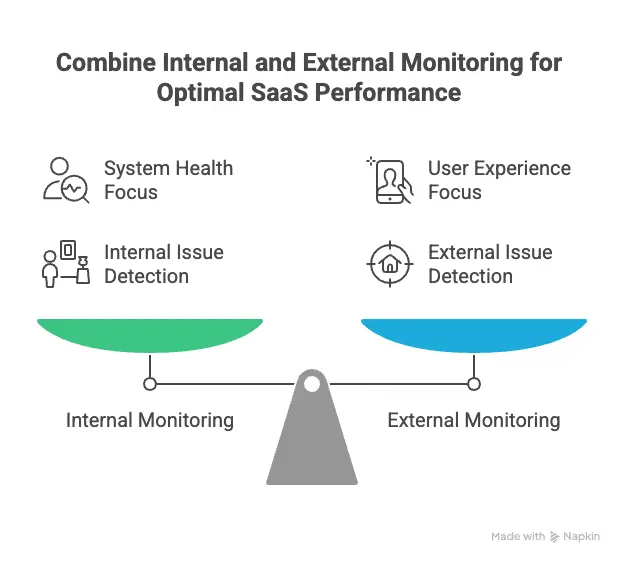
Effective SaaS monitoring combines both views, but always prioritizes what users actually experience.
Why SaaS monitoring matters for modern SaaS businesses
SaaS monitoring protects revenue, user experience, and trust. When your application slows down or goes offline, users leave.
Customer experience and retention
Performance shapes how users perceive your product. A dashboard that loads in six seconds feels broken, even if uptime reports 100%.
Slow APIs, intermittent login failures, or regional latency spikes create friction. Friction increases support tickets, lowers engagement, and drives churn.
Monitoring availability and response time from multiple locations helps detect these issues before customers report them.
Revenue risk from downtime and slow performance
Downtime blocks new sessions and interrupts active ones. The impact is immediate for signup flows, subscription upgrades, and in-app purchases.
Performance degradation can also affect revenue. If a payment API slows down under load, transactions may fail or retry. That creates friction in billing workflows without triggering a full outage alert.
SaaS monitoring measures both hard downtime and sustained latency increases so teams can respond to measurable changes in system behavior.
SLA compliance and customer trust
Many SaaS providers publish uptime targets, such as 99.9%. Those commitments require objective measurement.
External monitoring provides independent records of outages and response time trends. This data supports incident analysis and SLA reporting.
Without monitoring, reliability claims rely on internal dashboards alone. With monitoring, reliability is verifiable.
SaaS monitoring vs. observability vs. APM
SaaS monitoring, application performance monitoring (APM), and observability solve different problems. They overlap, but they are not the same.
SaaS monitoring answers: Is the application reachable and responding within expected limits?
APM answers: Which transaction, service, or dependency is slow or failing?Observability answers: Why did this failure happen in a distributed system?
| Category | SaaS monitoring | APM (Application Performance Monitoring) | Observability |
| Primary goal | Detect outages and performance degradation | Analyze application-level performance | Understand system-wide behavior |
| Core question | Is it working? | Where is it slow or failing? | Why did it fail? |
| Data used | Uptime checks, response times, error rates | Transactions, traces, application metrics | Metrics, events, logs, traces |
| Scope | External service and endpoint health | Application and service layer | Entire distributed system |
| Best for | Detecting downtime and latency spikes | Debugging slow code or failing services | Investigating complex, multi-service issues |
When each is needed
SaaS monitoring is needed first. It detects downtime, high response times, and endpoint failures. Without it, teams often learn about issues from users.
APM is needed when applications grow more complex. If a checkout endpoint is slow, APM shows which database query or microservice is causing the delay.
Observability becomes important in highly distributed systems. When failures span multiple services, regions, or asynchronous processes, observability tools help trace the root cause across logs and traces.
Why most SaaS teams use a mix
Most SaaS teams start with monitoring to detect incidents. As the product scales, they add APM to diagnose performance issues.
Observability tools are typically layered on top in larger environments with microservices, containers, and distributed workflows.
Monitoring provides the alert. APM narrows the issue. Observability explains the broader system behavior.
Core components of SaaS monitoring
SaaS monitoring focuses on three measurable layers: availability, performance, and reliability. Each layer detects a different class of failure.
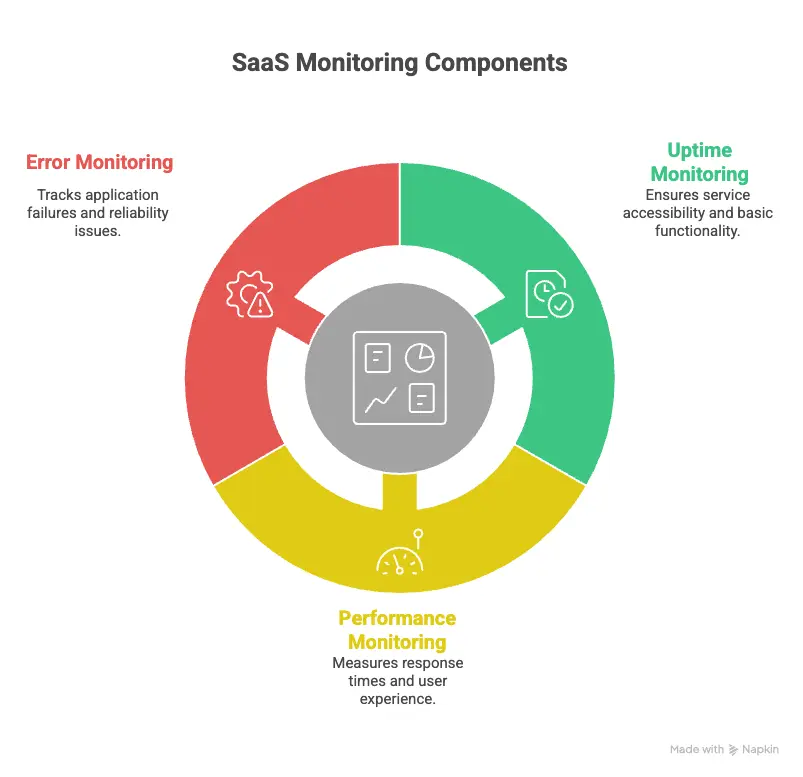
Uptime and availability monitoring
Uptime verifies that an endpoint responds to requests. It confirms that users can connect to your application.
However, availability can be misleading. A login page may return a 200 response while authentication fails behind the scenes. A CDN misconfiguration may affect one region but not others.
Multi-location verification helps reduce false positives and detect region-specific issues, and availability monitoring provides the first signal that something is wrong.
Performance and latency monitoring
Performance monitoring measures how quickly your application responds.
API response time is critical in SaaS systems built on microservices. If authentication increases from 250ms to 1200ms under load, login slows even though uptime remains high.
Response time monitoring surfaces these changes before they escalate into timeouts or failed transactions. Teams can set response time thresholds and receive alerts when latency exceeds expected limits.
Regional performance often varies. A service may respond in 200ms in North America but 900ms in Asia due to routing or CDN configuration. Multi-location checks expose these differences.
Error and reliability monitoring
Error monitoring tracks whether requests complete successfully.
HTTP 500 or 503 responses signal server-side failures. Even a small rise in error rate can indicate instability.
Background jobs require separate monitoring. Billing runs, exports, or data syncs may fail without affecting the interface immediately.
Third-party services also introduce risk. If a payment or email API becomes unavailable, core product functions stop working even if your servers remain online.
Reliability monitoring confirms that the system behaves correctly across normal and peak usage.
SaaS monitoring metrics that actually matter
The SaaS monitoring metrics that matter most are availability, latency, error rate, saturation, real user performance, and measurable business impact. These metrics show whether users can access the product, how fast it responds, whether requests succeed, and whether incidents affect growth.
Technical metrics
Technical metrics show how your system behaves under normal and peak load.
Uptime percentage
Uptime confirms that endpoints respond successfully over time. It measures reachability across regions, but it does not reflect performance or functional correctness. Treat it as a baseline, not a complete reliability signal.
Latency and response times
Response time measures how quickly APIs and pages return usable results. Sustained latency increases often appear before outages. Track percentile latency, such as the 95th or 99th percentile, to understand tail performance under load.
Error rates
Error rate tracks failed requests relative to total traffic. Monitor overall error rate and endpoint-specific failures. A sustained rise in 5xx responses often signals deployment issues, database pressure, or dependency instability.
Saturation and resource usage
Saturation indicates how close systems are to limits such as CPU, memory, thread pools, or connection counts. High saturation increases the risk of latency spikes and cascading failures during traffic bursts.
User experience metrics
User experience metrics measure how the application performs in real-world conditions.
Real user monitoring signals
Real user monitoring collects performance data from actual sessions. It captures device differences, browser behavior, and network variability that synthetic checks cannot fully simulate.
Page load times by geography
Regional load time tracking highlights location-specific degradation. Routing changes, CDN misconfiguration, or regional infrastructure issues can affect one market while others remain stable.
Session failures and friction signals
Failed checkouts, repeated login attempts, or abandoned flows indicate functional friction. These issues may not trigger full outage alerts but still degrade user experience.
Business-aligned metrics
Business-aligned metrics connect technical reliability to product outcomes.
Impact of incidents on active users
Impact of incidents on active users measures how many active sessions were affected during latency spikes or outages. An incident during peak traffic carries more impact than one during low usage.
Correlation with churn or trial drop-off
Correlation with churn or trial drop-off tracks whether performance incidents align with reduced conversions, failed upgrades, or lower activation rates. Patterns over time reveal whether reliability affects growth.
SLA breach frequency
SLA breach frequency tracks how often uptime or response time commitments are missed within a defined period. Frequent minor breaches can be more damaging than isolated major incidents.
How SaaS monitoring metrics map to business impact
| Metric category | Example metric | What it reveals | Business impact |
| Availability | Uptime percentage | Reachability across regions | Blocked sessions and failed signups |
| Performance | 95th percentile response time | Tail latency under load | Checkout delays and lower conversion |
| Reliability | 5xx error rate | Functional instability | Failed transactions and support volume |
| Capacity | CPU or connection saturation | Risk of overload | Increased incident probability during campaigns |
| User experience | Regional page load time | Market-specific degradation | Lower engagement in affected regions |
| Outcome tracking | Incident impact on active users | Real session disruption | Revenue and retention exposure |
Real user monitoring vs. synthetic monitoring
Synthetic monitoring and real user monitoring measure performance differently. Synthetic monitoring tests your application with scripted checks. Real user monitoring captures how actual users experience it.
What is synthetic monitoring best for?
Synthetic monitoring runs automated checks against critical endpoints such as login, checkout, or API routes. These checks run at fixed intervals from specific locations.
It is best for:
- Detecting full outages
- Monitoring response time thresholds
- Validating key user flows before customers notice
- Testing availability from multiple regions
- Verifying third-party endpoints
Synthetic checks are predictable and controlled. They simulate expected behavior under defined conditions.
What real user monitoring captures that synthetic checks cannot
Real user monitoring collects performance data from actual sessions. It reflects real devices, browsers, and network conditions.
It captures:
- Tail latency under real traffic
- Device-specific rendering delays
- Regional performance differences based on ISP routing
- Session-level failures and abandoned flows
Synthetic tests cannot reproduce every combination of browser, network, and user interaction. Real user data reveals variability that scripted checks miss.
Why mature SaaS teams use both synthetic and real user monitoring
Synthetic monitoring detects problems early. It answers whether key paths are reachable and within expected response limits.
Real user monitoring measures the impact of those problems on real sessions.
For example:
- Synthetic monitoring may detect that login latency increased beyond 800ms.
- Real user monitoring shows whether that latency affects 5% or 60% of active users.
Together, they provide detection and impact measurement.
| Category | Synthetic monitoring | Real user monitoring |
| Data source | Scripted checks | Real user sessions |
| Execution timing | Fixed intervals | Continuous, traffic-based |
| Best for | Uptime and response time alerts | Measuring actual user experience |
| Detects full outages | Yes | Only if users are active |
| Detects regional routing issues | Yes, if multi-location | Yes, based on user geography |
| Captures device/browser variability | No | Yes |
| Example use case | Check login endpoint every 5 minutes | Measure dashboard load time for users in Europe |
SaaS monitoring best practices
SaaS monitoring should reflect how your product is actually used, how it is distributed, and how incidents are handled in practice.
1. Start with user journeys, not infrastructure
Define monitoring targets based on real product workflows. For example:
- The authentication endpoint used by every session
- Dashboard data API called on page load
- Billing endpoint used during subscription changes
- Public API routes used by customers
Create availability and response time checks for those specific routes.
Infrastructure metrics such as CPU and memory help diagnose issues. They shouldn’t define what you monitor first.
If a monitored server is healthy but POST /checkout fails, users still cannot complete a purchase.
2. Monitor from multiple regions
Response time and availability vary by geography due to routing, CDN behavior, or cloud provider latency.
Run checks from at least two or three regions and compare response times across locations. If one region consistently deviates, investigate routing or edge configuration.
Single-location checks cannot detect region-specific degradation, so multi-location monitoring is a necessity for SaaS applications.
3. Set actionable alert thresholds
Alert thresholds must reflect sustained deviation, not isolated spikes.
For example:
- Trigger an alert if response time exceeds a defined limit for multiple consecutive checks.
- Trigger an alert if the error rate crosses a percentage threshold within a rolling time window.
Each alert should correspond to a clear investigation path. If the alert doesn’t indicate what to check first, it’s too vague.
4. Reduce alert fatigue with severity levels
Group alerts by impact:
- Endpoint unreachable
- Sustained latency increase
- Elevated error rate
- Capacity threshold warning
Set up your IT alerting software accordingly. Critical availability failures may trigger SMS or voice notifications. Latency increases may route to Slack or an incident tool.
Severity classification prevents non-critical issues from interrupting on-call engineers unnecessarily.
5. Regularly review and prune monitors
Monitoring configurations must match the current architecture.
On a scheduled basis:
- Remove checks for deprecated endpoints
- Update thresholds after traffic pattern changes
- Add monitors for newly released features
Compare active monitors with production route logs to confirm coverage.
Monitoring should evolve with product changes. Static configurations lead to gaps or irrelevant alerts.
How to choose SaaS monitoring tools
Choosing a SaaS monitoring tool requires evaluating coverage, alert quality, operational overhead, and cost structure. The tool should match how your product is built and how incidents are handled.
Ease of setup
Monitoring should not require weeks of configuration.
Evaluate:
- How quickly can you create uptime and API checks
- Whether response time tracking is enabled by default
- How long does it take to configure multi-location monitoring
- Whether alert thresholds can be adjusted without complex rule builders
If adding a monitor requires custom scripting or deep infrastructure access, adoption slows.
Setup time matters, especially for growth-stage teams.
Coverage: uptime, performance, and user experience
A monitoring tool should cover the primary reliability layers:
- Endpoint availability
- Response time tracking
- Error detection
- Multi-location checks
If you also require real user monitoring, confirm whether it is native or requires a separate product.
Coverage gaps create parallel tooling. Parallel tooling creates fragmented visibility.
Alerting and integrations
Alerting determines whether monitoring is useful.
Evaluate:
- Can alerts be triggered on sustained latency deviation, not just downtime?
- Are severity levels configurable?
- Can alerts route to SMS, voice, Slack, or incident management tools?
- Are recurring notifications supported until an incident is resolved?
Alerts must integrate with how your team already operates. Otherwise, incidents are detected but not acted on quickly.
Pricing transparency
Monitoring costs should scale predictably.
Look for:
- Clear pricing based on monitor count or check frequency
- No hidden overage charges for notifications
- Transparent limits on check intervals or locations
Unpredictable pricing discourages adding coverage for new endpoints.
Build vs. buy considerations
Some teams consider building internal monitoring systems. This typically involves:
- Writing scripts for uptime checks
- Storing response time data
- Building alert logic
- Managing escalation workflows
- Maintaining infrastructure for the monitoring system itself
Building can work for highly specialized environments. However, it introduces operational overhead and requires ongoing maintenance.
Buying a monitoring tool reduces engineering effort and provides standardized alerting, multi-location checks, and incident workflows out of the box.
The decision depends on whether monitoring is core product functionality or supporting infrastructure.
Example SaaS monitoring stack
A practical SaaS monitoring stack combines availability checks, performance tracking, error visibility, and clear incident communication. Each layer serves a distinct purpose.
Uptime monitoring
Uptime monitoring checks whether critical endpoints respond. This typically includes:
- Login routes
- Public APIs
- Checkout or billing endpoints
- Health endpoints
These checks run at regular intervals from multiple regions. Their purpose is simple: detect reachability issues quickly.
Uptime monitoring is the detection layer.
Performance monitoring
Performance monitoring tracks response time and latency trends for key endpoints.
This layer highlights:
- Sustained latency increases
- Regional slowdowns
- Response time deviation during peak traffic
Performance monitoring often detects degradation before a full outage occurs.
It answers whether the system is still usable, not just reachable.
Logs and error tracking
Logs and error tracking (incident tracking) help explain what happened after a failure is detected.
This layer includes:
- Application logs
- Structured error reporting
- Background job failure tracking
If uptime monitoring reports failures and performance monitoring shows latency spikes, incident tracking provides the context you need to identify root causes.
This is the diagnosis layer.
Status pages and communication
When incidents occur, communication matters.
A public or customer-facing status page provides:
- Real-time incident updates
- Historical uptime transparency
- Clear acknowledgment of ongoing issues
Internally, incident notifications should route to predefined channels based on severity.
Monitoring detects issues. Logging explains them. Status communication informs users.
How these pieces work together
In practice:
- Uptime monitoring detects that the login endpoint is unreachable.
- Performance monitoring shows latency increasing before the failure.
- Logs reveal a database connection pool limit.
- The team resolves the issue and updates the status page.
Each layer supports a different stage of incident handling. Removing any layer reduces visibility.
A SaaS monitoring stack does not need to be complex. It needs to be consistent, measurable, and aligned with real product workflows.
SaaS monitoring and security considerations
SaaS monitoring supports security by detecting abnormal behavior that affects availability, performance, or access patterns. It does not replace dedicated security tooling, but it provides early operational signals.
Monitoring access patterns and anomalies
Unexpected access patterns can indicate misuse or misconfiguration.
Examples include:
- Sudden spikes in failed login attempts
- High request volume from a single IP range
- API usage outside normal traffic windows
Monitoring request volume and error rates by endpoint helps identify patterns that deviate from baseline behavior.
These signals are operational first, but they may also indicate credential abuse or automated traffic.
Detecting unusual usage spikes
Traffic spikes are not always marketing success.
A rapid increase in requests can:
- Exhaust connection pools
- Trigger rate limits
- Increase response times
- Cause cascading failures
Monitoring saturation, request rate, and response time together helps determine whether a spike is expected growth or an abnormal load.
If usage increases beyond planned capacity, monitoring provides measurable data for scaling decisions.
Supporting compliance and audit readiness
Operational monitoring provides historical records of availability, latency, and incident timing.
Maintaining historical uptime logs, response time trends, and incident duration records supports internal reviews and customer transparency.
The focus is on maintaining accurate operational history, but it does not offer compliance certification.
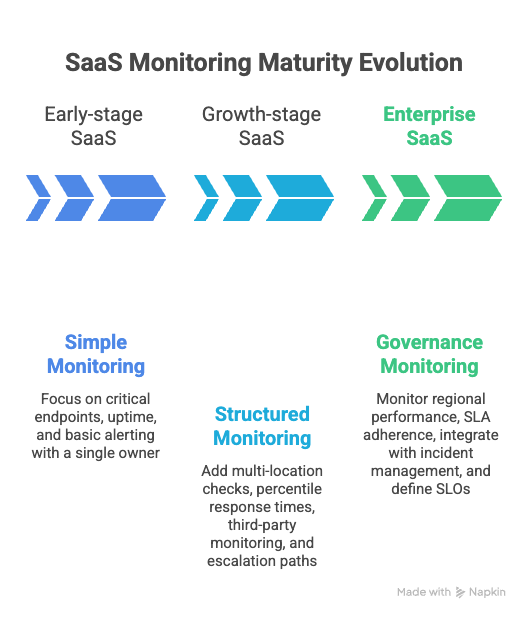
When SaaS monitoring maturity should evolve
SaaS monitoring requirements change as traffic, team size, and system complexity increase. What works for a five-person startup does not hold at enterprise scale.
Early-stage SaaS
Early-stage teams need simple, high-signal monitoring.
At this stage:
- Monitor critical endpoints such as login, signup, and billing
- Track uptime and basic response time
- Configure clear, minimal alerting
- Assign a single owner for incident response
The goal is detection. Over-instrumentation slows development and creates unnecessary overhead.
A small number of well-configured monitors is more effective than broad but unmanaged coverage.
Growth-stage SaaS
As traffic and feature surfaces expand, monitoring must become more structured.
At this stage:
- Add multi-location checks
- Track percentile response times, not just averages
- Monitor key third-party dependencies
- Separate alert severity levels
- Establish documented escalation paths
Incidents become more frequent due to scale, not necessarily instability. Monitoring must distinguish between normal traffic variation and sustained degradation.
Ownership often expands across teams, so visibility and alert routing must be standardized.
Enterprise SaaS
Enterprise SaaS environments introduce higher traffic volume, stricter uptime commitments, and more distributed systems.
At this stage:
- Monitor regional performance independently
- Track SLA adherence continuously
- Integrate monitoring with incident management workflows
- Maintain historical availability and latency data
- Define service-level objectives for critical endpoints
Monitoring for enterprises becomes part of operational governance, not just detection.
The core principles remain the same: availability, performance, and reliability. What changes is coverage depth, automation, and process rigor.
Conclusion
SaaS monitoring is not limited to tracking uptime. It measures whether users can access your product, how fast it responds, and whether critical workflows complete successfully.
Availability without performance is not sufficient. Performance without reliability is unstable. Effective monitoring connects these signals to real user activity and measurable business impact.
Teams do not need a complex stack on day one. Start by monitoring critical endpoints, response time, and error rates. Expand coverage as traffic, architecture, and customer expectations grow.
SaaS monitoring supports consistent reliability. Consistent reliability supports retention, enterprise adoption, and predictable growth.