TL;DR (QUICK ANSWER)
- Start here:
journalctl -u <service> --since "1 hour ago" -p err - For reboot issues:
journalctl -b -1(previous boot) andjournalctl --list-boots - For precision: filter with fields like
_SYSTEMD_UNIT=, _PID=, and priority (-p) - For scripts: use
--no-pagerand-o json
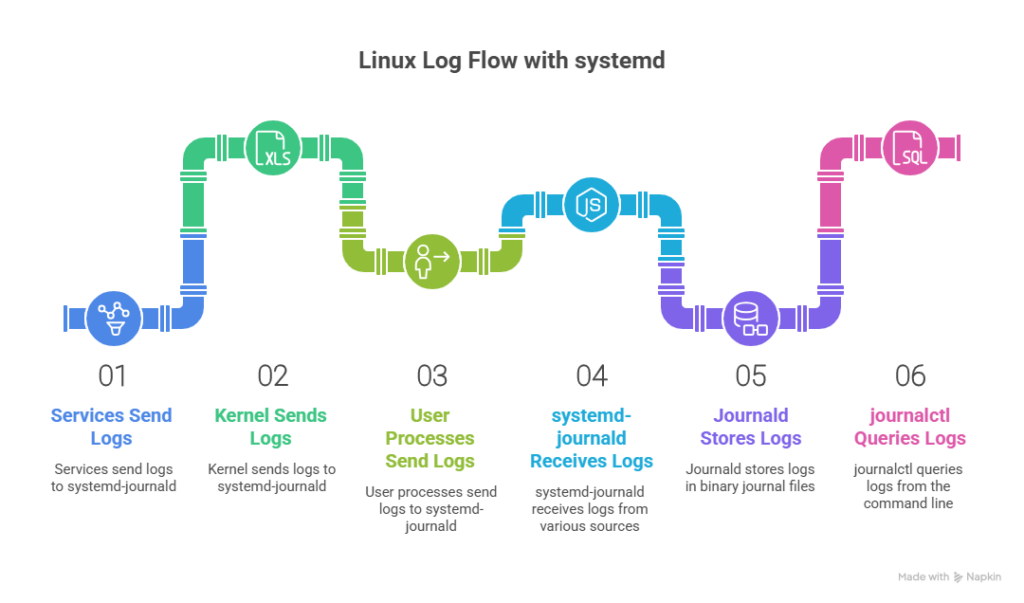
When something breaks on a Linux server, logs are the first place you look. On modern systemd-based systems, that means the systemd journal.
journalctl is the command-line tool for querying logs collected by systemd-journald. It pulls together messages from services, the kernel, and user processes, then lets you filter them by time, boot session, unit, PID, priority, and structured fields.
Instead of jumping between /var/log files and grepping through text, you can run focused queries like:
- What happened during the last boot?
- Why did this service fail 20 minutes ago?
- Are these errors tied to one unit or one process?
If you’re working on a systemd-based distro, journalctl is usually the fastest way to get answers.
We’ll walk through how to view, filter, and analyse logs with journalctl, including practical commands you can use during real incidents.
Key takeaways
- journalctl is the fastest way to query systemd logs by time, boot, unit, priority, and structured fields.
- Boot filtering (
-b, --list-boots) is one of the quickest ways to diagnose reboot-related issues. - Field-based filters like
_SYSTEMD_UNIT, _PID, and_BOOT_IDreduce noise and speed up root cause analysis. - Output formats like JSON make
journalctluseful in automation and log pipelines, not just in a terminal.

How systemd journald works
Before you can use journalctl well, it helps to understand what it’s querying.
systemd-journald is the service that collects and stores log data. Instead of writing plain text files per service, it stores log entries in a structured, binary journal.
Binary journal files vs. plain text logs
Traditional syslog setups write logs as text files under /var/log. Each line is just a formatted string.
Journald stores logs in binary files located in:
/run/log/journal/(volatile, cleared on reboot)/var/log/journal/(persistent, survives reboot)
Binary storage has two major implications:
- Logs are not human-readable without
journalctl. - Queries are much faster because entries are indexed.
You are querying indexed data, not scanning raw text.
Structured metadata and indexed fields
Every journal entry is stored as a set of key-value fields.
A single log event might contain:
MESSAGE=Service started
PRIORITY=6
_SYSTEMD_UNIT=nginx.service
_PID=1234
_BOOT_ID=3e2f1c4d9a234b8ca7d2a1c9d5e4b7e1
_UID=1000
Some fields are supplied by the service. Others are added automatically by journald.
Important internal fields include:
_SYSTEMD_UNIT: the systemd unit that generated the log_PID: the process ID_BOOT_ID: the unique identifier for that boot session_UID: the user ID_COMM: the command name
Because these fields are indexed, filtering by them is fast, even on systems with large log histories.
Instead of:
grep nginx /var/log/syslogYou can run:
journalctl _SYSTEMD_UNIT=nginx.serviceThat difference matters during incident response. Indexed filtering cuts down search time and reduces noise.
Volatile vs. persistent storage
By default, journald may store logs in memory only.
If /var/log/journal/ does not exist, logs are written to /run/log/journal/ and disappear after reboot.
To enable persistent logs:
sudo mkdir -p /var/log/journal
sudo systemd-tmpfiles --create --prefix /var/log/journal
sudo systemctl restart systemd-journald
On production systems, persistent storage is usually required for:
- Post-reboot troubleshooting
- Audit trails
- Incident reviews
Why queries stay fast on large systems
Journald maintains indexes for common fields such as unit, PID, and boot ID.
That means queries like:
journalctl -u nginx.service --since "1 hour ago"Don’t scan every log entry. They use indexed lookups.
This is one of the main reasons journalctl feels faster than grepping across multiple rotated log files.
Understanding this structure changes how you debug systems. You aren’t searching text files, you are querying structured events.
journalctl vs. syslog and traditional log files
Both journald and traditional syslog systems record system and application events. The difference is in how they store, structure, and query logs.
On systemd-based systems, journald is the default. But many environments still use syslog daemons like rsyslog or syslog-ng, often alongside journald.
Here’s how they compare.
How traditional syslog works
Syslog-based systems write logs as plain text files under /var/log.
Examples:
/var/log/syslogor/var/log/messages/var/log/auth.log/var/log/kern.log
Each entry is just a formatted string. Searching means scanning files with tools like:
grepawkless
Rotation is handled separately via logrotate, which archives and compresses old logs.
There’s no built-in structure beyond whatever format the service writes.
| Pros | Cons |
| Plain text and easy to grep | No structured metadata |
| Broad compatibility | Slower searches on large systems |
| Mature ecosystem of shipping tools | Logs fragmented across files |
| Decoupled from system internals | Requires external rotation management |
How journalctl differs
With journald, logs are stored as structured binary entries.
Each log entry includes indexed metadata such as:
_SYSTEMD_UNIT_PID_BOOT_ID_UIDPRIORITY
Instead of searching across multiple files, you query fields directly:
journalctl -u nginx.service
journalctl -p err --since "1 hour ago"
Because journald indexes common fields, filtering is significantly faster on large systems.
| Pros | Cons |
| Fast indexed queries | Binary format requires journalctl |
| Structured filtering by unit, PID, boot ID | Not available on non-systemd systems |
| Unified view of kernel and services | Some legacy tooling expects text logs |
| Built-in retention and disk controls | Misconfiguration can lead to disk growth |
Direct comparison
| Category | journalctl (journald) | Syslog / traditional logs |
| Storage format | Binary journal files | Plain text files |
| Metadata | Structured and indexed fields | Mostly unstructured message text |
| Query speed | Fast field-based lookups | File scanning with grep |
| Cross-service filtering | Single query across units and kernel | Manual across multiple log files |
| Log rotation | Built-in retention controls | Managed separately with logrotate |
| Human readability | Requires journalctl | Directly readable |
| Portability | Requires systemd | Works across init systems |
When teams use both
In many production environments:
- journald collects logs locally.
- A syslog daemon reads from the journal.
- Logs are forwarded to a centralized stack (ELK, Loki, Splunk, Graylog).
That setup keeps fast local debugging with journalctl while supporting long-term aggregation and analysis.
Basic journalctl commands you should know
Before you get into advanced filtering, you should be comfortable with a few core commands. These cover 80% of day-to-day troubleshooting.
Viewing all logs
To display the entire journal:
journalctlThis shows logs in chronological order, oldest first.
On busy systems, that’s usually too much output. But it’s useful when you need a complete timeline.
If you want newest entries first:
journalctl -rPaging and navigation
By default, journalctl pipes output into a pager (usually less).
Inside the pager, you can:
- Use Space to scroll down
- Use b to scroll up
- Use / to search
- Press q to quit
If you’re scripting or don’t want paging:
journalctl --no-pagerLimiting output
To show only the last 100 lines:
journalctl -n 100To show the last 50 lines for a service:
journalctl -u nginx.service -n 50This is one of the fastest ways to check recent failures.
Following logs in real time
To stream logs as they arrive (similar to tail -f):
journalctl -fTo follow a specific service:
journalctl -u nginx.service -fThis is useful when restarting services or reproducing an issue live.
Filtering logs effectively
Dumping the entire journal rarely helps during an incident. Filtering is where journalctl becomes powerful.
You can filter by time, unit, boot session, priority, and structured fields.
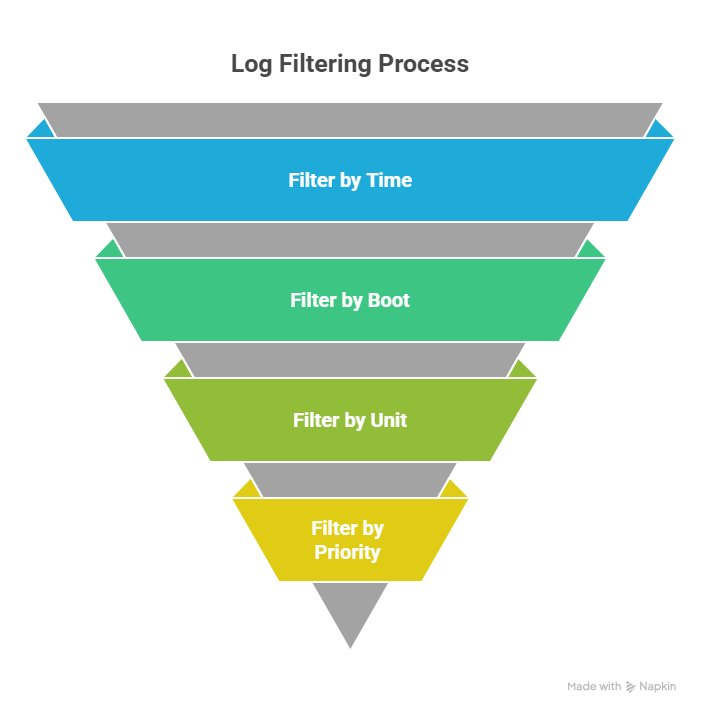
Filter by time
If you know roughly when something broke, start with time filters.
Use --since and --until:
journalctl --since "2026-02-13 10:00" --until "2026-02-13 11:00"You can also use relative time:
journalctl --since "1 hour ago"
journalctl --since "30 minutes ago"
journalctl --since today
Relative time is especially useful during live incident response.
Filter by service and unit
To view logs for a specific systemd unit:
journalctl -u nginx.serviceCombine with time filtering:
journalctl -u nginx.service --since "1 hour ago"You can filter multiple units in one command:
journalctl -u nginx.service -u php-fpm.serviceThis helps when debugging interactions between services.
Filter by boot session
Every boot has a unique ID.
To show logs from the current boot:
journalctl -bTo view logs from the previous boot:
journalctl -b -1To list all boot sessions:
journalctl --list-bootsThis is essential when diagnosing reboot-related issues or crashes that happened before the system came back up.
Filter by priority and severity
Journald uses standard syslog priority/severity levels:
- 0: emerg
- 1: alert
- 2: crit
- 3: err
- 4: warning
- 5: notice
- 6: info
- 7: debug
To show only errors and higher:
journalctl -p errTo show a range (for example, warnings through emergencies):
journalctl -p warning..emergTo filter a specific service by priority:
journalctl -u nginx.service -p err --since "1 hour ago"This is often the fastest way to isolate meaningful failures.
Advanced filtering using journal fields
Time and unit filtering are powerful. But when you’re dealing with high-volume systems, you often need more precision.
That’s where journal fields come in.
Each journal entry contains structured metadata. You can match directly against those fields instead of scanning message text.
Matching structured fields directly
You’ve already seen -u for units. Under the hood, that’s filtering on the _SYSTEMD_UNIT field.
You can filter fields explicitly:
journalctl _SYSTEMD_UNIT=nginx.serviceOther useful fields include:
- _PID – process ID
- _COMM – command name
- _EXE – full executable path
- _UID – user ID
- _BOOT_ID – specific boot session
- PRIORITY – log severity
For example, to filter by PID:
journalctl _PID=1234To filter by command name:
journalctl _COMM=nginxThis is especially useful for short-lived processes that may restart frequently.
Combining filters
You can combine multiple field matches in a single command. They act as logical AND conditions.
Example: errors from nginx in the last hour:
journalctl _SYSTEMD_UNIT=nginx.service -p err --since "1 hour ago"Example: logs from a specific PID during the current boot:
journalctl _PID=1234 -bYou can combine unit, priority, and time:
journalctl _SYSTEMD_UNIT=sshd.service PRIORITY=3 --since "30 minutes ago"The more precise the filter, the less noise you need to sift through.
Why this matters for troubleshooting speed
On a busy production system, grepping through large log files can take time and return too much irrelevant output.
Field-based filtering gives you:
- Faster root cause analysis
- Less manual parsing
- Cleaner automation pipelines
- More confidence that you’re looking at the right events
For example, instead of:
journalctl | grep "connection refused"You can narrow it first:
journalctl _SYSTEMD_UNIT=nginx.service -p err --since "10 minutes ago"Then inspect the results. That difference becomes important during an outage, when every minute counts.
Output formats and exporting logs
journalctl isn’t just for reading logs in a terminal. You can change output formats, export logs to files, and pipe them into other tools.
Short, verbose, and JSON output
By default, journalctl uses a short, readable format.
For more detail per entry:
journalctl -o verboseThis shows all available fields, including internal metadata like _SYSTEMD_UNIT, _PID, _BOOT_ID, and more. It’s useful when you’re trying to understand exactly how an entry is structured.
For machine-readable output:
journalctl -o jsonEach log entry is printed as a JSON object on a single line.
For easier human inspection:
journalctl -o json-prettyJSON output is ideal for scripts, automation, and log processing pipelines.
When to use JSON
Use JSON when you need:
- Structured parsing
- Field extraction
- Integration with tools like jq
- Automated log checks
Example: extract only the message field:
journalctl -u nginx.service -o json --no-pager | jq -r '.MESSAGE'Example: count errors from the last hour:
journalctl -p err --since "1 hour ago" -o json --no-pager | jq -r '.MESSAGE' | wc -lExporting logs to a file
You can redirect output to a file for sharing or incident documentation:
journalctl -u nginx.service --since "1 hour ago" --no-pager > nginx.logFor structured export:
journalctl --since "today" -o json --no-pager > logs.jsonThis is useful for:
- Attaching logs to support tickets
- Feeding logs into analysis tools
- Creating post-incident artifacts
Piping into other tools
Because journalctl works well in pipelines, you can combine it with other CLI tools:
journalctl -u sshd.service --since "1 day ago" --no-pager | grep "Failed password"Or with structured filtering:
journalctl -p warning --since "2 hours ago" -o json --no-pager | jq '._SYSTEMD_UNIT'This makes journalctl suitable not just for manual troubleshooting, but for automation and reporting.
Real world troubleshooting scenarios
journalctl becomes powerful when you use it with intent. Below are common incident scenarios and the exact patterns that help you move quickly.
Diagnosing a failed service after reboot
Symptom: a service is down after a reboot.
Step 1: confirm the failure.
systemctl --failedStep 2: inspect logs from the current boot for that unit.
journalctl -u my-app.service -bStep 3: narrow to errors only.
journalctl -u my-app.service -b -p errIf the issue started during the previous boot:
journalctl -b -1
journalctl -u my-app.service -b -1
This quickly tells you whether the failure is tied to boot-time dependencies, missing environment variables, or permission errors.
Finding kernel or hardware errors
Symptom: random crashes, network drops, or system instability.
Start with kernel logs:
journalctl -kLimit to the current boot:
journalctl -k -bFocus on high-severity entries:
journalctl -k -p warning..emergLook for:
- I/O errors
- Network interface resets
- OOM killer messages
- Filesystem corruption warnings
This isolates hardware and kernel-level issues without scanning application logs.
Tracking intermittent service crashes
Symptom: a service restarts sporadically.
Step 1: check restart events.
journalctl -u nginx.serviceStep 2: filter for the last few hours.
journalctl -u nginx.service --since "3 hours ago"Step 3: narrow to errors and critical events.
journalctl -u nginx.service -p err --since "3 hours ago"If the service restarts rapidly, filtering by boot or PID helps:
journalctl _SYSTEMD_UNIT=nginx.service
journalctl _PID=1234
This helps distinguish configuration issues from runtime crashes.
Debugging slow boot times
Symptom: system boots slowly after updates.
Start with boot logs:
journalctl -bThen check systemd timing:
systemd-analyze blameUse journalctl to inspect slow units:
journalctl -u network.service -b
journalctl -u docker.service -b
Focus on units that:
- Wait on dependencies
- Timeout during startup
- Retry connections repeatedly
Filtering by time can also help if you know when the delay occurs:
journalctl -b --since "10 minutes ago"Investigating unexpected reboots
Symptom: the server rebooted without warning.
Check the previous boot:
journalctl -b -1Look at the last entries before shutdown:
journalctl -b -1 -n 100Search for:
- Out of memory
- Kernel panic
- Power or ACPI errors
- Watchdog triggers
This often reveals whether the reboot was triggered by the kernel, hardware, or a controlled restart.
Using journalctl in scripts and automation
journalctl isn’t just for manual debugging. It works well in scripts, cron jobs, and monitoring checks, especially when you control the output format.
The key is to keep output predictable and scoped.
Non-interactive usage
When using journalctl in scripts, always disable paging:
journalctl --no-pagerYou’ll usually also want to narrow the time window:
journalctl --since "5 minutes ago" --no-pagerThis prevents scanning the entire journal and keeps execution fast.
Exit codes and predictable output
journalctl exits with status 0 even if no logs match.
So instead of checking exit codes, check whether output is empty.
Example:
if ! journalctl -u nginx.service --since "5 minutes ago" --no-pager | grep -q .; then
  echo "No recent logs for nginx"
fi
If you’re alerting on errors:
if journalctl -u nginx.service -p err --since "5 minutes ago" --no-pager | grep -q .; then
  echo "Errors detected"
fi
This pattern works well in health checks.
Using journalctl in cron jobs
Example: email errors every 10 minutes.
*/10 * * * * journalctl -p err --since "10 minutes ago" --no-pager | mail -s "System Errors" ops@example.comAlways use relative time filters in scheduled jobs to avoid overlapping windows.
Structured output for automation
For machine parsing, use JSON:
journalctl -u myapp.service --since "15 minutes ago" -o json --no-pagerThen extract fields with jq:
journalctl -u myapp.service --since "15 minutes ago" -o json --no-pager \
  | jq -r '.MESSAGE'
This makes it possible to:
- Count error types
- Detect specific failure patterns
- Trigger webhooks or alerts
Log-based health checks
You can build simple health checks based on recent log activity.
Example: alert if no successful start message appears:
if ! journalctl -u myapp.service --since "5 minutes ago" --no-pager | grep -q "Started successfully"; then
  echo "Service may not be healthy"
fi
This is basic, but effective for lightweight monitoring setups.
journalctl works well locally. But once you need correlation across multiple systems, you’ll usually forward logs into a centralized stack.
Integrating journalctl with monitoring and observability tools
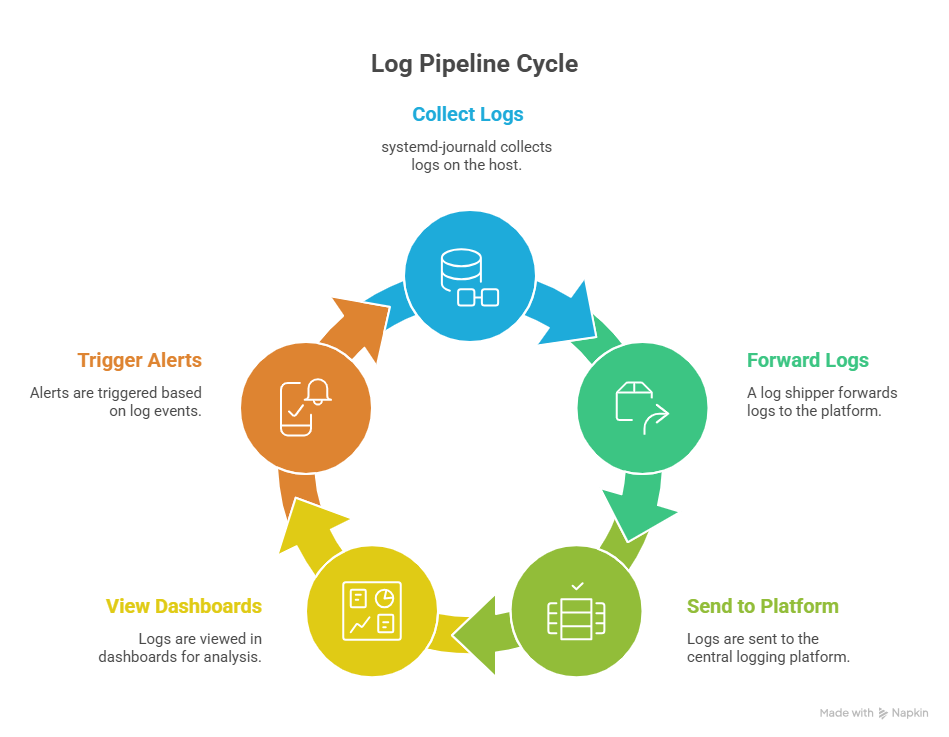
journalctl is great for local debugging, but it’s not a long-term log platform. For production systems, you’ll usually forward journald logs into a centralized pipeline so you can search across hosts, retain logs longer, and alert on patterns.
Forwarding logs to external systems
Most stacks use one of these patterns:
- journald → syslog daemon (rsyslog/syslog-ng) → log shipper → log backend
- journald → log shipper that reads the journal directly → log backend
If you’re using a syslog daemon, journald can forward into it.
In journald.conf:
ForwardToSyslog=yesFrom there, your syslog daemon can write to files or forward to a remote destination.
If you’re using a log shipper that reads journald directly, you typically filter on fields like _SYSTEMD_UNIT and follow from the tail so you only ingest new entries.
Using journald as a source of truth
Even if you forward logs elsewhere, journald is often your fastest “source of truth” during an incident because:
- It’s local to the host.
- It includes unit and boot context.
- It supports high-precision filtering without extra parsing.
A common workflow looks like:
- Use dashboards to spot the time window and affected hosts.
- Use journalctl on the host to confirm what actually happened.
Common integration patterns (conceptual)
Teams usually ship logs into systems like:
- ELK-style pipelines (Elasticsearch + Logstash/Beats + Kibana)
- Loki-style pipelines (Promtail/agent + Loki + Grafana)
- Graylog-style pipelines (inputs + processing + search)
- Splunk-style pipelines (forwarders + indexing + search)
The exact tooling varies, but the idea is consistent:
- Read from journald
- Preserve structured fields where possible
- Add host and environment tags
- Route logs to a central backend for search and alerts
Managing disk usage and performance
Journald is easy to ignore until it eats disk space or you lose logs you needed after a reboot. A few checks and settings keep it predictable on production systems.
Check journal size
Start with a quick disk usage check:
journalctl --disk-usageIf it’s larger than you expect, you can also check where logs are stored:
/run/log/journal/: volatile (cleared on reboot)/var/log/journal/: persistent (survives reboot)
Limit disk usage and retention
Journald retention is controlled in:
/etc/systemd/journald.confCommon settings include:
SystemMaxUse: cap total disk usage for persistent logsSystemKeepFree: keep a minimum amount of free disk spaceSystemMaxFileSize: cap individual journal file sizesSystemMaxFiles: cap number of archived journal files
Example:
[Journal]
SystemMaxUse=500M
SystemKeepFree=1G
SystemMaxFileSize=50M
SystemMaxFiles=10
After changes:
sudo systemctl restart systemd-journaldOn busy hosts, caps like these prevent journald from quietly filling a filesystem.
Vacuum old logs
If you need to reclaim space quickly, journalctl can delete older entries.
Remove entries older than 7 days:
sudo journalctl --vacuum-time=7dLimit total journal size:
sudo journalctl --vacuum-size=200MLimit the number of archived files:
sudo journalctl --vacuum-files=5Performance considerations on busy systems
A few practical notes:
- Wide-open queries are slow: always scope by time, unit, boot, or priority on large hosts.
- Persistent logging is usually worth it: volatile-only logs disappear on reboot, which is when you often need logs most.
- Disk pressure matters: if a partition runs low on free space, logging can become a reliability problem, not just a convenience feature.
If you treat journald like any other production component (limits, retention, and monitoring), it stays useful instead of becoming a liability.
Security and permissions in journalctl
System logs often contain sensitive data: authentication attempts, service errors, environment details, even stack traces. Access to the journal should be controlled deliberately.
Why root access is usually required
By default:
rootcan read the entire system journal.- Regular users can only read their own user session logs.
If a non-privileged user runs:
journalctlThey’ll typically see limited output unless permissions have been adjusted.
This default protects:
- Authentication logs
- System service errors
- Kernel messages
Granting read-only access safely
Instead of giving someone full root access, add them to the systemd-journal group:
sudo usermod -aG systemd-journal usernameAfter logging out and back in, that user can read the full journal without needing sudo.
This is common for:
- SREs
- Platform engineers
- Incident responders
It provides visibility without shell-level root access.
Group-based permissions and journal files
Persistent journals live under:
/var/log/journal/Files are owned by:
- root
- group: systemd-journal
Permissions typically look like:
-rw-r----- root systemd-journalThis ensures:
- Only root and the journal group can read entries.
- Unauthorized users can’t inspect or tamper with logs.
If you enable persistent storage manually, make sure ownership and permissions are correct:
sudo mkdir -p /var/log/journal
sudo chown root:systemd-journal /var/log/journal
sudo chmod 2755 /var/log/journal
The setgid bit (2) keeps group ownership consistent for new files.
Auditing considerations
Because journald stores authentication and system-level events, it often plays a role in audit and compliance workflows.
Common practices include:
- Forwarding logs to a centralized logging system.
- Restricting journal access to specific roles.
- Retaining logs according to policy (for example, 30–90 days).
If logs are part of an audit trail, volatile-only storage (/run/log/journal) is usually insufficient.
Persistent storage plus centralized export is the safer default for production.
journalctl best practices for production systems
In production, logs aren’t just for debugging. They’re part of your reliability and incident response workflow. A few habits make journalctl far more effective under pressure.
Define a retention strategy
Unbounded logs are a liability.
Set size or time limits in journald.conf:
- SystemMaxUse
- SystemKeepFree
- MaxRetentionSec
Pick values that match your environment:
- Small VM: tighter caps.
- Critical host: larger retention plus central forwarding.
Don’t rely on defaults. Make retention explicit.
Enable persistent logging
If /var/log/journal doesn’t exist, logs may disappear after reboot.
On production systems, persistent logs are usually expected.
Enable them:
sudo mkdir -p /var/log/journal
sudo systemctl restart systemd-journald
Reboot-related incidents are hard enough without losing the evidence.
Always scope your queries
Avoid running:
journalctl
On large systems, that’s slow and noisy.
Instead, scope by:
- Unit (-u)
- Boot (-b)
- Time (–since)
- Priority (-p)
Example:
journalctl -u api.service -b -p err --since "30 minutes ago"Scoped queries are faster and easier to reason about during incidents.
Monitor journal health
Check disk usage periodically:
journalctl --disk-usageWatch for:
- Rapid growth
- Logs filling a shared partition
- Services spamming debug-level output
Excessive logging can turn into a performance problem.
Archive or export when necessary
Journald works well locally, but it isn’t a long-term analytics platform.
In production:
- Forward logs to a centralized system.
- Keep local retention reasonable.
- Avoid treating journald as permanent storage.
This keeps hosts lightweight while maintaining audit visibility elsewhere.
SRE-oriented checklist
Use this as a quick sanity check:
- Persistent logging enabled
- Retention limits configured
- Logs forwarded to central stack
- Query patterns standardized for incidents
- Journal disk usage monitored
If those are in place, journalctl becomes a fast, reliable diagnostic tool instead of a reactive scramble.
Common journalctl mistakes to avoid
Even experienced engineers misuse journalctl under pressure. Most issues come down to filtering too loosely or assuming defaults behave a certain way.
Here are the mistakes that waste the most time.
Relying only on grep
It’s tempting to run:
journalctl | grep "error"That works, but it ignores structured fields and can miss context.
Better:
journalctl -p err
journalctl -u nginx.service -p err
Use built-in filters first. Use grep only when you need message-level pattern matching.
Ignoring boot filtering
Logs span multiple boots. If you forget -b, you may mix events from different sessions.
Instead of:
journalctl -u my-app.serviceTry:
journalctl -u my-app.service -bOr check the previous boot explicitly:
journalctl -b -1Boot filtering is one of the fastest ways to isolate restart-related issues.
Running unscoped queries on large systems
Running…
journalctl…on a busy host can dump massive output and slow you down.
Always scope by:
- Time (–since)
- Unit (-u)
- Priority (-p)
- Boot (-b)
Small filters make big systems manageable.
Letting disk usage grow unchecked
If retention isn’t configured, journals can grow until the disk fills.
Check usage:
journalctl --disk-usageSet limits in journald.conf and monitor them like any other system component.
No log export strategy
Journald is excellent locally, but it isn’t a full observability stack.
If logs only live on the host:
- You lose cross-host visibility.
- You risk losing logs if a disk fails.
- Incident analysis becomes harder.
Forward logs to a centralized system and keep journald focused on fast local diagnostics.
Avoid these pitfalls and journalctl becomes predictable instead of frustrating.
journalctl command cheatsheet
Use this as a quick reference during troubleshooting.
| Goal | Command |
| View all logs | journalctl |
| Newest first | journalctl -r |
| Last 100 lines | journalctl -n 100 |
| Follow logs in real time | journalctl -f |
| Logs for a service | journalctl -u nginx.service |
| Service logs (current boot) | journalctl -u nginx.service -b |
| Current boot only | journalctl -b |
| Previous boot | journalctl -b -1 |
| List all boots | journalctl –list-boots |
| Since specific time | journalctl –since “2026-02-13 10:00” |
| Relative time filter | journalctl –since “1 hour ago” |
| Filter by priority | journalctl -p err |
| Priority range | journalctl -p warning..emerg |
| Kernel logs only | journalctl -k |
| Filter by PID | journalctl _PID=1234 |
| JSON output | journalctl -o json |
| Pretty JSON | journalctl -o json-pretty |
| Disable pager (scripts) | journalctl –no-pager |
| Check disk usage | journalctl –disk-usage |
| Vacuum logs by time | sudo journalctl –vacuum-time=7d |
| Vacuum logs by size | sudo journalctl –vacuum-size=200M |
If you remember nothing else:
- Scope by service:
-u - Scope by boot:
-b - Scope by time:
--since - Scope by severity:
-p
Those four filters solve most incidents quickly.
Conclusion: when journalctl becomes a superpower
At first glance, journalctl looks like just another way to read logs. In practice, it’s much more than that.
Once you start combining filters like unit, boot, time, priority, and structured fields, it becomes a fast query engine for system events. Instead of grepping through multiple files, you’re narrowing down indexed data in seconds.
That shift matters during real incidents.
When you:
- Filter by boot to isolate restart-related failures
- Narrow by unit to focus on one service
- Use priority levels to cut through noise
- Query structured fields like
_SYSTEMD_UNIT,_PID, and_BOOT_ID
You move from reactive searching to targeted debugging.
In modern Linux environments built on systemd, journalctl is often the quickest path to answers. Paired with sensible retention settings and centralized log forwarding, it fits cleanly into a production-ready logging strategy.
Master the filters, keep your queries scoped, and treat logs as structured data. That’s when journalctl stops feeling like a command and starts feeling like leverage.
FAQ's
-
journalctlis a command-line tool used to view and query logs collected by systemd-journald on Linux systems. It provides access to system, kernel, and service logs in one place and allows filtering by time, boot session, service, process ID, or severity level for faster troubleshooting. -
journalctlreads structured logs stored by systemd in a binary journal, while syslog systems store logs as plain text files under/var/log. Journald provides indexed fields, faster queries, and unified logs across services and kernel events, while syslog offers simpler text-based storage and broader compatibility. -
ournal logs are stored in:
/run/log/journal/→ temporary logs cleared after reboot/var/log/journal/→ persistent logs that survive reboots
If persistent storage is not enabled, logs may disappear after a system restart.
-
Use the
-uoption followed by the service name:journalctl -u nginx.serviceYou can combine it with filters like time or severity:
journalctl -u nginx.service --since "1 hour ago" -p errThis helps isolate service failures quickly.
-
System logs often contain sensitive information such as authentication attempts, system errors, and kernel messages. By default, only root or users in the
systemd-journalgroup can access the full journal to protect system security and audit data.