TL;DR (QUICK ANSWER)
Network bandwidth is measured in bits per second using active tests (like iPerf) or passive monitoring (like SNMP). Bandwidth shows theoretical capacity, while throughput and goodput reflect real performance.
Response time monitoring captures a clean slowdown timeline before you validate bandwidth with iPerf or SNMP, which turns “it feels slow” into measurable response-time drift.
Network bandwidth issues often show up as “everything looks fine, but the app feels slow.” Servers may be healthy and logs clean, yet users still experience lag. Measuring network bandwidth helps determine whether performance problems originate in the network layer or elsewhere in the stack.
In this guide, you’ll learn how to measure network bandwidth, which metrics matter, and how to interpret results in real-world conditions.
Key takeaways
- Bandwidth measures capacity, not actual data transfer.
- Bandwidth is measured in bits per second (bps).
- Active testing shows maximum potential bandwidth.
- Passive monitoring shows real-world usage.
- Throughput and goodput explain why real performance is lower than advertised.

What is network bandwidth?
Network bandwidth is the maximum amount of data a network connection can transfer per second. It is a capacity limit, not a performance guarantee.
Bandwidth is measured in bits per second (bps), commonly shown as megabits per second (Mbps) or gigabits per second (Gbps).
Bandwidth is often confused with speed. Speed describes how fast data travels. Bandwidth describes how much data can travel at once. A high-bandwidth connection can support more users, larger payloads, or concurrent requests without congestion.
Think of bandwidth like a highway: the more lanes it has, the more cars (data) can travel side by side. A wider highway doesn’t make each car go faster, but it allows more cars to reach their destination at the same time.
How bandwidth affects performance
Bandwidth limits how many users, requests, or data streams a system can support at the same time. It directly impacts how well applications perform, especially those that rely on real-time data or large file transfers. .
For example:
- Video conferencing tools like Zoom or Google Meet require consistent bandwidth to maintain audio and video quality. Low bandwidth can cause lag, dropped calls, or pixelated video.
- Cloud-based apps such as Figma or Google Workspace need enough bandwidth to sync changes in real time. If the bandwidth is too low, users may experience delays or data loss.
- APIs and web services depend on bandwidth to handle concurrent requests. Limited bandwidth can slow response times or cause timeouts during traffic spikes.
Bandwidth problems often look like “random slowness” because they appear during peak usage, deployments, backups, or batch jobs.
How is network bandwidth measured in practice?
In real systems, bandwidth is measured to explain slowdowns, validate capacity, and confirm whether the network is the limiting factor.
There are two practical ways teams measure bandwidth: by generating test traffic (active) or by observing live traffic (passive). Each approach answers a different question.
Measuring bandwidth using active testing
Active testing measures bandwidth by sending controlled traffic across a connection and observing how much data can move within a given time window.
This method is commonly used when validating a new connection, comparing providers, or checking performance after a configuration change.
It’s controlled, repeatable, and useful for benchmarking.
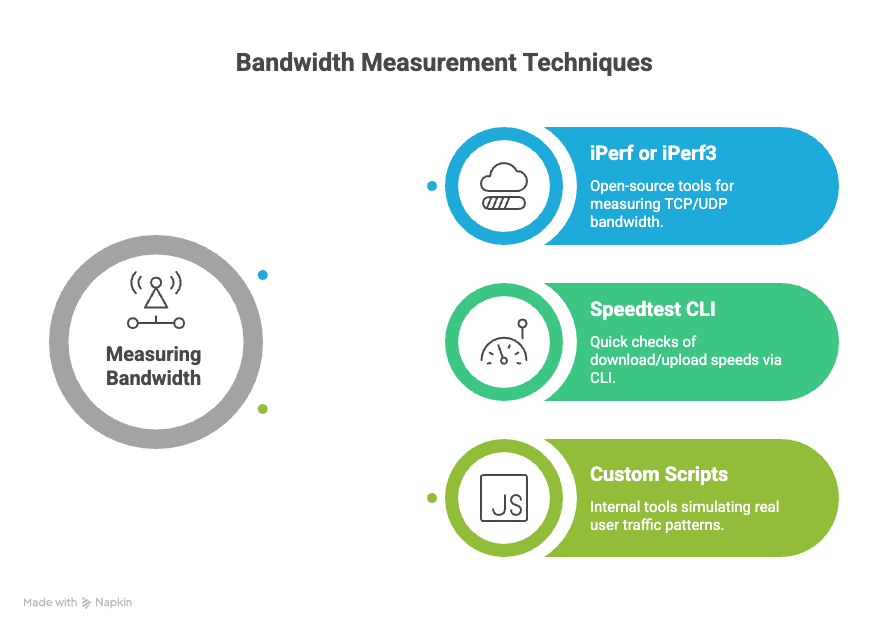
Common active testing tools and methods include:
- iPerf or iPerf3: These open-source tools are widely used for measuring maximum TCP or UDP bandwidth. You run a server on one end and a client on another, then measure throughput between them. For example, running iperf3 -c server_ip from a client gives you stats like bandwidth, jitter, and packet loss.
- Speedtest CLI: Popular for quick checks, this tool connects to the nearest test server and reports download/upload speeds. It’s useful for validating ISP claims or checking user-facing performance.
- Custom scripts: Teams often build internal tools that simulate real user traffic patterns to test bandwidth under expected loads. This can be helpful when evaluating performance across multiple regions or data centers.
| Pros of active testing | Cons of active testing |
| Controlled environment | Consumes bandwidth during testing |
| Repeatable results | Doesn’t reflect real user traffic unless carefully modeled |
| Useful for capacity planning and benchmarking | Can’t run continuously without affecting production traffic |
Use active testing when you need to validate a new connection, test after a configuration change, or benchmark performance across different providers or regions.
Measuring bandwidth using passive monitoring
Passive monitoring measures bandwidth by observing traffic that already flows through the network. No test data is injected.
It relies on counters and flow data collected from network devices, cloud interfaces, or load balancers.
Passive monitoring provides a continuous view of how bandwidth is used over time, which is ideal for long-term trend analysis and real-time diagnostics.
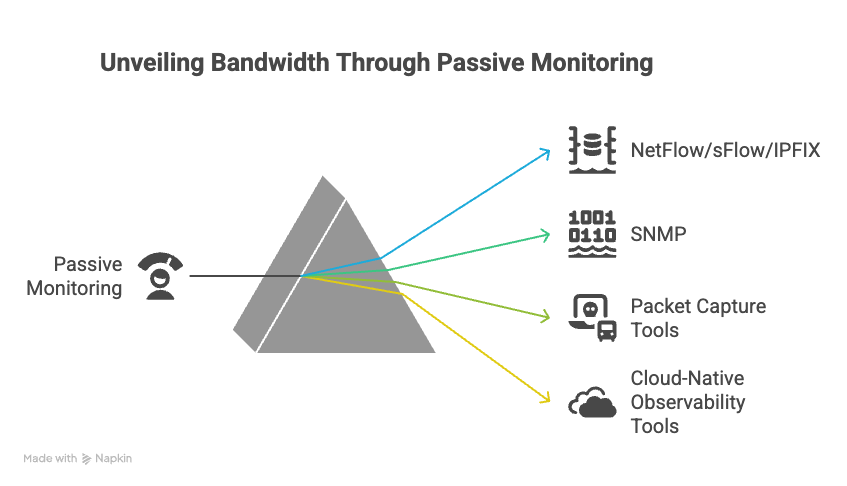
Common passive monitoring tools and techniques:
- NetFlow/sFlow/IPFIX: These protocols collect metadata about network flows. For example, NetFlow on a router can tell you which IPs are using the most bandwidth, what protocols they’re using, and when spikes occur.
- SNMP (Simple Network Management Protocol): SNMP can poll network interfaces for byte counters. By comparing values over time, you can calculate bandwidth usage. Tools like Cacti or MRTG visualize this data.
- Packet capture tools (e.g., Wireshark): While not ideal for measuring total bandwidth, packet captures help analyze traffic composition and identify anomalies that affect performance.
- Cloud-native observability tools: Platforms like Datadog, Prometheus, or AWS CloudWatch can ingest bandwidth metrics from services, load balancers, or virtual network interfaces.
| Pros of passive monitoring | Cons of passive monitoring |
| Doesn’t add load to the network | Requires access to network devices or flow exporters |
| Reflects real user behavior | May require significant storage and compute in high-traffic environments |
| Enables historical analysis and anomaly detection | Does not show theoretical maximum capacity |
Passive monitoring works best for trend analysis, capacity planning, and incident forensics.
When each method is useful
Active testing answers “what is achievable right now on this path.”
Passive monitoring answers “what did production traffic do over time, and what caused the spike.”
Most teams use both because a clean active test does not rule out congestion during peak hours, and a busy interface in passive charts does not prove misconfiguration.
Which units is network bandwidth measured in?
Network bandwidth is typically measured in bits per second, but that’s just the starting point. Depending on the context (monitoring a website, configuring an API, analyzing traffic across a server cluster), you’ll encounter different units, prefixes, and conventions.
Bits per second vs. bytes per second
The most common unit of bandwidth is bits per second (bps). This measures the raw data transfer capacity of a network connection. However, you’ll often see bandwidth expressed in bytes per second (Bps) too, especially in application-level metrics.
The conversion is simple:
- 1 byte = 8 bits
100 Mbps ≈ 12.5 MB/s (100 ÷ 8)
If your monitoring tool shows a download speed of 800 KBps, that’s 6.4 Mbps (800 × 8).
Common bandwidth units and their prefixes
Bandwidth is usually expressed with metric prefixes to represent larger values. Here’s a breakdown of the most common units:
| Unit | Abbreviation | Value in bits |
|---|---|---|
| Kilobits per second | Kbps | 1,000 bits per second |
| Megabits per second | Mbps | 1,000,000 bits per second |
| Gigabits per second | Gbps | 1,000,000,000 bits per second |
| Terabits per second | Tbps | 1,000,000,000,000 bits per second |
Note: These use the decimal system (base 10), not binary. That’s standard in networking, unlike memory/storage, which often uses binary-based prefixes (1 KiB = 1,024 bytes).
Bits vs. bytes in real-world monitoring
When monitoring bandwidth usage or performance, different tools may report in either bits or bytes. For example:
- UptimeRobot reports response sizes in bytes but tracks network latency and uptime in milliseconds and seconds.
- Browser developer tools often show download sizes in kilobytes or megabytes.
- Command-line tools like iftop or nload typically use bits per second for live traffic.
Always check the unit label. Misreading Mbps as MBps can lead to incorrect assumptions about capacity or performance.
Why it matters for monitoring and planning
Bandwidth units directly affect how you interpret usage trends, detect bottlenecks, or plan for scaling.
For instance:
- If your server’s NIC (network interface card) supports 1 Gbps, and your monitoring shows sustained traffic of 800 Mbps, you’re operating close to capacity.
- If a CDN reports 2 TB of data transferred over 24 hours, dividing by time gives you an average bandwidth usage of ~185 Mbps.
Understanding the units helps you set accurate alert thresholds, compare provider limits, and avoid overages or under-provisioning.
Bandwidth units may seem like a small detail, but they shape how you read every chart, alert, and report.
Bandwidth vs. throughput vs. goodput
When people talk about network performance, bandwidth, throughput, and goodput are often treated as the same thing, but they aren’t. Each one describes a different part of how data moves across a network, and confusing them makes it harder to understand why systems feel slow.
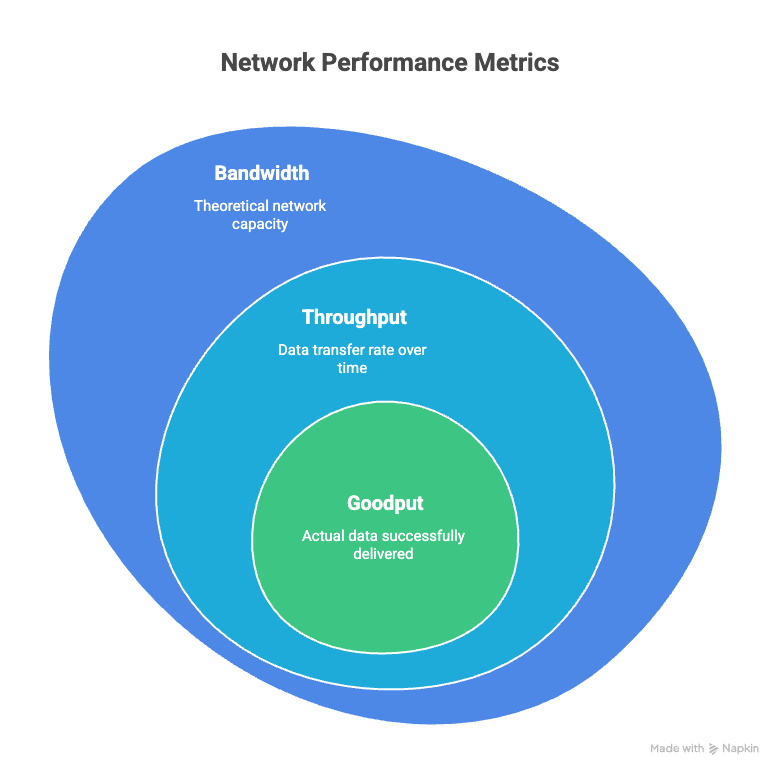
Bandwidth: the theoretical maximum
Bandwidth defines the upper limit of a connection. A 1 Gbps link can never transfer more than 1 gigabit of data per second, no matter how well everything else is working.
What bandwidth does not tell you is how much data is actually moving at any given moment. It only describes capacity, not usage or efficiency.
Bandwidth is useful for capacity planning. It helps answer whether a connection is large enough for the expected workload, but it does not explain day-to-day performance issues.
Throughput: the actual data transfer rate
Throughput is the actual rate at which data is successfully transferred from source to destination over a given period. It’s usually lower than bandwidth due to network congestion, latency, packet loss, or protocol overhead.
If bandwidth is the size of the pipe, throughput is how much water is actually flowing through it.
Let’s say you have a 1 Gbps connection, but during a file transfer, you measure only 600 Mbps. That 600 Mbps is your throughput. The difference between bandwidth and throughput often reveals performance issues (overloaded routers, inefficient routing, suboptimal configurations).
Throughput is what you typically measure when using tools like iPerf or during speed tests. It reflects real-world performance, which makes it more actionable than bandwidth when troubleshooting performance problems.
Goodput: what the application receives
Goodput measures how much of the transferred data is usable by the application. It excludes protocol headers, encryption overhead, and retransmitted packets.
For example, if your throughput is 600 Mbps but 100 Mbps of that consists of TCP headers, SSL handshakes, and retransmitted packets, your goodput is 500 Mbps. This is the data that actually reaches the application in a usable form.
Goodput is especially relevant for performance-sensitive applications like video conferencing, online gaming, or large file transfers. In these cases, protocol overhead can significantly affect the user experience, even if throughput looks fine on paper.
Goodput is harder to measure directly, but some tools (like Wireshark or advanced APM platforms) can estimate it by analyzing packet-level data.
Why the differences matter
Confusing these terms can lead to misdiagnosis. If your site feels slow, but your bandwidth is fine, the issue might be low throughput due to packet loss.
Or, maybe throughput looks solid, but goodput is low because of excessive retransmissions caused by flaky connections or misconfigured firewalls.
Here’s a quick comparison:
| Metric | Measures | Includes overhead? | Use case |
|---|---|---|---|
| Bandwidth | Max possible data rate | Yes | Capacity planning |
| Throughput | Actual data transfer rate | Yes | Real-world performance measurement |
| Goodput | Useful data delivered to the application | No | Application-level performance tuning |
Understanding the difference between bandwidth, throughput, and goodput makes it easier to interpret monitoring data and identify where performance problems actually originate.
What metrics are actually calculated during bandwidth measurement?
Bandwidth measurement does not calculate a single number. It produces a small set of related metrics that describe capacity, transfer behavior, and loss under test conditions. Each metric answers a different diagnostic question.
We’ve already covered throughput in the earlier sections, so we’ll cover only those that haven’t been mentioned yet.
Latency: time delay in data transmission
Latency measures how long it takes for a data packet to travel from the source to the destination and back (round-trip time). It’s usually measured in milliseconds (ms). Lower latency means faster response times, which is especially important for real-time applications like video calls, gaming, or API requests.
Bandwidth and latency are often confused, but they measure different things. Think of bandwidth as the width of a highway and latency as the time it takes a car to travel from point A to B.
A connection might have high throughput (like 100 Mbps) but also high latency (such as 200 ms), which could make real-time interactions feel sluggish.
To be sure, track baseline reachability and round-trip time drift during incidents with Ping monitoring.
Packet loss: missing or dropped data
Packet loss tracks how many data packets fail to reach their destination. Even small amounts of packet loss (1-2%) can disrupt applications, especially those that stream or require constant data flow.
Bandwidth measurement tools often send multiple packets and compare how many are received. If only 98 out of 100 packets arrive, that’s a 2% packet loss rate. This metric is key for diagnosing unreliable connections.
Jitter: variation in packet arrival time
Jitter measures the variability in packet arrival times. Ideally, packets should arrive at consistent intervals. High jitter can cause problems for voice and video applications, where timing is critical.
For instance, if a video call has 30 ms average latency but 50 ms jitter, you’ll likely experience choppy audio or lag. Jitter is typically measured in milliseconds and should be as low as possible.
Transfer time: time to complete a file download or upload
Some bandwidth tests also calculate how long it takes to upload or download a specific file size. This gives a practical view of performance beyond raw throughput. For example, downloading a 100 MB file in 10 seconds implies an average throughput of 80 Mbps.
Transfer time metric is helpful when evaluating performance from a user’s perspective, especially for file-heavy applications or deployments.
How these metrics relate
Bandwidth tests rarely fail because of low raw capacity. They fail because throughput collapses under latency, jitter, or packet loss, which then reduces goodput. This is why a “1 Gbps link” can behave like a much slower connection in real-world conditions.
Factors that affect bandwidth measurements
Bandwidth measurements change even when the connection stays the same because test conditions change. These factors shape the number you see and explain why two tests an hour apart can look like two different networks:
- Time of day and contention
- Distance and routing
- Wi-Fi interference and device limits
- Protocol overhead
- Background traffic
Time of day and network congestion
Internet traffic isn’t constant. During peak usage hours (evenings or business hours), networks experience higher load. This congestion can reduce available bandwidth, especially on shared connections like residential cable or mobile networks.
For example, a speed test at 8 p.m. might show 40 Mbps, while the same test at 2 a.m. could report 80 Mbps.
If you’re monitoring an API or website, test results during high-traffic periods may reflect temporary slowdowns rather than persistent issues. To get a clearer picture, schedule tests at different times and compare results.
Server location and routing paths
The physical distance between your device and the test server affects bandwidth. Data takes longer to travel over longer distances, and more hops between routers can introduce latency and packet loss.
A test to a server in your city will likely show higher bandwidth than one across the globe.
Routing also matters. Suboptimal paths or peering issues between ISPs can throttle throughput. If your ISP routes traffic inefficiently through a congested exchange point, your bandwidth may drop even if your local connection is fine.
Confirm whether slowness hits one geography or multiple paths by comparing probes across regions with multi-location checks.
Device limitations and local network setup
Your hardware can become a bottleneck. Older routers, underpowered CPUs, or outdated network cards can cap throughput regardless of ISP plan. A gigabit internet plan won’t deliver full speed if your laptop only supports 100 Mbps Ethernet.
Wi-Fi adds more variables. Signal interference, distance from the router, and the number of connected devices all reduce bandwidth.
Even microwave ovens or thick walls can degrade wireless performance. For accurate results, run tests on wired connections when possible.
Protocol overhead and test methodology
Bandwidth tests include protocol overhead. TCP/IP headers, encryption, and retransmissions all consume bandwidth. Different tools handle this differently. Some measure throughput at the application layer, while others include lower-level transport data.
For example, a test using HTTP requests will often report lower values than a raw TCP test simply because of the extra overhead from headers and handshakes.
Background activity and competing traffic
Other applications on your network can skew bandwidth measurements. Streaming video, software updates, cloud backups, or even background syncs can consume bandwidth while you’re testing. This is especially common in shared office or home environments.
To isolate the connection, pause or limit other network activity during tests. On servers, use traffic shaping or monitoring tools to identify and control background processes that might interfere with measurements.
Bandwidth measurements are only as accurate as the conditions under which they’re taken. Compare results over time, across destinations, and by method to avoid false conclusions and misdirected fixes.
Why measured bandwidth may differ from advertised bandwidth
You might run a speed test and see numbers that don’t match what your internet provider promised. That’s not unusual. The bandwidth you measure in real-world conditions often falls short of the advertised maximum.
Advertised bandwidth is a maximum, not a guarantee
Internet service providers (ISPs) promote speeds as “up to” a certain number, like 500 Mbps, for example. That’s a theoretical maximum under ideal conditions. It doesn’t mean you’ll consistently get that speed.
ISPs often base these numbers on lab tests with minimal network congestion, optimized hardware, and short physical distances. In practice, your actual bandwidth depends on many factors that rarely align with those perfect conditions and often change throughout the day.
Shared infrastructure limits real throughput
Most access networks are shared. Your connection competes with other users on the same segment. During peak hours, like evenings or lunch breaks, more users are online, which increases contention. A plan rated at 1 Gbps does not reserve that capacity exclusively for one customer.
Routing and peering shape real performance
Your traffic doesn’t travel in a straight line. It hops between routers, ISPs, and sometimes across continents. Each hop introduces potential slowdowns.
If your ISP has poor peering agreements or routes traffic inefficiently, your measured bandwidth to certain destinations will drop. A speed test to a local server might show 800 Mbps, but a download from a server in Europe could crawl at 100 Mbps. The bottleneck isn’t your connection,it’s the route.
Local hardware and software create bottlenecks
Your equipment can cap bandwidth before the ISP link does. A few common culprits:
- Outdated routers or modems: Older hardware might not support gigabit speeds or modern protocols like DOCSIS 3.1.
- Wi-Fi interference: A 2.4 GHz Wi-Fi network in a crowded apartment building can struggle to deliver even 100 Mbps.
- Background processes: Apps syncing files, streaming video, or running updates can eat up bandwidth during tests.
Even ethernet cables matter. A Cat 5 cable maxes out around 100 Mbps, while Cat 5e or Cat 6 can handle gigabit speeds.
Test tools and conditions differ
Bandwidth test tools don’t all work the same way. Some use single-threaded downloads, others use multiple streams. This affects results.
Also, browser-based tests can be influenced by CPU load, browser extensions, or even thermal throttling on laptops. For more consistent results, use a dedicated testing app or command-line tool like iperf, and test multiple times at different hours.
ISP traffic shaping and throttling apply
Some ISPs apply traffic shaping to prioritize or limit certain types of traffic. For example, streaming services or large file downloads might be throttled during high usage periods.
Even if your speed test shows 300 Mbps, your file transfer from a cloud provider might be capped at 50 Mbps due to policy-based throttling. This is especially common on mobile and residential networks.
Measured bandwidth reflects how the network behaves at that moment, not a promise being broken. Interpreting results correctly means accounting for shared capacity, routing, hardware, and policy instead of treating the advertised number as a constant.
Conclusion
Network bandwidth is the maximum data transfer capacity of a network connection, measured in bits per second. It represents potential capacity, not guaranteed performance.
Bandwidth is measured either by generating test traffic through active testing or by observing real production traffic through passive monitoring. Active tests measure achievable throughput under controlled conditions, while passive monitoring tracks utilization and trends over time.
The numbers reported during measurement reflect real-world conditions such as congestion, latency, packet loss, and protocol overhead. Advertised capacity defines the upper limit, but actual performance depends on timing, load, and network behavior.
FAQ's
-
Bandwidth is the maximum amount of data that can be transmitted over a connection in a given time. It’s usually measured in Mbps or Gbps. Think of it as the capacity of a connection, not how fast something feels.
-
No. Bandwidth is capacity. Speed is the perceived experience, which depends on bandwidth, latency, congestion, and throughput together.
-
Bandwidth is measured in bits per second. Most consumer and business connections use megabits per second or gigabits per second. Monitoring tools measure actual usage over time to show how much of that capacity is being used.
-
Low effective bandwidth can be caused by congestion, shared connections, throttling, packet loss, hardware limits, or heavy concurrent usage. Sometimes the advertised capacity is simply being saturated.
-
You can reduce bandwidth usage by compressing payloads, caching responses, using CDNs, limiting unnecessary API calls, optimizing media files, and controlling traffic spikes with rate limiting.