TL;DR (QUICK ANSWER)
Server monitoring is the practice of continuously tracking the health, performance, and availability of your servers. It gives you early warning of issues, helps prevent outages, and ensures your systems run reliably.
By monitoring the right metrics, setting smart alerts, and combining internal and external checks, you can maintain uptime, troubleshoot problems faster, and deliver a smooth experience for users.
Server monitoring is about visibility, not guesswork.
It shows you how your servers are performing in real time, so you can spot issues early instead of finding out when users complain or services fail.
Good monitoring helps teams catch performance problems before they escalate, respond faster when something breaks, and keep critical systems available. It also plays a key role in meeting uptime targets and reliability commitments.
We’ll break down server monitoring in practical terms. You’ll learn which metrics are worth tracking, how different monitoring approaches work, how to set up alerts that actually help, and how monitoring fits into incident response and long-term reliability.
Key takeaways
- Server monitoring gives you real-time insight into server health and performance.
- Early detection reduces downtime, slowdowns, and user-facing incidents.
- The right metrics matter more than collecting everything.
- Smart alerting prevents noise and helps teams focus on real issues.
- Clear incident workflows turn monitoring data into faster recovery.

What is server monitoring?
Server monitoring is the practice of continuously tracking how your servers are performing, behaving, and responding in real time. Instead of guessing whether a server is doing fine, monitoring gives you clear, measurable signals about its health, availability, and reliability.
Server monitoring helps you answer one basic question: Is my server doing what it’s supposed to do right now?
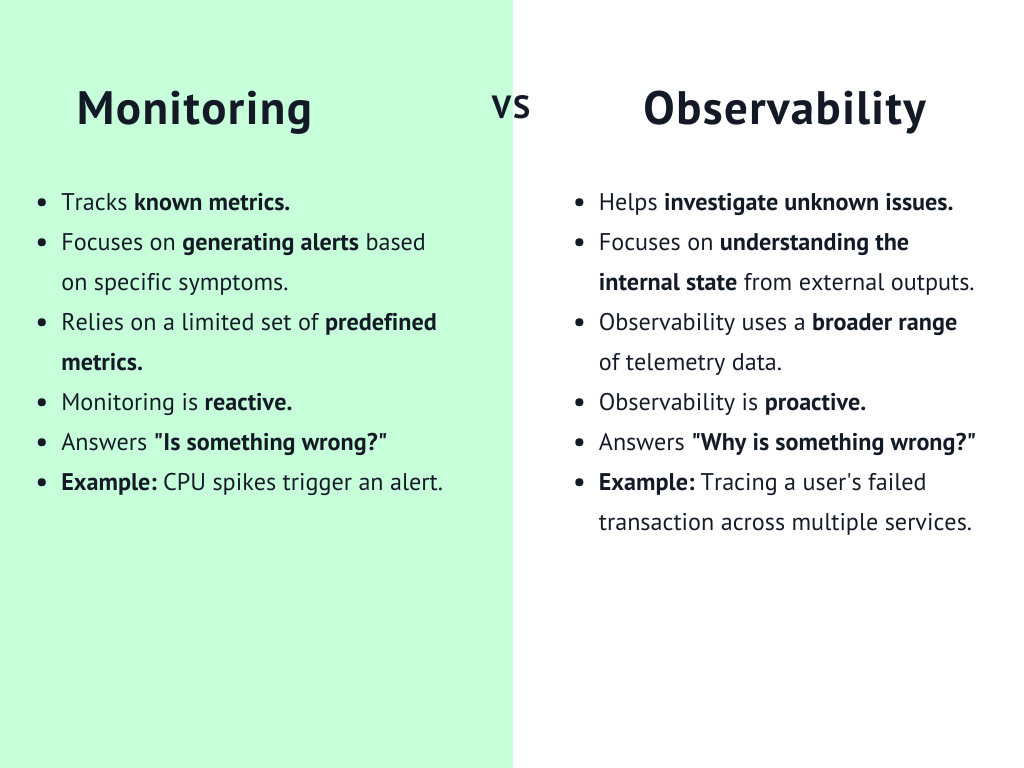
Difference between monitoring and observability
Are monitoring and observability the same? While the two are closely related, they are not the same thing.
Monitoring focuses on known signals. You decide which metrics matter, set thresholds, and get alerts when something goes wrong. For example, if CPU usage spikes above 90 percent, you receive a notification.
Observability goes a step further. It helps you understand why something happened by exploring logs, traces, and system behavior across multiple components. Observability is more about deep investigation, while monitoring is about fast detection.
What does a “healthy server” actually mean?
Just because your server is online, doesn’t mean it is healthy.
A truly healthy server is available, responsive, and stable under normal and peak workloads. It responds to requests quickly, has enough resources to handle traffic, and doesn’t show warning signs like memory leaks, disk saturation, or frequent restarts.
Server monitoring helps you define what “healthy” means for your specific environment, rather than relying on assumptions.
Why monitoring is proactive, not reactive
Without monitoring, most teams only learn about problems after users complain. At that point, the damage is already done.
Server monitoring flips that approach. Watching metrics continuously and triggering alerts early lets you act before a small issue turns into a full outage. You see trends, predict capacity limits, and fix weaknesses ahead of time.
That is what makes server monitoring proactive. It helps you stay in control instead of constantly reacting to incidents.
Why server monitoring is critical for modern infrastructure
Modern infrastructure is complex and distributed. You are running cloud servers, containers, third party services, and internal tools all at once. When something breaks, it rarely fails in isolation. Server monitoring gives you the visibility you need to keep everything running smoothly.
Here is why it plays such a critical role today.
Preventing downtime
Before downtime happens, servers usually show early warning signs, like rising CPU usage, shrinking disk space, or slower response times.
Server monitoring helps you spot these signals early and take action before users feel the impact. You can scale resources, fix misconfigurations, or restart failing services long before a full outage occurs.
This matters because downtime gets expensive fast.
In e-commerce, even a few minutes of disruption can lead to major revenue loss. When Amazon experienced a 59-minute outage in 2021, it reportedly missed out on about $34 million in sales.
Catching performance degradation early
Not every issue causes a complete outage. Sometimes things just get slower, and that can be just as damaging.
Monitoring helps you detect gradual performance degradation, such as increasing response times or higher error rates. These issues often go unnoticed without clear metrics and alerts.
In e-commerce, even a one second delay in page load time can hurt conversions. Server monitoring can alert you when backend performance starts slipping, so you can fix it before shoppers abandon their carts.
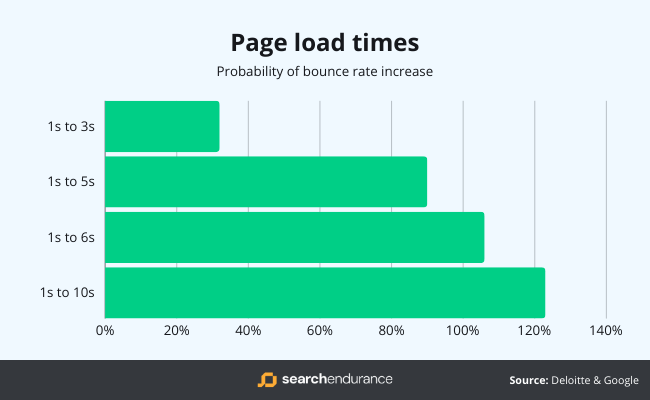
According to data from Google, the probability of a bounce (that’s when a visitor leaves your website without taking any action) increases by 32% if your web page load time increases from 1 second to 3 seconds.
- Supporting SLAs and uptime guarantees
If you offer service level agreements or uptime guarantees, you need proof that your systems meet those promises.
Server monitoring provides objective data on uptime, availability, and performance. It helps you track compliance, identify weak points, and demonstrate reliability to customers and stakeholders.
For SaaS providers, monitoring is often the backbone of meeting uptime commitments and avoiding costly SLA violations.
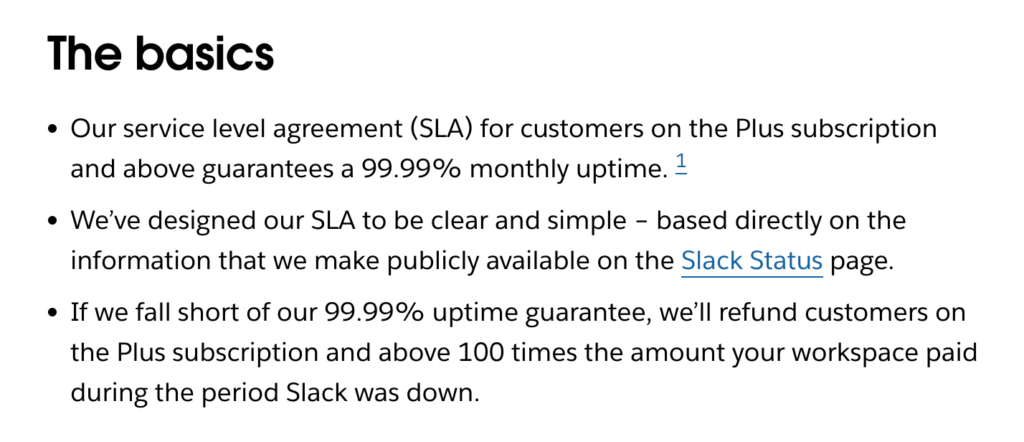
In the example above, Slack publicly commits to a 99.99% monthly uptime for eligible customers and backs that promise with clear compensation if it falls short. By linking its SLA to a public status page, Slack makes uptime easy to see and verify.
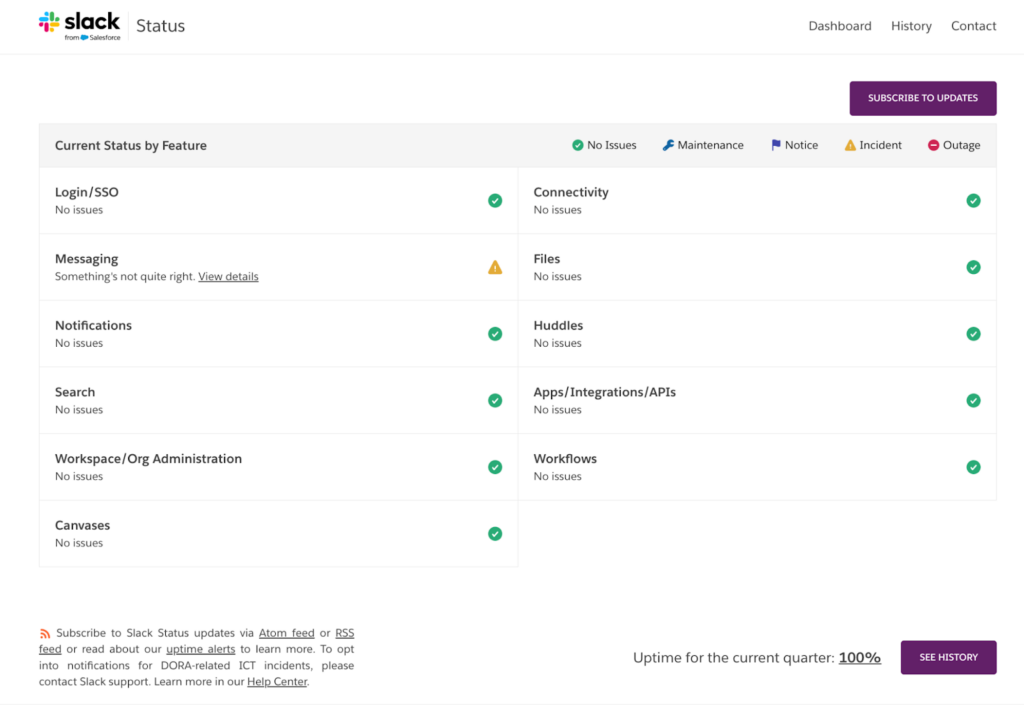
The Slack status page showing 100% uptime for the current quarter helps build trust and shows how monitoring data is used to prove the service is reliable.
Tip: Want more about uptime? Read our post How to Calculate Uptime? And 5 Tips for Achieving 99.999%.
- Enabling faster incident response
When an incident does happen, speed matters. The faster you understand what is wrong, the faster you can fix it.
Server monitoring shortens that response time by showing you exactly where the problem starts. Instead of guessing, your team can see which server, metric, or service is affected and act immediately.
For internal systems, this is especially important. If a payroll system or internal dashboard goes down, employees cannot do their jobs. Monitoring helps IT teams resolve issues quickly and minimize disruption.
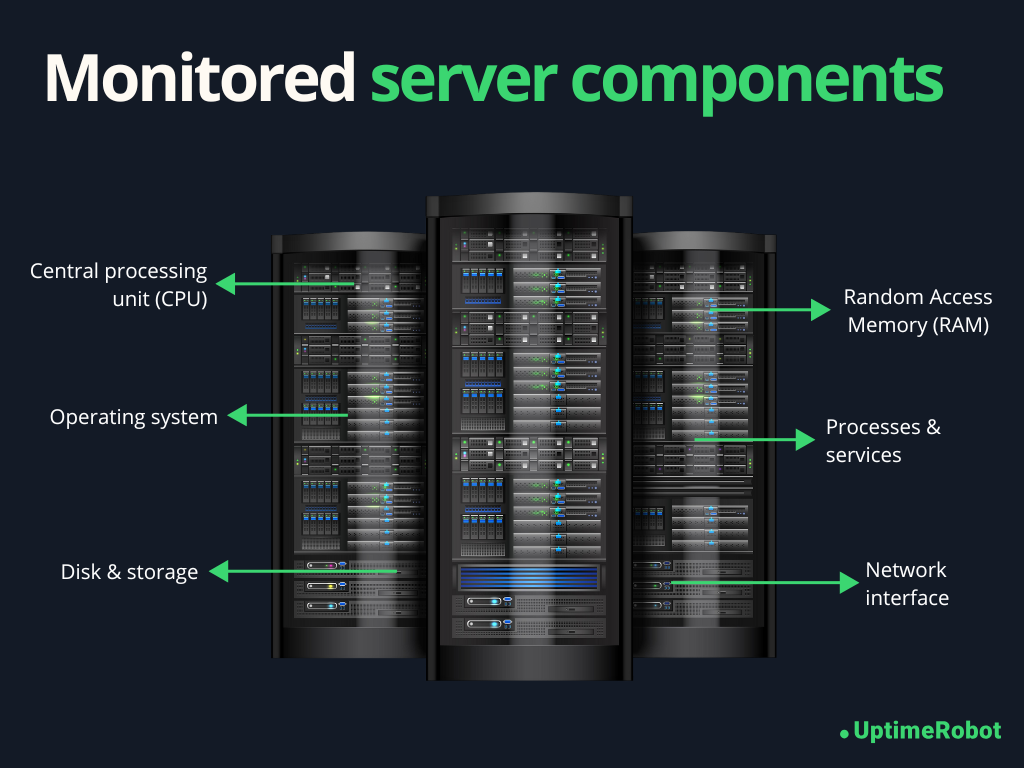
What should you monitor on a server?
Server monitoring helps you understand whether a server has enough resources, responds quickly, and behaves as expected behind the scenes. It goes beyond basic uptime by tracking the metrics that show the server’s real health.
Here are the key areas every server monitoring setup should cover.
- CPU metrics
Your CPU tells you how hard the server is working. High or sustained CPU pressure often points to performance bottlenecks or inefficient applications.
- CPU usage: CPU usage shows how much processing power your server is consuming at any given time. Occasional spikes are normal, but consistently high usage can slow down applications and cause timeouts.
- Load average: Load average measures how many processes are waiting for CPU time. A load average that stays higher than the number of available CPU cores usually means the server is overloaded.
- Context switching: Context switching tracks how often the CPU switches between tasks. Excessive context switching can indicate too many running processes or inefficient multitasking, which can degrade performance.
- Memory metrics
Memory issues are one of the most common causes of server instability. Unlike CPU spikes, memory problems often get worse over time.
- RAM usage: RAM usage shows how much memory applications and the operating system are using. When available memory runs low, servers may slow down or start killing processes.
- Swap average: Swap usage indicates that the server is running out of physical memory and relying on disk instead. Heavy swap usage is a warning sign and often leads to serious performance drops.
- Memory leaks: Memory leaks happen when applications fail to release memory they no longer need. Monitoring memory trends over time helps you catch these issues before the server runs out of resources.
- Disk and storage metrics
Storage problems can cause sudden failures if they are not caught early.
- Disk space usage: Disk space usage shows how full your storage is. Running out of disk space can crash applications, prevent logs from being written, or stop the server from functioning properly.
- Disk I/O: Disk I/O measures how fast data is read from and written to disk. High I/O wait times can slow down databases, file systems, and applications that depend on frequent disk access.
- Inode exhaustion: Inode exhaustion occurs when a server runs out of file pointers, even if disk space is still available. This often happens on servers that generate many small files, like log heavy systems.
- Network metrics
Network health directly affects how users experience your services.
- Latency: Latency measures how long it takes for data to travel between systems. Rising latency can lead to slow page loads and delayed API responses.
- Packet loss: Packet loss happens when data packets fail to reach their destination. Even small amounts of packet loss can cause noticeable performance issues and connection instability.
- Throughput: Throughput shows how much data your server can send and receive over the network. Sudden drops may indicate congestion or network configuration problems.
- Connection errors: Connection errors reveal failed or refused network connections. These errors often point to overloaded services, firewall issues, or misconfigured applications.
- Process and service health
Even if system resources look fine, critical services still need to be running.
- Running processes: Monitoring running processes helps you understand what is active on the server and spot unusual or runaway processes.
- Critical services: Critical services like web servers, databases, and background workers should always be monitored. If one of them stops, you want to know immediately.
- Zombie processes: Zombie processes are tasks that have completed execution but still occupy system resources. A growing number of zombie processes can signal deeper issues with application or process management.
Tracking these metrics over time shows you what “normal” looks like and makes it easier to catch issues before they turn into outages.
Here’s a concise list of all the key server metrics you need to track.
| Category | Metrics to monitor |
| CPU | CPU usage, load average, context switching |
| Memory | RAM usage, available memory, swap usage, memory growth over time |
| Disk and storage | Disk space usage, free disk space, disk I O, inode usage |
| Network | Latency, packet loss, throughput, connection errors |
| System health | System uptime, file descriptor usage, system restarts |
| Processes | Number of running processes, resource usage per process |
| Services | Service uptime, service restarts, failed services |
| Application | Response time, error rates |
| Dependencies | Database availability, cache availability, queue backlogs |
| External availability | Endpoint uptime, external response time |
Types of server monitoring
Server monitoring can be set up in different ways. The right approach depends on your infrastructure, how much visibility you need, and how much control you want over your servers. In the real world, most teams use more than one type of monitoring together.
- Agent-based monitoring
Agent based monitoring uses a small piece of software installed directly on the server. This agent collects system level metrics and sends them to your monitoring platform.
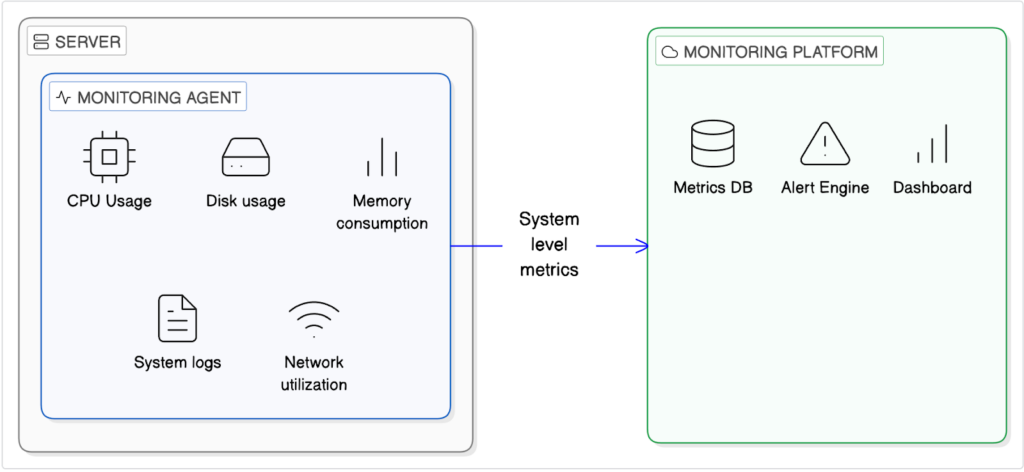
- How agents work
Once installed, an agent runs in the background and gathers detailed data such as CPU usage, memory consumption, disk I/O, and process activity. It reports this information at regular intervals, giving you deep visibility into what is happening inside the server.
- Pros and cons of agent-based monitoring
The biggest advantage of agent based monitoring is detail. You get granular, real-time insights and can track trends over time.
The downside is overhead. Agents need to be installed, maintained, and updated. In highly restricted or temporary environments, that can be a challenge.
- Use cases
Agent based monitoring works best for long running servers, databases, and internal systems where deep performance insight is critical.
- Agentless monitoring
Agentless monitoring does not require installing anything on the server. Instead, it checks server availability and behavior from the outside.
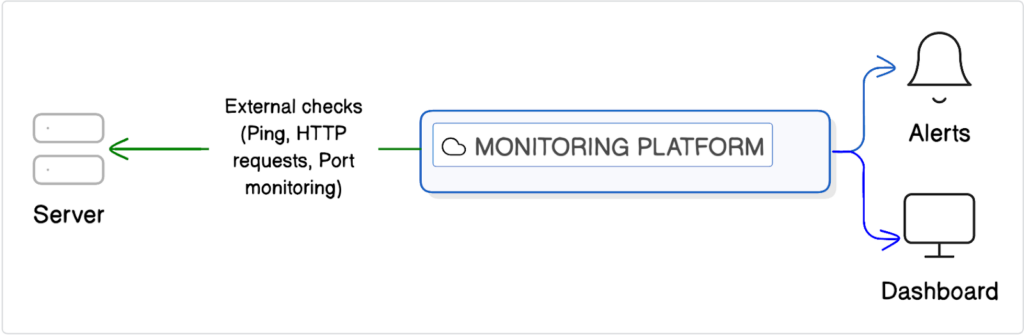
- What are external checks?
External checks typically use methods like ping, HTTP requests, or port monitoring to confirm that a server is reachable and responding correctly. These checks simulate real user access and help you see what users experience.
- When is agentless enough?
Agentless monitoring is often enough when you mainly care about uptime and basic responsiveness. It works well for simple websites, APIs, and environments where installing agents is not possible or practical.
- Cloud native monitoring
Most cloud providers like AWS (CloudWatch), Google Cloud (Operations Suite, formerly Stackdriver), and Microsoft Azure (Azure Monitor) offer built-in monitoring tools for their services.
- Cloud provider metrics
Cloud-native monitoring tools provide metrics, logs, and alerts for resources running in the cloud without installing agents. They give you easy access to information like CPU usage, network traffic, and storage performance, and can be quickly integrated with alerts.
- Gaps and limitations
While convenient, these tools usually focus on a single cloud platform. They may not show application-level details or the full user experience and often work best only within that specific cloud ecosystem.
- Hybrid monitoring
Many teams use a hybrid approach. Hybrid monitoring combines agent-based internal metrics with agentless external checks.
Internal monitoring shows how the server is performing, while external checks confirm whether users can actually access it. This setup gives you the best of both worlds.
You can catch resource issues early and still be alerted if your service goes down from the user’s perspective. For modern infrastructure, this layered approach is often the most reliable way to monitor servers effectively.
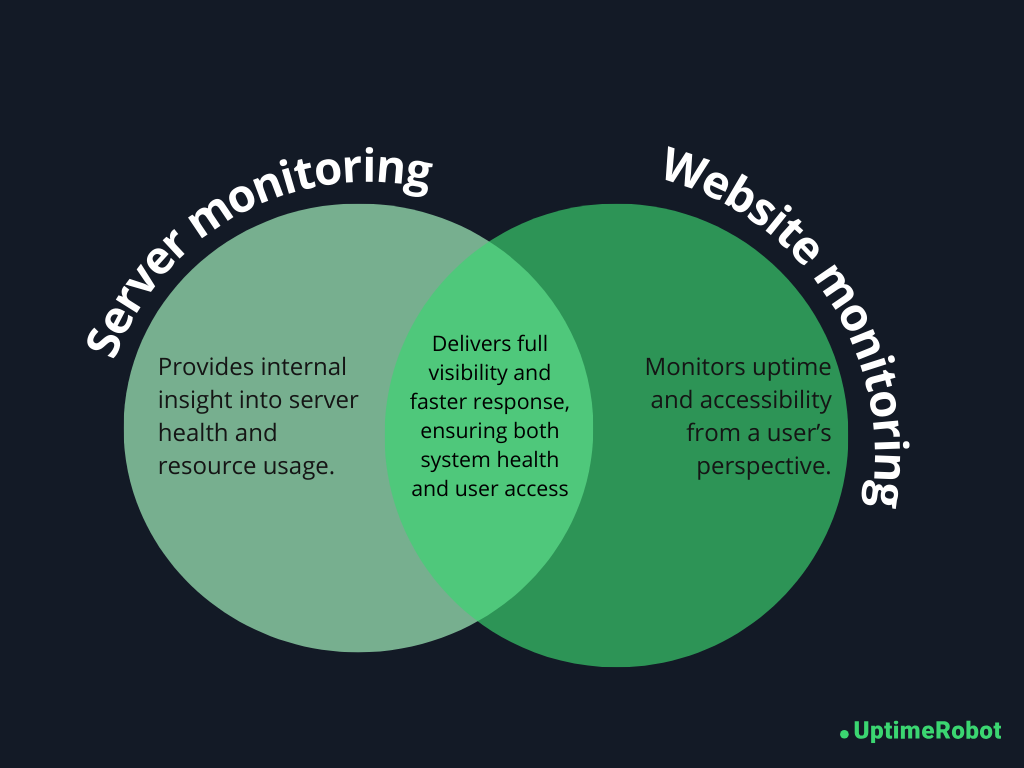
Server monitoring vs. website monitoring
Server monitoring and website monitoring are closely related, but they answer very different questions. Understanding the difference helps you build a monitoring setup that actually reflects what users experience.
Server monitoring focuses on what is happening inside the server. It can detect issues like:
- High CPU usage
- Memory exhaustion
- Disk space running out
- Failing services
- Abnormal process behavior
It tells you when a server is under stress, misconfigured, or slowly degrading over time. Server monitoring is especially good at catching early warning signs. You often see problems here before they turn into full outages.
What server monitoring cannot reliably tell you is how your website or application looks from the outside.
A server might be up, metrics may look normal, and services could be running. Yet users may still face broken pages, DNS issues, SSL errors, routing problems, or third party dependency failures. From the server’s perspective, everything seems fine. From the user’s perspective, the site is down. This is where server monitoring alone falls short.
Why is external monitoring required?
External monitoring fills this gap by checking your website or service from outside your infrastructure.
It verifies whether real users can access your site, load pages, and receive correct responses. This type of monitoring catches issues that server-level metrics can miss, such as CDN failures, DNS misconfigurations, expired certificates, or regional connectivity problems.
External monitoring is also useful for validating uptime guarantees. It measures availability from multiple locations and provides an objective view of downtime.
Why must you have both?
For a reliable setup, you should combine both approaches.
Server monitoring shows why something might break by revealing resource pressure and internal failures. Website (or external) monitoring shows whether users are actually affected.
When an alert fires, external monitoring confirms there is a real user-facing issue, and server monitoring helps you quickly find the root cause.
Together, they give you full visibility.
You see both the health of your infrastructure and the real experience of your users. That combination is what turns monitoring into a powerful, trustworthy system instead of a guessing game.
Server monitoring metrics that actually matter
Modern servers generate a massive amount of data, but not all of it deserves your attention. Effective server monitoring focuses on signal over noise, helping you spot real issues without being overwhelmed by alerts.
Avoid the noise
Some metrics may look important but can be misleading when taken out of context:
- Instant CPU spikes: Short bursts of high CPU usage are normal and usually harmless. Alerting on every spike creates noise. Sustained high load over several minutes or hours is what matters.
- Memory usage without context: Operating systems use available memory for caching, which can make memory look full even when everything is healthy.
- Disk usage spikes: A disk filling up slowly over days or weeks gives you time to act. Monitoring trends is more useful than reacting to a sudden spike without context.
These metrics are not useless, but they work best when tracked as trends over time, rather than triggering alerts on every small change.
Metrics that indicate real risk
The metrics that truly matter are those showing sustained stress or gradual degradation. These patterns often signal problems that will not fix themselves:
- Sustained high CPU load over time: Continuous high CPU usage indicates the server is under constant stress and may struggle to keep up with requests, potentially leading to slow performance or crashes.
- Rising swap usage: When the system increasingly relies on swap memory, it signals that RAM is insufficient for current workloads, which can slow down the server and affect applications.
- Growing disk usage: Disk space that steadily fills over days or weeks can eventually cause application failures, prevent logging, or impact database operations if not addressed in time.
- Increasing response times: Gradually slower responses from your server or services often indicate underlying performance bottlenecks, such as overloaded resources, database contention, or network issues.
- Repeated service restarts: Services that keep restarting suggest instability in the application or server, which can disrupt users and point to deeper configuration or resource problems.
Focusing on these metrics helps you catch issues before they become outages.
What are leading and lagging indicators?
Not all metrics give warnings at the same stage.
Leading indicators warn you before an outage happens:
- Steadily increasing load average
- Memory usage trending upward
- Disk space slowly filling up
Lagging indicators confirm that something is already broken:
- Service crashes
- Failed health checks
- Connection errors
Strong monitoring relies more on leading indicators, because they give you time to act and prevent downtime.
Alerting strategies for server monitoring
Alerts are only useful if people trust them. A good alerting strategy helps you respond quickly without overwhelming your team. The key is to balance sensitivity with relevance.
Here are the alerting approaches that actually work in practice.
Threshold-based alerting
Threshold based alerting triggers notifications when a metric crosses a defined limit. It’s simple, predictable, and widely used.
- Static vs. dynamic thresholds
Static thresholds use fixed values, like ‘CPU usage above 85%’. They’re easy to set up and understand, but they don’t adapt to changing workloads.
Dynamic thresholds adjust based on historical behavior and time patterns. For example, higher CPU usage during business hours may be normal, while the same usage at night may not be. Dynamic thresholds reduce false positives but require more tuning and historical data.
- Common mistakes while setting thresholds
A common mistake is setting thresholds too aggressively. Alerting on every small deviation creates noise and leads to alert fatigue.
Another mistake is using the same thresholds for every server. Different workloads behave differently, and alerts should reflect that reality.
Anomaly-based alerting
Anomaly based alerting looks for behavior that deviates from normal patterns rather than fixed limits.
- When anomaly-based alerting helps
This approach is useful in complex or fast changing environments where normal behavior is hard to define.
For example:
- SaaS platforms: Detecting gradual memory leaks or slow API responses before customers notice.
- E-commerce sites: Spotting unusual traffic spikes that could indicate bots or fraud.
- Streaming services: Catching slowdowns in video delivery or unusual request patterns that static thresholds might miss.
- When anomaly-based alerting creates noise
Anomaly detection can also create confusion if it is not tuned properly. For example:
- Retail sites during promotions: High traffic may be flagged as abnormal even though it’s expected.
- Cloud infrastructure with variable workloads: Normal scaling events can trigger alerts if the system sees them as deviations.
Anomaly-based alerts work best as a complement to threshold-based monitoring, not a replacement. They provide early warning for subtle problems while thresholds handle known limits.
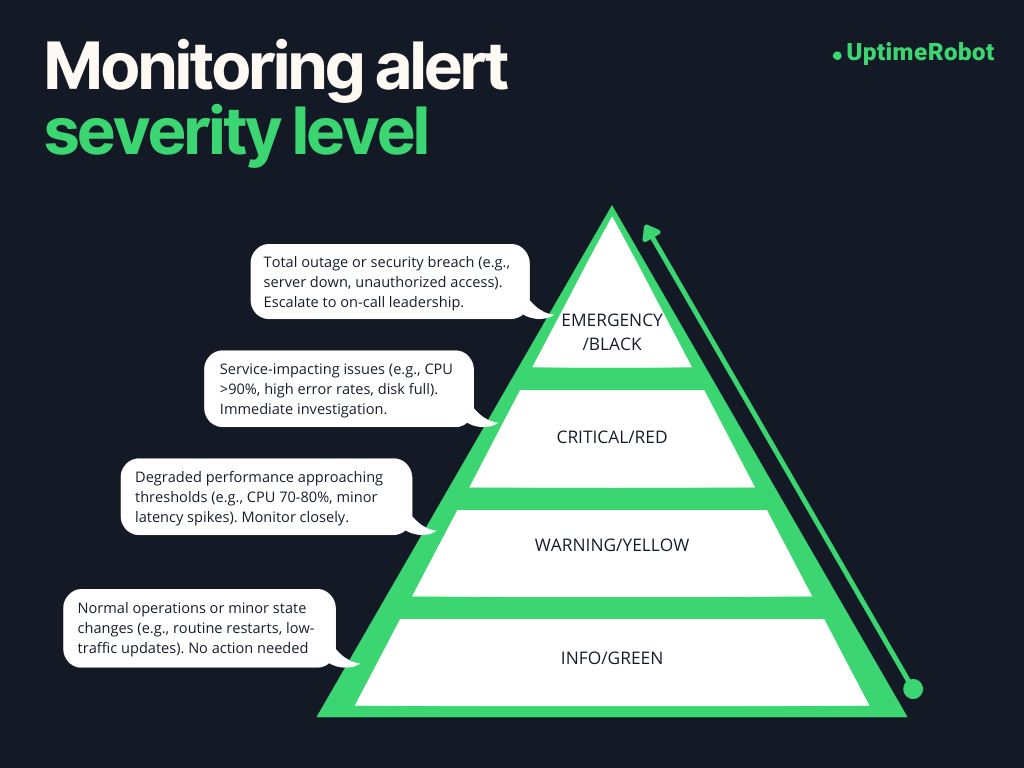
Alert severity levels
Not every alert deserves the same level of attention. Clear severity levels help teams prioritize their response.
- Warning vs. critical
Warnings indicate potential problems that need attention but are not urgent. For example, disk usage approaching a limit or rising load during peak hours.
Critical alerts signal immediate risk, such as a service being down or a server running out of disk space.
- Who should be alerted and when
Alerts should reach the right people at the right time.
Critical alerts should notify on-call engineers or operations teams immediately. Warnings can be sent to shared channels or dashboards for later review.
Don’t alert everyone about every issue. Send notifications only to the right people. Clear and relevant alerts help teams act faster, making server monitoring a useful tool instead of a constant distraction.
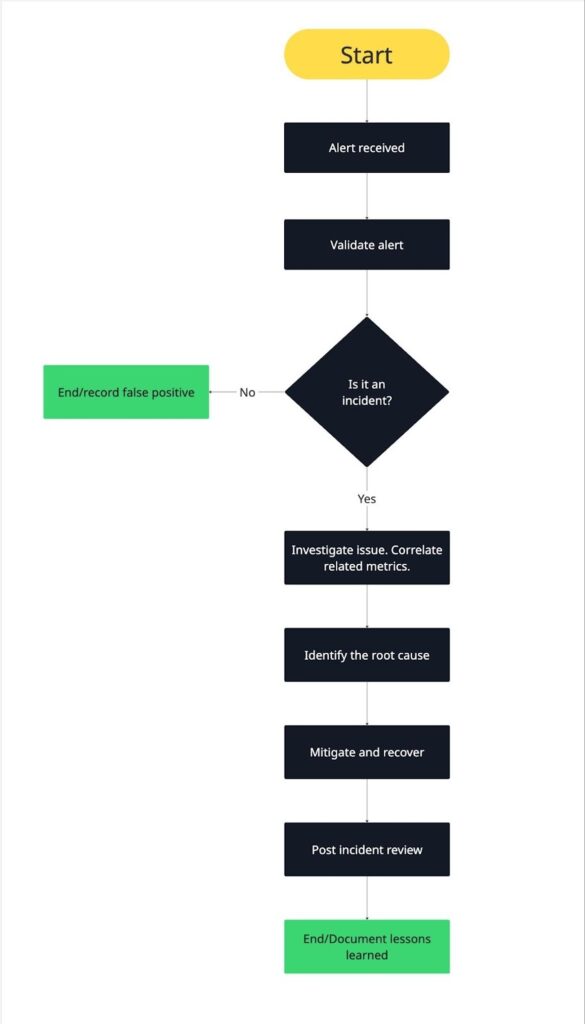
Server monitoring incident response workflow
Alerts are just the starting point. What really matters is how your team responds when a notification comes in. A clear, repeatable incident response workflow helps reduce downtime, stress, and confusion.
Here’s a practical step-by-step workflow you can use to manage alerts effectively.
- Alert received
The process starts when an alert fires. This could be a critical uptime alert, a resource threshold breach, or a service health failure.
At this stage, make sure the alert reaches the right person or team, acknowledge it quickly, and confirm someone is responsible for investigating. Clear ownership prevents delays and duplicate effort.
- Validation and scope
Next, validate the alert and understand its scope.
Check whether the alert reflects a real issue or a false positive. Then determine how widespread the problem is. Is it affecting a single server, a service group, or the entire environment?
External checks are especially useful here. They help confirm whether users are actually impacted.
- Metric correlation
Once the issue is confirmed, correlate related metrics.
Look at CPU, memory, disk, and network metrics around the time the alert triggered. Check recent deployments, configuration changes, or traffic spikes.
Correlating metrics helps you see patterns instead of isolated data points. This step often narrows down the cause quickly.
- Root cause identification
With correlated data in hand, identify the root cause.
Ask what changed and why the system could not handle it. Was there a memory leak, a failed service, a scaling issue, or an unexpected traffic surge?
The goal isn’t just to fix the symptom, but to understand the underlying problem so it doesn’t repeat.
- Mitigation and recovery
After identifying the cause, take action to restore normal operation.
This may include restarting services, freeing resources, scaling infrastructure, or rolling back a recent change. Prioritize restoring availability and performance first, then focus on permanent fixes.
Monitoring continues during this phase to confirm that metrics return to healthy levels.
- Post-incident review
Once the incident is resolved, review what happened.
Document the timeline, root cause, and impact. Identify what worked well and where the response could improve. Update alerts, thresholds, or runbooks if needed.
Post incident reviews turn outages into learning opportunities. Over time, this feedback loop makes your server monitoring and incident response stronger and more reliable.
Tip: Read The Ultimate Guide to Creating an Effective Incident Response Plan to learn how to build a workflow that keeps your team prepared and responsive.
Real server monitoring scenarios
Let’s look at server monitoring in action. Here are three realistic scenarios that show how monitoring can detect issues early and help resolve them before they turn into major outages.
Memory leak causing gradual failure
A memory leak occurs when an application or service keeps allocating memory without releasing it properly. Over time, this slowly consumes available RAM, leading to slower performance and eventually crashes or service restarts if it isn’t caught early.
Symptoms:
- Applications gradually slow down as available memory decreases
- Services or applications crash or restart periodically
- Unexpected swap usage as the system tries to compensate for low RAM
Metrics involved:
- RAM usage steadily trending upward over time
- Swap usage increasing as RAM runs low
- Application process memory growth, indicating which process is leaking
Detection method:
- Agent-based monitoring tracks memory usage per process
- Trend analysis triggers a warning when memory growth exceeds expected baseline
Resolution steps:
- Identify the process or service consuming excessive memory
- Restart the application to release memory temporarily
- Investigate code or service configuration to fix the memory leak
Memory leaks are insidious because the system may appear healthy in short-term metrics, but over hours or days, performance gradually degrades. Early detection through server monitoring allows teams to intervene before users notice slowdowns or outages.
Disk space exhaustion taking down an application
When a disk gradually fills up, it can cause applications or databases to fail, logs to stop writing, or services to crash. Unlike sudden spikes, this issue builds over days or weeks, giving you a window to prevent downtime, if you catch it early.
Symptoms:
- Applications fail to write logs or save files
- Services crash unexpectedly
- Errors related to file storage or database writes
Metrics involved:
- Disk usage percentage approaching 100%
- Available inode count decreasing (for systems that track it)
- Disk I/O wait times increasing as free space dwindles
Detection method:
- Agent-based monitoring tracks disk usage and inode availability per filesystem
- Trend analysis triggers warnings when usage approaches thresholds or growth rate is high
Resolution steps:
- Identify which partitions or volumes are filling up
- Free up space by cleaning logs, removing temporary files, or archiving data
- Consider scaling storage or adjusting application behavior to prevent recurring issues
A nearly full disk may not cause immediate failure, but it slowly erodes system reliability. Monitoring trends ensures you can take action before users experience outages or data loss.
Network latency impacting user experience
Network issues can degrade performance even when servers are healthy. Latency or packet loss affects APIs, websites, and internal services, causing slow responses or errors for end users.
Symptoms:
- Slow page loads or API responses
- Timeouts or intermittent connection failures
- Complaints from users about sluggish performance
Metrics involved:
- Network latency between critical services or endpoints
- Packet loss rate indicating dropped network traffic
- Connection errors or timeouts from services
Detection method:
- Agentless or external checks monitor response times and connectivity
- Trend analysis identifies increasing latency patterns before they cause outages
Resolution steps:
- Identify whether the issue is internal (server/network) or external (ISP, CDN, or third-party service)
- Re-route traffic, adjust network configurations, or notify the provider
- Monitor post-fix to confirm normal performance has resumed
Even if servers are functioning internally, network problems directly impact users. Early detection lets teams fix issues before customers notice slowdowns or errors.
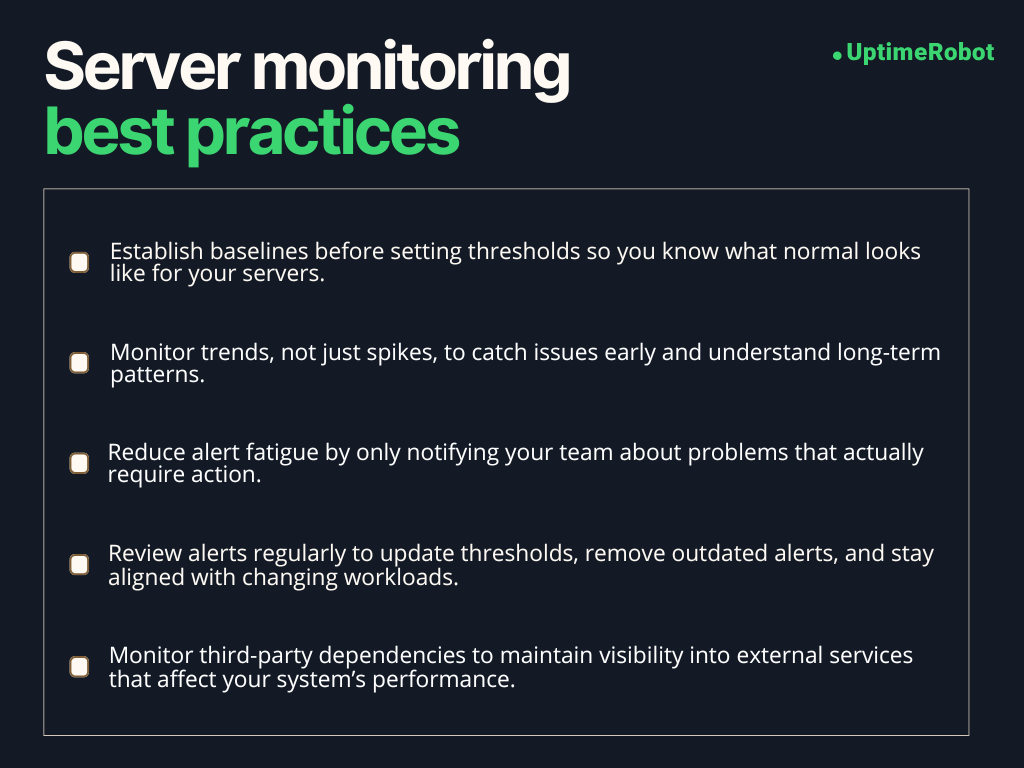
Server monitoring best practices
Implement these server monitoring best practices to get lasting value from your monitoring setup.
Establish baselines first
Before setting alert thresholds, it’s important to know what “normal” looks like for your servers. Baselines show how systems behave during regular traffic, peak usage, and quiet periods. Without them, thresholds are just guesses. With them, alerts become meaningful and accurate.
Spend time observing metrics first, then set thresholds based on real server behavior, not assumptions.
Monitor trends, not just spikes
Short spikes happen frequently and often don’t matter.
What really matters is the direction of change. Gradually rising load, steadily increasing memory usage, or disk space slowly filling up are far more important than momentary peaks.
Trend-based monitoring helps you act early and plan ahead instead of reacting at the last minute.
Reduce alert fatigue
Every alert should answer one question. Does this require action right now?
If the answer is no, it probably should not wake someone up. Limit alerts to conditions that threaten availability, performance, or data integrity.
Use warning alerts for early signals and reserve critical alerts for real emergencies. Fewer alerts lead to faster, more confident responses.
Review alerts regularly
Monitoring setups aren’t static. Applications change, traffic patterns evolve, and infrastructure grows. Alerts that made sense for you six months ago may be useless today.
Schedule regular alert reviews with your team to remove noisy alerts, adjust thresholds, and add coverage for new risks. This keeps your monitoring relevant and trusted.
Monitor third-party dependencies
Your servers rarely operate alone. Third party services like payment gateways, APIs, CDNs, and authentication providers can impact your availability even if your servers are healthy.
External monitoring helps you track these dependencies and quickly identify when an outage is outside your control. That visibility is critical for faster troubleshooting and clearer communication during incidents.
SLAs, uptime, and server monitoring
Server monitoring is not just about keeping servers running. It also plays a crucial role in meeting service level agreements (SLAs) and delivering the uptime your users expect.
Understanding how metrics, uptime, and reporting work together helps you manage both technical performance and customer trust.
How server metrics support SLAs
SLAs define the level of service you promise to your customers, often including uptime guarantees, response times, and performance targets. Server monitoring provides the data needed to meet these promises.
For example:
- CPU, memory, and disk metrics help prevent performance issues that could violate response time commitments.
- Network metrics like latency and packet loss ensure that users can reliably connect to your services.
- Service health checks confirm that critical applications remain available.
By monitoring these metrics proactively, you can catch problems before they affect SLA performance, giving your team the chance to act before users notice.
What uptime percentages really mean
Uptime percentages are often cited in SLAs, such as 99.9% or 99.99%. These numbers describe how much of the total time a system is expected to be fully operational.
- 99.9% uptime allows for about 8.7 hours of downtime per year.
- 99.99% uptime reduces allowable downtime to just under 53 minutes per year.
Small differences in percentages matter, especially for high traffic SaaS platforms or ecommerce systems. Monitoring helps you track real availability and ensures you stay within these limits.
Below is a table mapping uptime percentages to their corresponding downtime allowances.
| Uptime percentage | Maximum downtime per year |
| 99% | ~3.65 days |
| 99.5% | ~1.83 days |
| 99.9% | ~8.7 hours |
| 99.95% | ~4.38 hours |
| 99.99% | ~52.6 minutes |
| 99.999% | ~5.26 minutes |
How monitoring data is used in reporting
Monitoring data is the backbone of SLA reporting. Metrics collected over time can:
- Verify uptime and availability against SLA targets
- Identify trends that could impact future SLA performance
- Provide evidence in case of disputes or service credits
Reports often combine server level data with external uptime checks to give a complete picture of both internal health and user experience. This transparency builds trust with customers and helps your team continuously improve service reliability.
Server monitoring turns abstract SLA promises into actionable insights. It not only helps prevent downtime but also proves that your systems are meeting the reliability standards your customers expect.
How server monitoring helps prevent downtime
Downtime is every IT team’s worst fear. We all know it’s sometimes unavoidable, but server monitoring helps you catch problems early and fix them before they turn into major outages.
Early detection
The first line of defense is noticing problems before they impact users. Monitoring metrics like CPU load, memory usage, disk space, and service health helps you spot anomalies early.
For instance, a gradually rising memory usage trend may indicate a memory leak long before it causes a crash. Early detection gives your team time to intervene and prevent downtime.
Faster MTTR
When something does go wrong, monitoring data helps you respond quickly. Alerts guide your team to the affected server, service, or process. Correlating metrics speeds up diagnosis so fixes happen faster.
Reducing mean time to recovery (MTTR) minimizes user impact and keeps services available. Quick intervention turns potential downtime into a brief, manageable incident.
Better root cause analysis
Monitoring provides the context you need to understand why an incident occurred. By tracking trends and correlating metrics across servers and services, you can identify the underlying problem instead of just treating symptoms.
Knowing the root cause helps prevent recurrence. For instance, a spike in disk I/O might reveal a misconfigured backup job rather than a failing disk. Addressing the true cause increases reliability.
Improved reliability over time
The benefits of monitoring accumulate. Every alert, trend analysis, and post-incident review adds insight. Over time, your team becomes better at predicting issues, tuning thresholds, and optimizing resources.
This proactive approach reduces the frequency and severity of incidents, resulting in more reliable systems and a smoother experience for users.
How uptime monitoring complements server monitoring
Server monitoring gives you a detailed view of your infrastructure’s health, while uptime monitoring shows what your users actually experience.
Together, they provide a complete picture of system performance and reliability.
External, or uptime, monitoring checks your services from outside your network, verifying that your website, API, or application is reachable and functioning as expected. It mimics user interactions and measures availability from multiple locations, providing objective proof of reliability and alerting you to outages before they affect customers.
These external checks catch issues that internal monitoring alone might miss, such as DNS misconfigurations, SSL certificate failures, CDN outages, or regional connectivity problems. Meanwhile, server metrics reveal what’s happening inside your systems.
For example, external uptime monitoring services like UptimeRobot can continuously ping your endpoints or perform HTTP checks, letting you know exactly when a website or API goes down.
When paired with server monitoring, this approach gives your team early warnings and the context needed for faster, more effective incident response.
-
Server monitoring is about tracking known metrics to see if your servers are healthy. It answers “Is my server okay right now?” using metrics like CPU, memory, disk, and uptime.
Observability goes further. It helps you understand why something is happening by collecting logs, traces, and other signals across your systems. Observability is more investigative, while monitoring is about detection. -
Servers should be monitored continuously, but how frequently metrics are collected depends on your needs:
Critical production servers: every 30–60 seconds
Less critical internal systems: every 1–5 minutes
Non-essential servers or historical trend tracking: every 5–15 minutes
Frequent checks catch issues faster, but too many can overwhelm your monitoring system. Balance is key.
-
Yes, even small websites benefit from monitoring. Downtime, slow performance, or resource spikes can affect user experience and reputation, regardless of site size.
External uptime checks can catch outages quickly.
Basic server metrics like CPU, memory, and disk space help prevent small problems from escalating.
Monitoring scales with complexity. Small sites may not need extensive observability, but even basic monitoring reduces risk. -
Server monitoring itself does not prevent all outages, but it helps stop problems before they affect users:
Detects early warning signs like rising CPU or memory usage.
Alerts your team to fix issues before they escalate.
Provides context for faster mitigation when something fails.
The result is fewer outages, shorter downtime, and more reliable systems.
-
Start with metrics that indicate real risk and potential outages:
CPU and load: sustained high load, not short spikes
Memory and swap: low available memory or increasing swap usage
Disk space: nearing full capacity
Service health: critical processes stopping or failing
Network: connection failures, packet loss, or high latency
Once these are stable, you can expand to less urgent metrics, like minor performance trends or less critical services.