Every system fails sometimes. What matters is how your team responds and learns from it. A clear, blameless post-mortem template helps you turn incidents into lasting improvements instead of repeated mistakes.
Our guide walks you through how to write better post-mortems and gives you practical templates for incidents, projects, and status pages. You’ll see how to structure your findings, keep discussions focused on learning, not blame, and track whether your fixes actually work.
Key takeaways
- Post-mortems turn failures into structured learning
- Templates keep reports consistent and actionable
- Run reviews within 24-72 hours of an incident
- Track metrics like MTTD, MTTR, and SLO breaches to measure progress
- Assign owners and deadlines for every follow-up
What is a post-mortem template?
In IT and DevOps, a post-mortem template (also known as an incident post-mortem) is a structured document used to review and analyze an outage, system failure, or major incident.
The purpose is to understand what happened, why it happened, and how to prevent it from happening again.
A well-designed template ensures every incident review follows a consistent format, making it easier to identify patterns, share lessons, and track improvements over time.
Typically, a post-mortem template includes:
- Detailed timeline of events
- Root cause analysis
- Impact assessment
- Mitigation steps taken
- Learning and risks
- Specific, actionable follow-up items
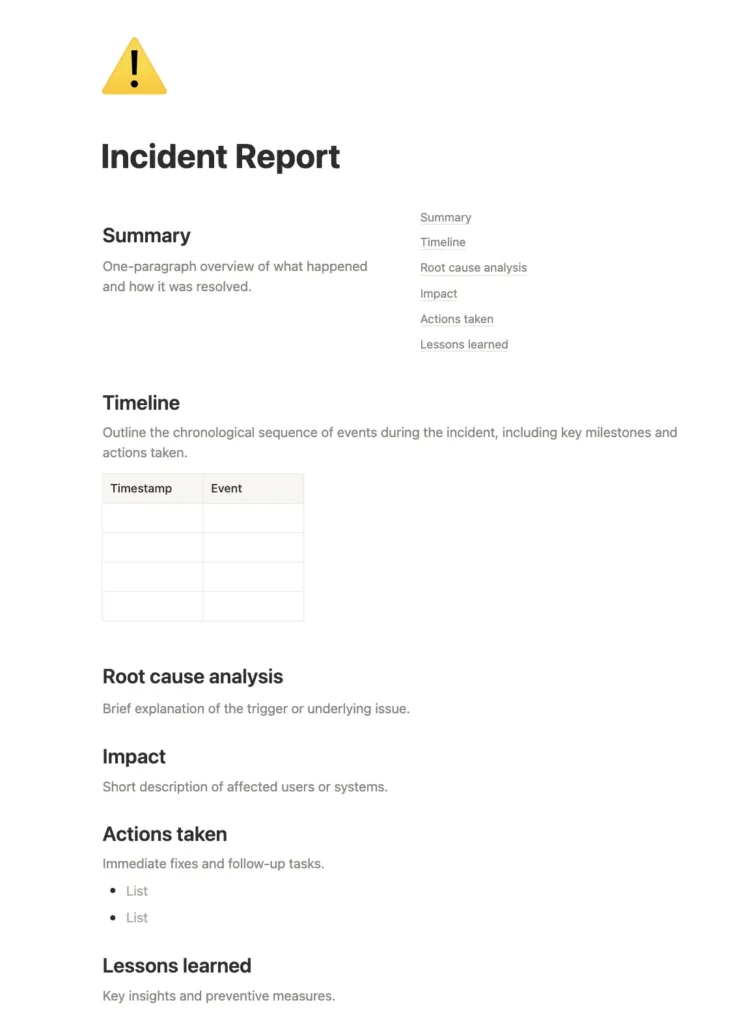
Here is a sample post-mortem template by Notion that you can use.

Post-mortem vs. retrospective vs. incident review
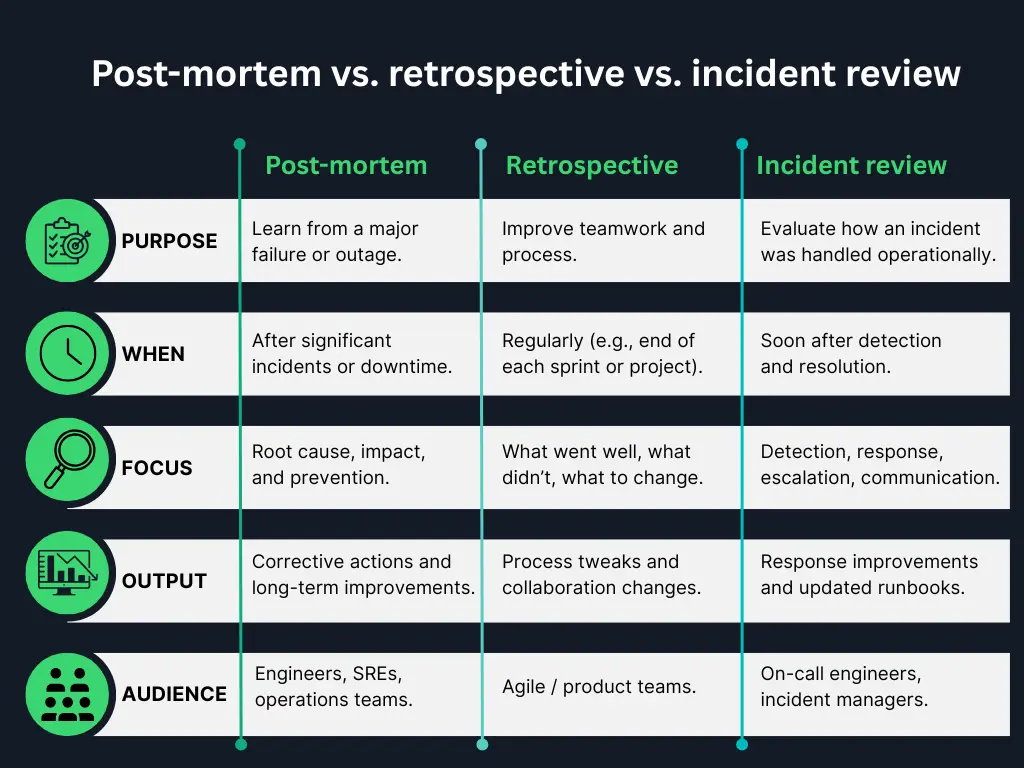
While these terms are often used interchangeably, there are subtle differences:
Post-mortem:
Focuses on a specific failure or outage. Common in IT, SRE, and DevOps environments. The goal is to document root causes and corrective actions.
Retrospective:
Broader in scope and cadence. Common in Agile teams, it’s a recurring meeting (e.g., every sprint) to improve team processes and collaboration.
Incident review:
Similar to a post-mortem, but may be more operational in nature. It usually occurs soon after an incident to analyse response performance and identify mitigation steps.
Think of it this way: All post-mortems are incident reviews, but not all incident reviews are full post-mortems.
Why teams need post-mortems
Post-mortems are at the core of reliability engineering and directly support your service commitments, such as SLAs (Service Level Agreements) and SLOs (Service Level Objectives). SLAs are external commitments made to customers, while SLOs are internal performance targets. Understanding the difference helps teams decide when to run a post-mortem.
When teams investigate the root cause of downtime, document it clearly, and implement preventive actions, they strengthen the system’s resilience over time.
Each well-run post-mortem contributes to:
- More predictable performance
- Greater operational maturity
- Increased customer trust
- Enhanced transparency
- Stronger prevention
- Deeper learning
- Higher uptime
In short, post-mortems are how great teams turn failures into proof of their reliability.
When to run a post-mortem
Post-mortems shouldn’t be reserved only for catastrophic outages. Teams should conduct one after every major incident, typically any event classified as Sev-1 or Sev-2. This applies even if the issue turns out to be less severe, a false alarm, or resolves quickly without intervention. The goal is to learn from every significant signal, not just the biggest failures.
Note: Severity levels can vary across organizations. Some use numeric scales like Sev-0 to Sev-3, while others use terms like Critical, High, or Medium. What matters is having clear internal guidelines for when a post-mortem is required.
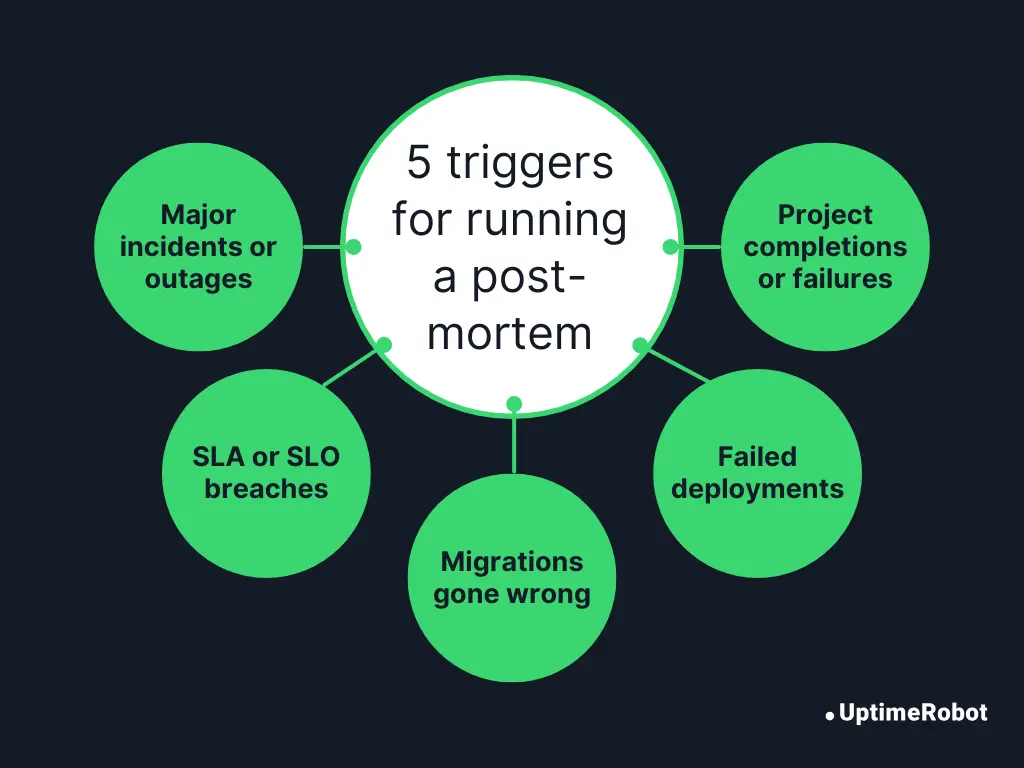
Common triggers for a post-mortem include:
- Major incidents or outages that affect users or revenue.
- SLA or SLO breaches, even if resolved quickly.
- System launches or migrations that lead to unexpected behavior.
- Critical deployment or performance failures.
- Project completions or failures that offer meaningful insights for future work.
Tip: Run post-mortems while details are still fresh, ideally within a few days of incident resolution.
Blameless post mortems: creating a safe space
A truly effective post-mortem focuses on what went wrong, not who went wrong. When teams embrace a blameless approach, post-mortems become powerful tools for growth, enabling people to share openly, learn deeply, and improve continuously.
Psychological safety is the foundation of this culture. It gives team members the confidence to speak up without fear of embarrassment or blame. When people feel safe, they’re far more likely to:
- Report incidents early.
- Admit what they missed.
- Share detailed context that helps uncover real root causes.
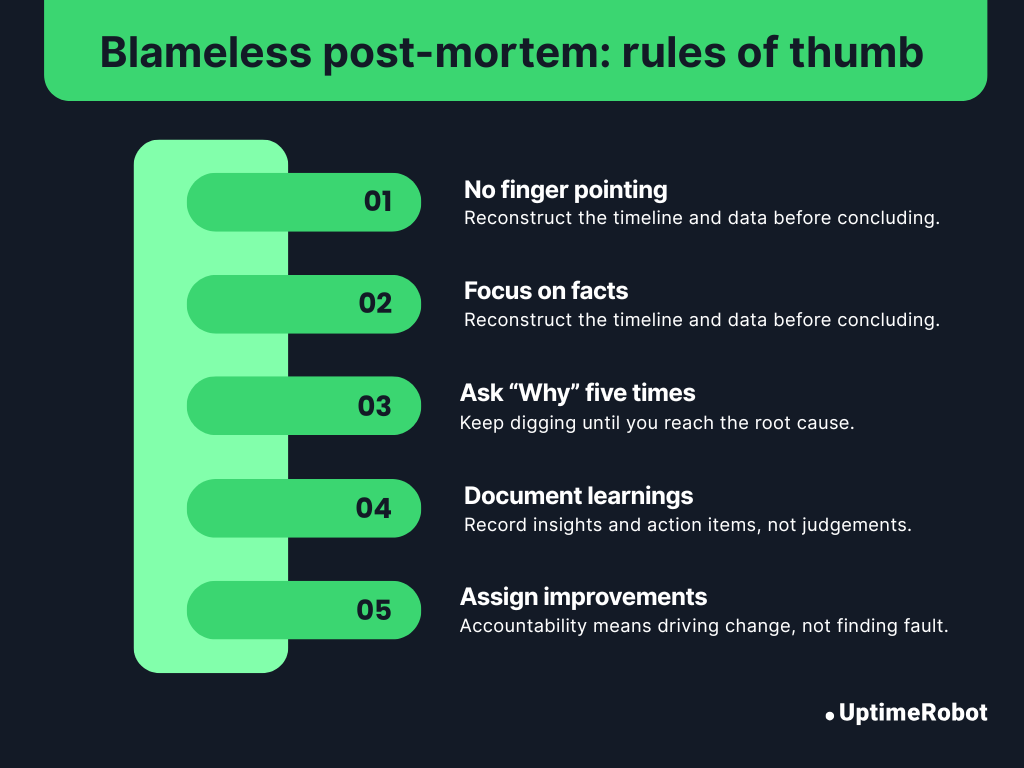
For a blameless post-mortem, establish a few ground rules before every discussion to keep it constructive and objective.
- No finger-pointing: Everyone did their best with the information they had at the time.
- Focus on facts, not opinions: Reconstruct the timeline and data before concluding.
- Ask “why” five times: Keep digging until you reach systemic or process-level causes.
- Document learnings, not judgments: The output should be insights and action items, not blame notes.
- Assign owners for improvements, not guilt: Accountability means driving change, not finding fault.
Core structure of a post-mortem template
An effective post-mortem captures facts, insights, and actions in a clear, structured document that anyone in the organization can understand later.
Below is the post-mortem structure followed by most high-performing teams.
Mandatory sections
These sections form the backbone of every post-mortem report. They ensure consistency and make analysis straightforward across incidents.
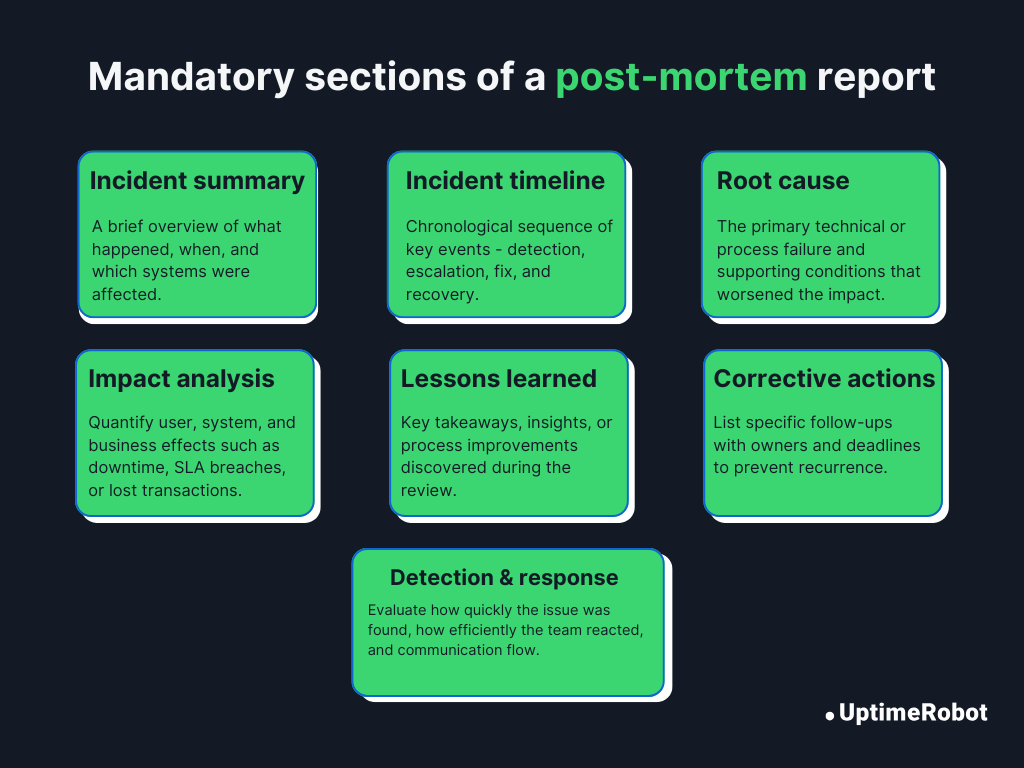
1. Incident summary
Begin the report with a short, plain-language description of what happened. Include:
- When the incident started and ended
- What services or components were affected
- A one-line summary of the impact
2. Incident timeline
Create a chronological record of key events from detection to full recovery. Include timestamps for:
- Alert detection
- Impact start
- Fix applied
- Incident closed
This helps identify delays or communication gaps in response.
3. Root cause & contributing factors
Explain the underlying technical or process-related causes. Break it down into:
- Primary root cause: The main trigger or failure point
- Contributing factors: Conditions that worsened the impact (such as missing alerts, miscommunication, config drift)
Keep this section factual and supported by evidence.
4. Impact
Quantify how the incident affected your systems and stakeholders. Consider:
- Number or percentage of users impacted
- Duration of degraded service
- Estimated revenue loss or operational cost
- SLA or SLO violations
5. Detection & response effectiveness
Evaluate how well monitoring, alerting, and incident response worked. Ask questions like:
- Was the issue detected automatically or by users?
- Were alerts clear and actionable?
- Did escalation paths and on-call rotations work as intended?
The aim is to improve detection speed and response efficiency.
6. Corrective actions
List all follow-up tasks to prevent recurrence. Each action should have:
- A clear description
- An assigned owner
- A due date
Tracking these items publicly ensures accountability and follow-through.
7. Lessons learned
Summarize key takeaways, both technical and organizational. Examples:
- “Load testing should include dependency failures.”
- “We need better cross-team alert visibility.”
Want to see how other teams design their templates?
Explore this collection of post-mortem templates on GitHub for real examples you can adapt.
Optional modules
You can include these additional sections to provide extra depth and context, especially for mature teams or regulated environments.
- Stakeholder feedback: Capture feedback from support, product, or affected customers.
- Financial cost estimation: Estimate direct and indirect costs of the incident.
- Compliance / regulatory notes: Record reporting requirements, audits, or data protection implications.
- Cross-team dependencies: Identify which systems or teams were involved and how their workflows intersected.
- Communication log: Archive all public and internal updates, such as status page messages, customer emails, and incident Slack threads.
Post mortem template variants (downloadable)
The best teams tailor their post-mortems to the scale and impact of the event. Here are five ready-to-use variants you can adapt or download based on your needs.
1. Lightweight one-pager (for small issues)
Best for: Small issues, near-misses, or incidents resolved quickly without major impact.
Purpose: Capture essential insights fast while keeping documentation lean and actionable.
Sections:
- Summary: One-paragraph overview of what happened and how it was resolved.
- Timeline: Key timestamps – detection, mitigation, and resolution.
- Root cause: Brief explanation of the trigger or underlying issue.
- Impact: Short description of affected users or systems.
- Actions taken: Immediate fixes and follow-up tasks.
- Lessons learned: Key insights and preventive measures.
Ideal for teams running frequent deploys who want continuous learning without heavy documentation overhead.
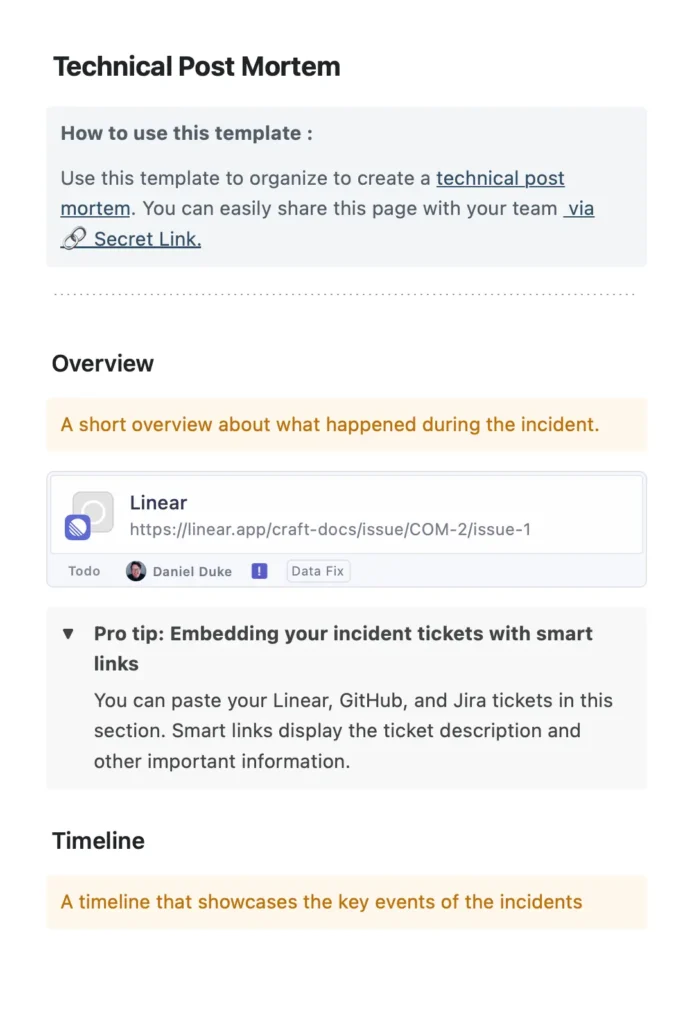
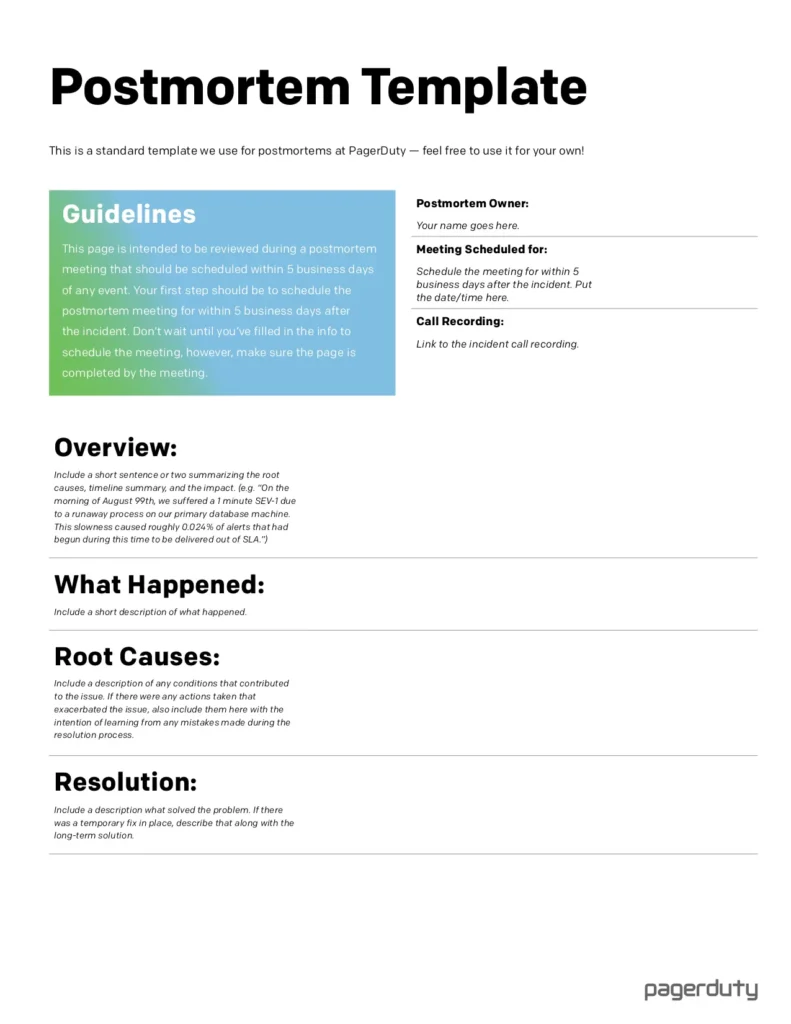
2. Incident post-mortem (for outages or downtime)
Best for: Major service disruptions, SLA/SLO breaches, or widespread downtime.
Purpose: Provide a full operational analysis with clear, traceable action items.
Sections:
- Incident overview: A summary of what happened.
- Incident timeline: Key events from detection to full resolution.
- Detection: How and when the issue was identified.
- Root cause: The primary technical or process failure.
- Impact: Scope of affected users, systems, or revenue.
- Resolution steps: Actions taken to restore normal operations.
- Corrective actions: Preventive measures with assigned owners and deadlines.
- Lessons learned: Key takeaways and improvement opportunities.
- Optional: Stakeholder feedback, financial cost analysis, and communication log.
Tip: Use this as your default DevOps/SRE post-mortem template for major incidents.
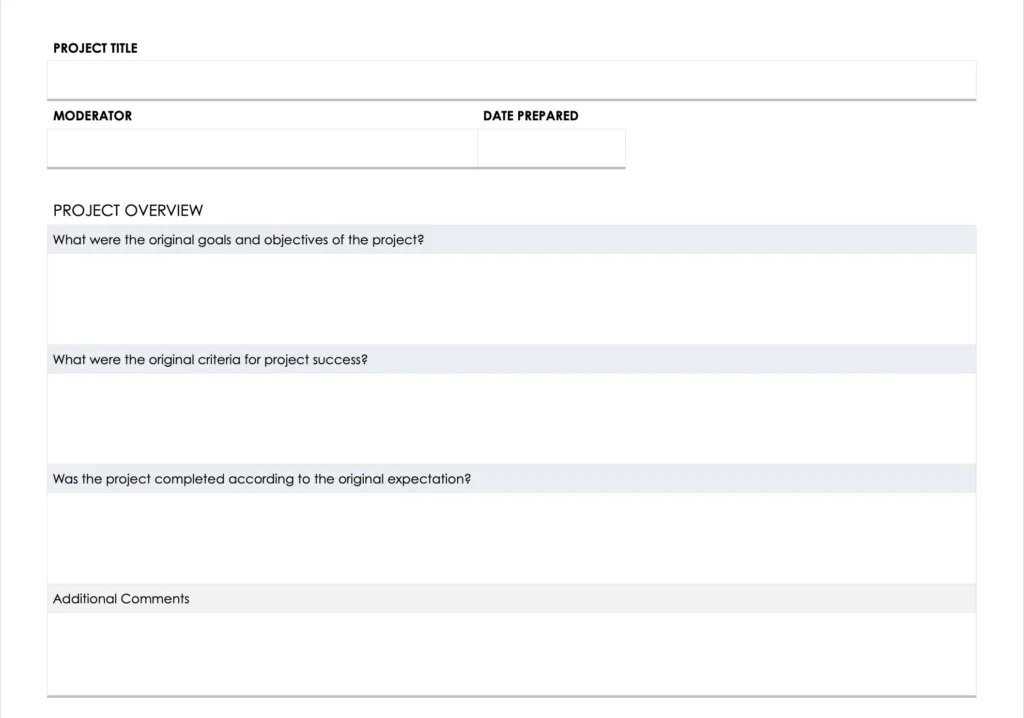
3. Project launch post-mortem (for product or feature releases)
Best for: Product launches, migrations, or major code releases.
Purpose: Evaluate planning, execution, and user outcomes to improve future launches.
Sections:
- Project overview: Compare original goals with actual results and outcomes.
- Challenges: Identify what went wrong, what needs improvement, and how to address those gaps.
- Highlights: Capture key successes, accomplishments, and what worked well.
- Post-project tasks: List remaining action items, follow-up work, and future considerations.
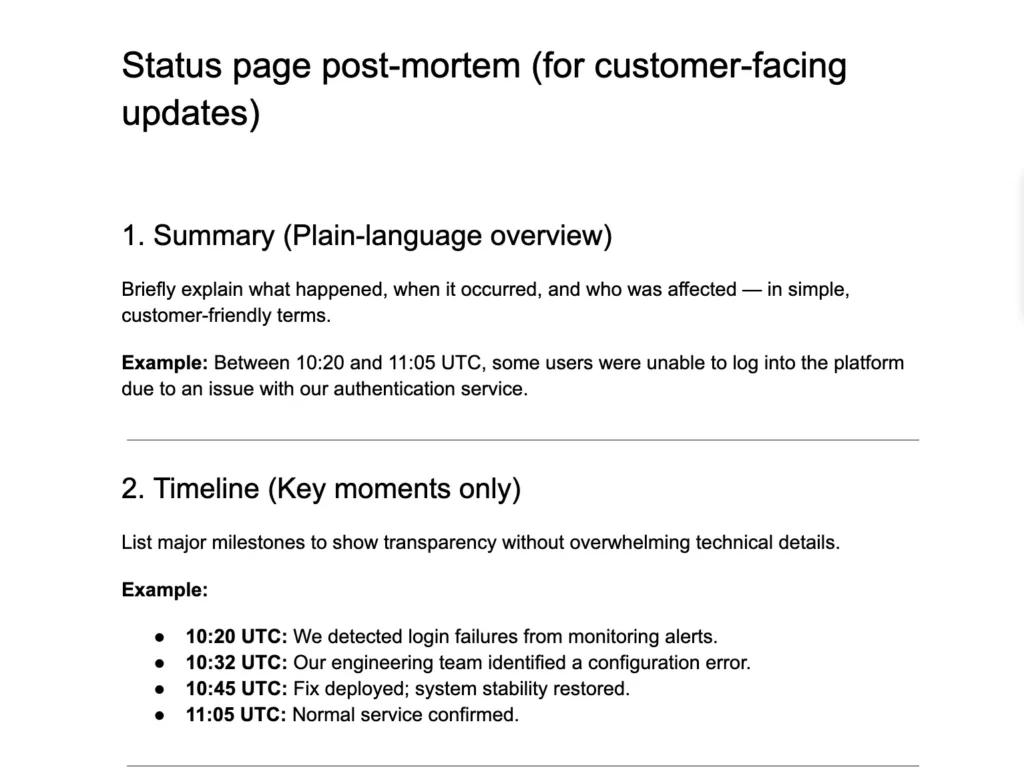
4. Status page post-mortem (for customer-facing updates)
Best for: Public SaaS or platform incidents where transparency and trust are essential.
Purpose: Translate internal post-mortem findings into a clear, non-technical explanation for customers.
Sections:
- Summary: A plain-language overview of what happened and who was affected.
- Timeline: Key moments from detection to full recovery.
- Root cause: A brief, non-technical explanation of why the issue occurred.
- Resolution and prevention: What was done to fix the problem and prevent recurrence?
- Customer message: A thank-you note that reinforces transparency and rebuilds trust.
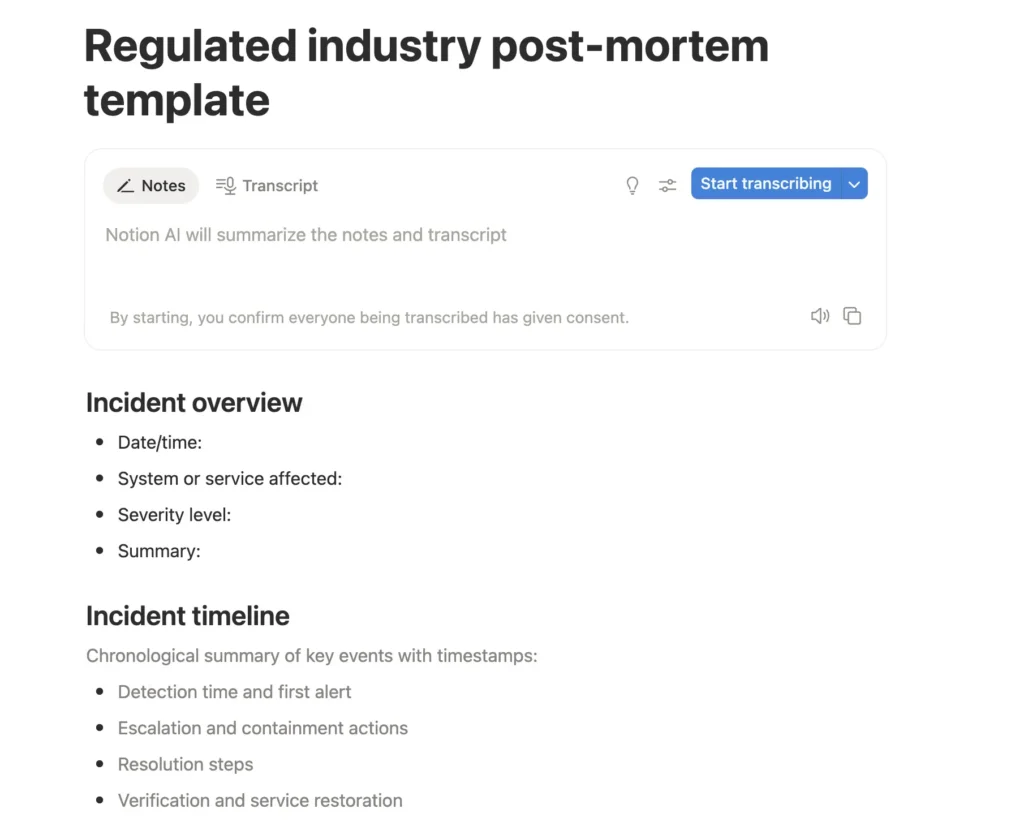
5. Regulated industry variant (with compliance section)
Best for: FinTech, healthcare, transportation, or other data-sensitive operations.
Purpose: Align post-mortems with audit, legal, and regulatory expectations, ensuring full traceability and accountability.
Extra sections:
- Compliance / regulatory notes (required notifications, data impact)
- Evidence log (system snapshots, access reports)
- Audit trail for corrective action completion
- Risk re-assessment summary
Track uptime with UptimeRobot, and make post-mortems easier with real data.
Real example: a status page post mortem in action
Let’s get hands-on with creating a post-mortem report. We’ll walk through a fictional 30-minute API outage and go step by step through the entire process, from incident summary and timeline to root cause, impact, and corrective actions.
Step 1: Incident summary
What to include:
- Brief description of what happened.
- Duration of the impact.
- Affected services or components.
- High-level impact on users or customers.
Example:
Between 10:36 and 11:06 CET, the user authentication API was unavailable due to a load balancer misconfiguration introduced during a routine deployment. The outage caused authentication failures for roughly 45% of active sessions, preventing users from logging in or completing transactions.
Step 2: Incident timeline (detection → resolution)
A detailed, timestamped timeline helps reconstruct what happened, how quickly the issue was detected, and how effectively the team responded.
Example timeline:
| Time (CET) | Event | Details/notes |
| 10:36 | Alert triggered | The monitoring system detects a sudden spike in 5xx errors on the user authentication API. |
| 10:38 | On-call engineer acknowledges alert | Begins investigating application logs and load balancer metrics. |
| 10:46 | Issue escalated to the platform team | Initial suspicion of backend failure ruled out; focus shifts to networking and routing. |
| 10:47 | Root cause identified | Load balancer misconfiguration during the last deployment caused traffic misrouting. |
| 10:50 | Rollback initiated | Configuration restored to previous working state. |
| 11:00 | Monitoring confirms recovery | API error rate drops to normal; users begin to re-authenticate successfully. |
| 11:06 | Incident closed | Service stable for 5+ minutes; post-mortem scheduled for review within 48 hours. |
Pro tip:
- Include only key events that influenced detection, diagnosis, and recovery.
- Capture both system events (alerts, rollbacks) and human actions (escalations, decisions).
- Keep it factual, time-based, and free of assumptions.
Step 3: Root cause & contributing factors
This section explains why the incident happened. It focuses on the underlying technical and process-related causes that allowed it to occur.
Example:
Primary root cause: A misconfigured load balancer rule introduced during a deployment caused API traffic to be routed to an invalid upstream target. As a result, authentication requests failed between 10:36 and 11:06 UTC, returning 5xx errors to end users.
Contributing factors:
- The deployment pipeline did not include automated validation of load balancer configurations before release.
- Health checks verified TCP connectivity but did not validate full HTTP responses, so the service appeared “up” despite functional errors.
- The configuration change was merged under a time-sensitive update and skipped secondary peer review.
- Multiple unrelated alerts were firing simultaneously, delaying recognition of the core issue.
Step 4: Impact assessment
This section captures the scope and severity of the incident. Who and what was affected, how long the disruption lasted, and whether it breached any service-level commitments.
Example:
Duration: 30 minutes (10:36–11:06 UTC)
Affected systems:
- User Authentication API
- Dependent login and session management services
User impact:
- Approximately 45% of active users were unable to log in or access their accounts.
- Around 18,000 failed authentication attempts were recorded during the outage.
Business impact:
- An estimated 1,200 incomplete transactions occurred during the downtime.
- Minor increase in support tickets and customer complaints.
Step 5: Detection & response effectiveness
This step analyzes how quickly the issue was detected, how efficiently the team responded, and how communication flowed during the incident. It helps you identify what worked well and where your incident management process can improve.
Example:
- Detection: Monitoring (Datadog) alerted the team within 1 minute of failures. Alerts worked well, though notifications reached Slack with a short delay.
- Response: On-call engineer acknowledged within 2 minutes, escalated to the platform team at 6 minutes, and resolution began shortly after root cause identification.
- Communication: Internal updates were shared promptly, but the status page update lagged by 8 minutes after recovery.
Step 6: Corrective actions (with owners & deadlines)
This section lists the specific steps your team will take to prevent similar incidents and improve system resilience. Each action should have a clear owner and completion date.
| Action items | Owner | Deadline | Status |
| Add automated validation for load balancer configurations before deployment | DevOps Lead | Feb 10 | In Progress |
| Improve health checks to verify full HTTP responses, not just TCP connectivity | SRE Team | Feb 15 | Planned |
| Enable automated status page updates upon recovery confirmation | Platform Team | Feb 20 | Planned |
| Review alert routing and remove redundant rules causing notification delays | On-Call Rotation Lead | Feb 25 | Completed |
Step 7: Lessons learned
Summarize the key insights your team gained from the incident. This section focuses on what worked, what didn’t, and how to improve future responses.
Example:
- Early detection matters: Quick alerting minimises downtime.
- Automation gaps: Manual status page updates and load balancer checks slowed recovery; both need automation.
- Peer review saves time: Skipping secondary review for “minor” config changes increases risk.
- Post-mortem discipline: A structured, blameless review helped surface honest feedback and actionable improvements.
Step 8: Sample status page update text
Title: Partial API outage – authentication service
Timeframe: 10:36-11:06 UTC
Summary: Between 10:36 and 11:06 UTC, users experienced intermittent authentication failures when accessing our API. The issue was caused by a configuration error in a load balancer introduced during a routine deployment.
Impact: Some users were unable to log in or complete transactions during this period. All services were restored by 11:06 UTC.
Resolution: The configuration was rolled back to a stable version, and additional validation checks will be added to prevent similar issues in the future.
Next Steps: We are improving our deployment validation and automating health checks for our authentication systems.
Status: Resolved. Monitoring confirms stability.
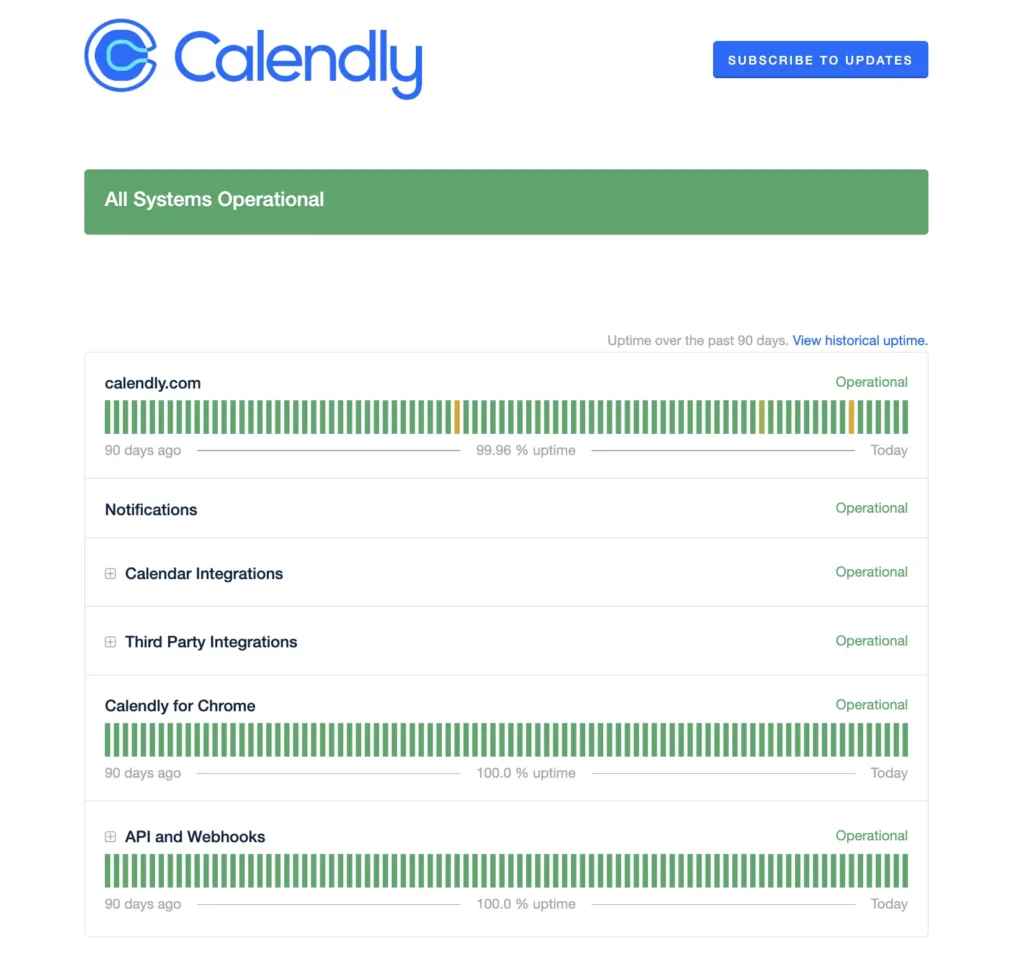
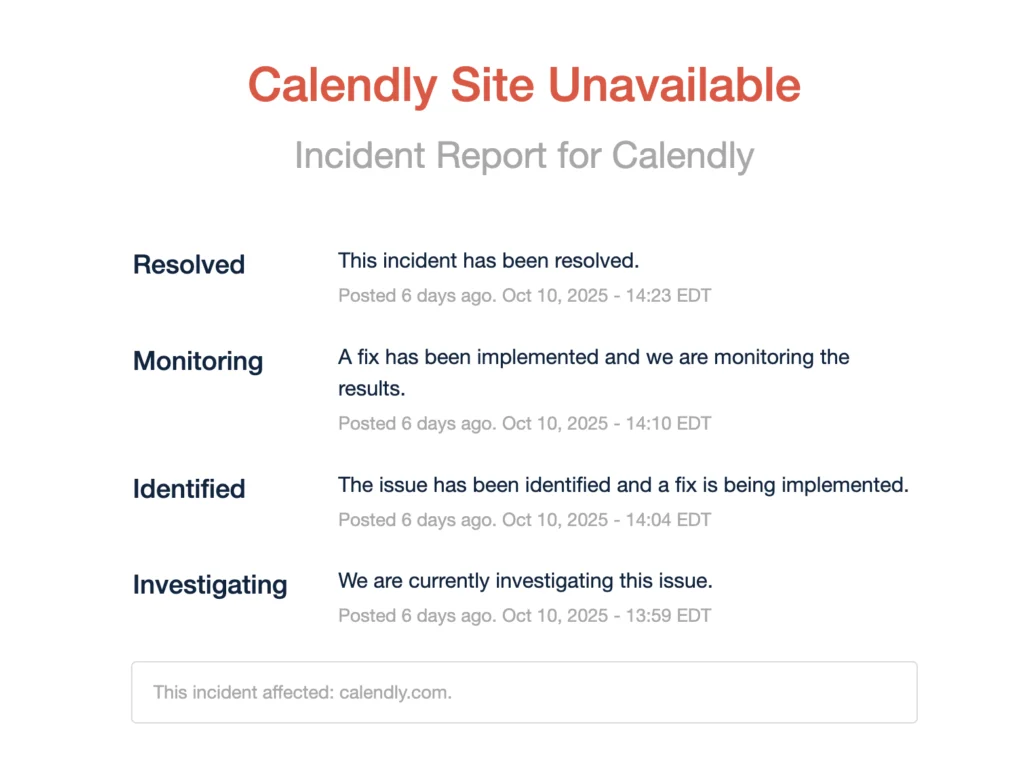
| Need more status page inspiration? Explore how different teams handle outage communication and post-mortems: Slack Better Stack Monday.com Calendly Notion |
How to run a post-mortem meeting
A post-mortem meeting is for teams to review what went well, what went wrong, and what can be improved for future work. We’ll explore the key dos and don’ts that make a post-mortem meeting productive, honest, and action-oriented.
When to schedule it?
Timing matters. Hold the post-mortem within 24-72 hours after the incident is resolved.
- Too soon, and participants may still be reeling from the aftermath or emotionally charged.
- Too late, and key details or context may fade.
Who to invite?
The post-mortem should include everyone who can shed light on what happened and how to improve next time:
- On-call engineers and responders who handled the incident.
- Service owners or SREs responsible for affected systems.
- Product managers or project leads who can assess business impact.
- Customer support or communications representatives to share external feedback.
Optional: a neutral facilitator or team lead to guide the discussion.
Tip: Check out our blog on running a great post-mortem meeting to learn more.
Agenda template (timeboxed)
A well-structured agenda keeps the post-mortem meeting focused, efficient, and outcome-driven. Here’s a sample 60-minute format with clear objectives for each segment:
| Task/segment | Duration | Agenda/objective |
| Introduction | 5 mins | Set the tone. Review the meeting agenda and clarify expected outcomes. |
| Incident recap | 10 mins | Provide a concise summary of what happened, when it occurred, and its overall impact. |
| Timeline review | 10 mins | Walk through the sequence of events from detection to resolution. Identify key decision points, escalation paths, and any delays. |
| Root cause discussion | 10 mins | Analyze the primary cause and contributing factors supported by data.Focus on system and process issues. |
| Response effectiveness | 10 mins | Evaluate how well detection, escalation, communication, and coordination worked during the incident. Identify areas for improvement. |
| Action items & lessons learned | 10 mins | Define specific follow-up tasks with owners and deadlines. Capture insights and process improvements for documentation. |
| Wrap-up | 5 mins | Confirm accountability, next steps, and follow-up timelines. End on a positive note, acknowledging the team’s effort and transparency. |
Tip: If the incident was complex or cross-functional, extend the meeting to 90 minutes, but never skip the structure. A clear agenda ensures every participant leaves knowing what was learned and what will change next time.
Facilitator best practices
A good facilitator keeps the discussion structured, neutral, and constructive. Someone who understands that their role is to guide the team toward clarity and learning, not control the conversation.
Best practices include:
- Set the tone early: Remind everyone it’s a blameless, learning-focused space.
- Keep it factual: Redirect emotional or speculative comments toward evidence and data.
- Encourage quieter voices: Ensure balanced participation so all perspectives are heard.
- Stay time-aware: Park unrelated issues to address later and keep the meeting on track.
- Summarize decisions: Reiterate key takeaways, assigned actions, and owners before closing.
Remote vs. in-person post-mortems
Both remote and in-person post-mortems can be effective; what matters most is creating a setting where people feel safe, heard, and focused on learning.
Remote post-mortems
Best for: Distributed or hybrid teams.
Tips for success:
- Use a shared document or template visible to everyone during the meeting.
- Screen-share timelines, dashboards, or monitoring graphs in real time.
- Keep video on wherever possible. Visual cues help engagement.
- Assign a separate note-taker to capture key points.
- Record the session for future reference and transparency.
In-person post-mortems
Best for: Co-located teams or high-impact incidents that need deeper discussion.
Tips for success:
- Use a whiteboard or printed incident timeline for visualization.
- Keep laptops open only for note-taking.
- Maintain eye contact during discussion.
- End by summarizing decisions and next steps in a shared digital document to ensure alignment with remote colleagues.
Metrics & validation: did the fix work?
A post-mortem isn’t truly complete until the fix is validated. Tracking key metrics over time helps teams confirm whether changes made after an incident are delivering the intended results.
Key metrics to track
Tracking the right metrics is key to future success.
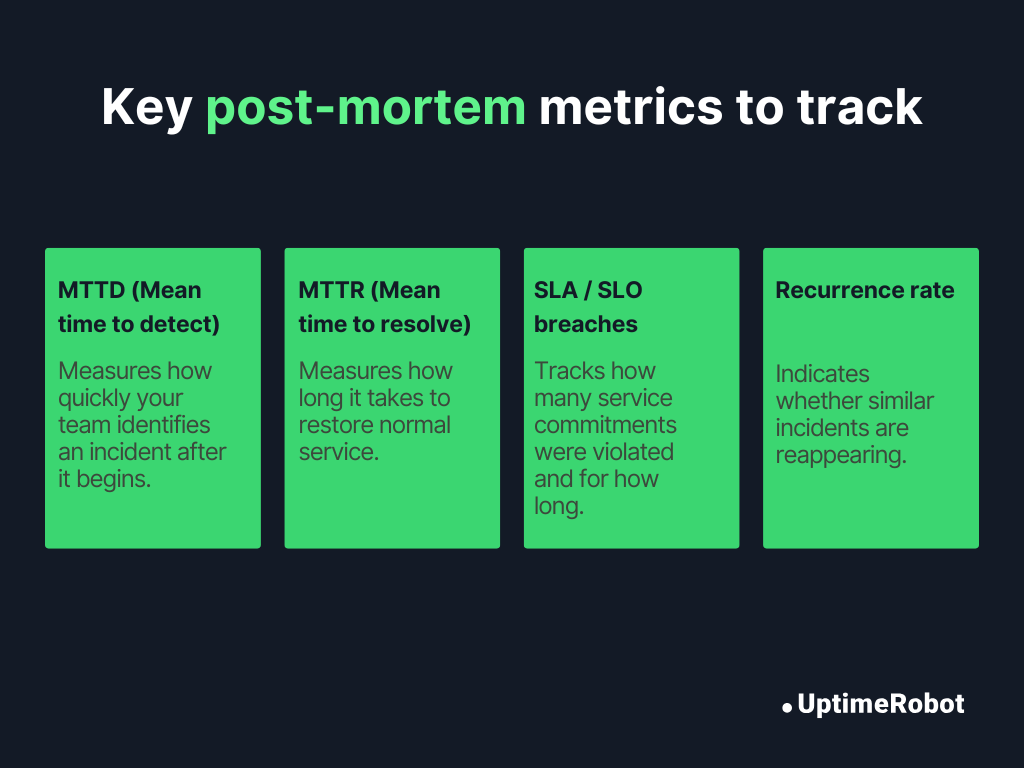
1. MTTD (Mean time to detect):
What it measures: How quickly your team identifies an incident after it begins. Lower MTTD means better monitoring and faster alert response.
How to calculate:
| MTTD = Sum of detection times for all incidents ÷ Number of incidents |
(Detection time = Detection timestamp – Incident start time)
2. MTTR (Mean time to resolve):
What it measures: How long it takes to restore normal service once an incident is detected. Shorter MTTR means faster recovery and better coordination.
How to calculate:
| MTTR = Sum of resolution times for all incidents ÷ Number of incidents |
(Resolution time = Resolution timestamp – Detection timestamp)
3. SLA / SLO breaches:
What it measures: How often your service commitments are violated and for how long. Frequent breaches indicate systemic issues or under-provisioned infrastructure.
How to calculate:
| Availability = 1 – (Total downtime ÷ Total time window) |
If Availability < SLA/SLO target, it counts as a breach.
Example: 99.9% uptime target over 30 days allows 43.2 minutes of downtime.
4. Recurrence rate:
What it measures: How often similar incidents reappear within a given period. A high recurrence rate shows preventive actions aren’t fully effective.
How to calculate:
| Recurrence rate = Number of repeated incidents ÷ Total number of incidents |
(You can calculate per root cause or service to identify chronic problem areas.)
When tracking recurrence rate, some teams define recurrence within a specific time window (e.g., the same root cause occurring within 90 days) rather than across the full history of incidents. Choose a time-based definition that fits your operational context.
Setting follow-ups: 30 / 60 / 90-day check-ins
A post-mortem shouldn’t end when the meeting does. Schedule follow-up reviews to make sure action items are completed and effective. These checkpoints show whether your fixes are actually improving reliability over time.
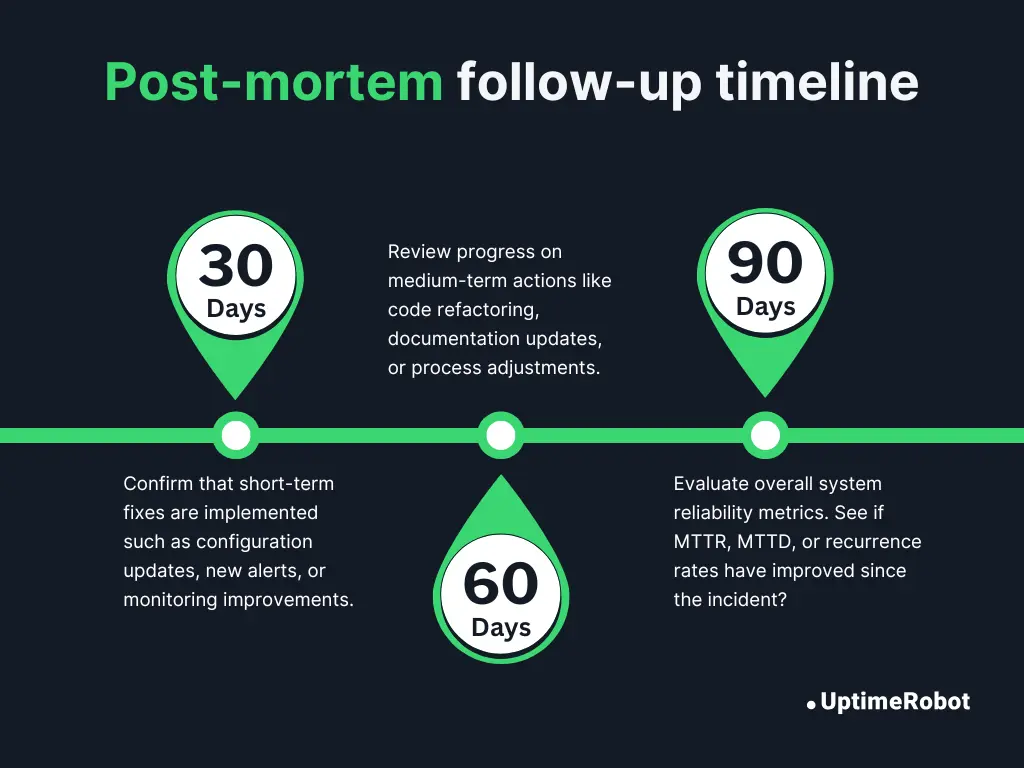
30 days:
Confirm that short-term fixes are implemented, such as configuration updates, new alerts, or monitoring improvements.
60 days:
Review progress on medium-term actions like code refactoring, documentation updates, or process adjustments.
90 days:
Evaluate overall system reliability metrics. See if MTTR, MTTD, or recurrence rates have improved since the incident?
Linking corrective actions to dashboards
To close the feedback loop, integrate post-mortem outcomes with your existing observability or uptime dashboards.
- Tag related incidents or corrective actions in tools like Datadog, Grafana, or PagerDuty to connect fixes with metrics.
- Visualize metrics such as MTTR, MTTD, or SLO compliance before and after implementing corrective actions.
- Highlight measurable improvements during reliability reviews or leadership updates to demonstrate progress and impact.
This makes improvements visible, encourages accountability, and helps teams see tangible proof that learning pays off.
Common pitfalls in post-mortems
Recognizing common pitfalls helps you avoid turning a learning exercise into a checkbox activity. Here are the most frequent traps and how to steer clear of them:
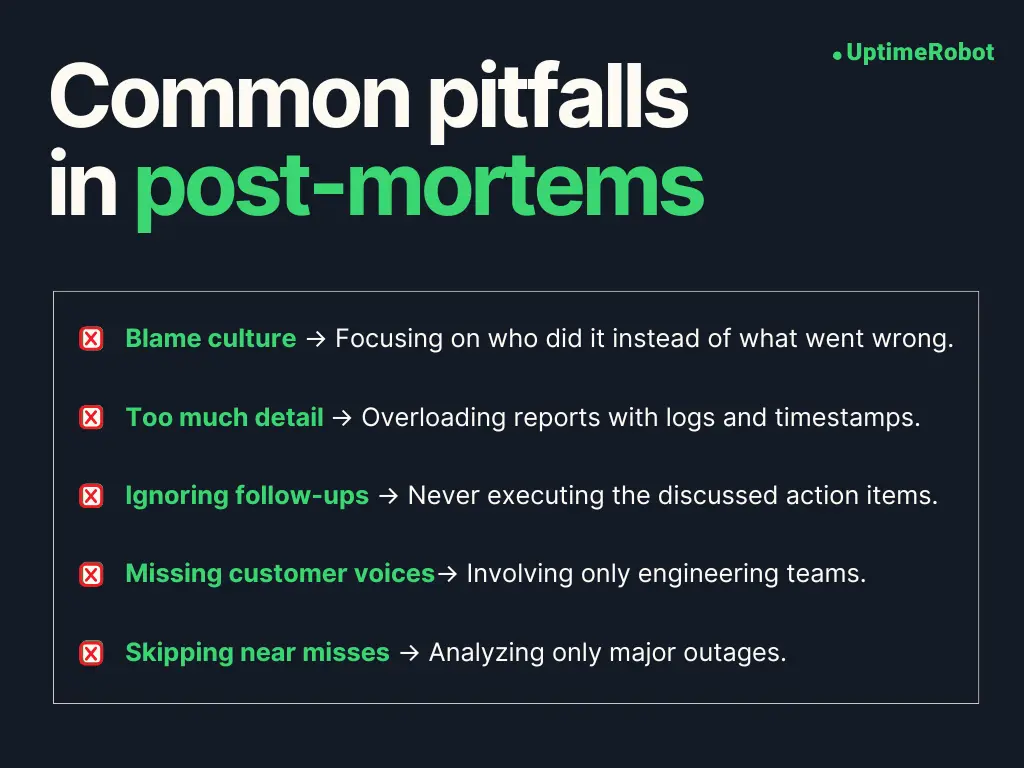
Turning it into a blame session
What happens: The conversation shifts toward who caused the issue instead of what caused it. People become defensive, and valuable details stay hidden.
How to fix: Begin every meeting by reinforcing that the focus is on systems and processes, not individuals. Set the tone early with a reminder: “We’re here to understand, not to assign blame.”
Too much detail or bloated docs
What happens: You want a post-mortem that’s concise yet complete. Avoid turning it into a wall of data by capturing every log line, alert, or timestamp until the report becomes unreadable.
How to fix: Keep documentation clear, concise, and actionable. Capture essential facts (timeline, root cause, actions) and link to deeper technical analysis if needed. The goal is insight, not verbosity.
Ignoring follow-up
What happens: Many teams discuss action items during the meeting, but never follow through. As a result, the same issues resurface months later.
How to fix: Assign clear owners and due dates for every task, and review progress in your next reliability or sprint review. Treat post-mortem actions as first-class work items in your project management tool. Set up 30/60/90-day follow-ups to ensure improvements are completed and validated over time.
Not involving customer-facing teams
What happens: When only engineers are present, teams risk missing valuable external perspectives. Customer support and success teams often know how incidents actually affected users.
How to fix: Involve support, success, or communications teams early. Their feedback adds valuable context on customer experience and trust impact.
Skipping near-misses
What happens: Post-mortems often happen only after major outages, missing valuable lessons from “almost failures.” Teams overlook incidents that nearly caused issues, losing chances to catch early warning signs.
How to fix: Run lightweight post-mortems for near-misses, too. They’re low-stakes opportunities to catch weak signals and improve resilience before a major failure happens.
Tools, integrations & automations
If you’ve ever written a post-mortem by hand, you know how tedious it can be. Automation helps you move faster, stay accurate, and focus on insights instead of admin work.
Pulling logs and alerts into templates
Connect your monitoring, logging, and alerting tools directly to your post-mortem workflow. This integration creates a fact-based narrative without the need to manually dig through every timestamp.
Modern observability platforms such as Datadog, Grafana, New Relic, and Splunk make this easy by allowing you to:
- Export incident logs or alert histories as CSV or JSON files.
- Embed key graphs or screenshots (CPU spikes, latency charts) directly into your post-mortem document.
- Link alerts to the corresponding incident record in your incident management tool (PagerDuty, Opsgenie, Atlassian Opsgenie).
Some platforms, like Datadog and New Relic, can even auto-generate post-mortem reports that let you attach live metrics or dynamic data later.
Automating incident timelines
Rebuilding an incident timeline is one of the most time-consuming parts of any post-mortem. Fortunately, you can automate much of this process using modern tools.
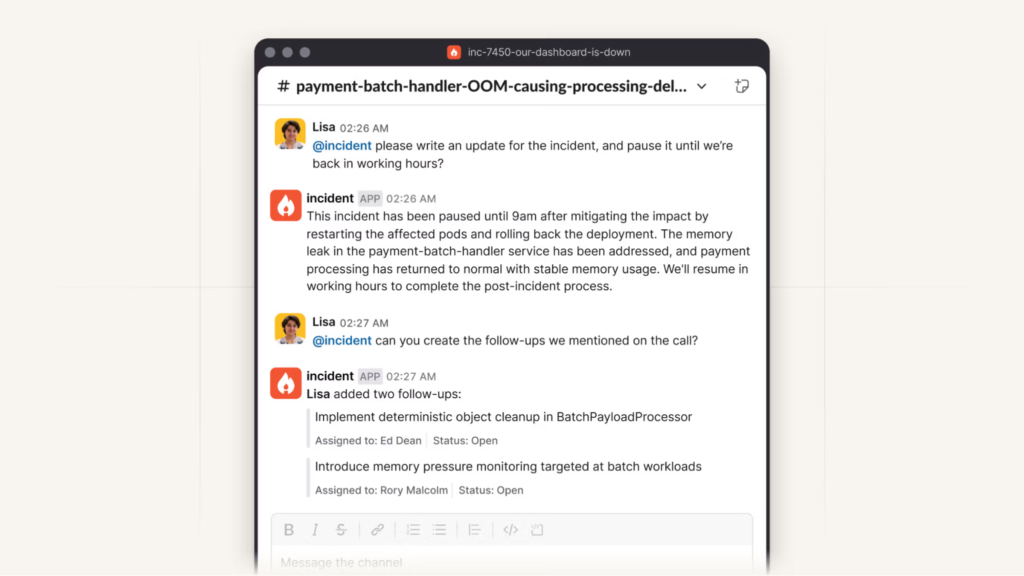
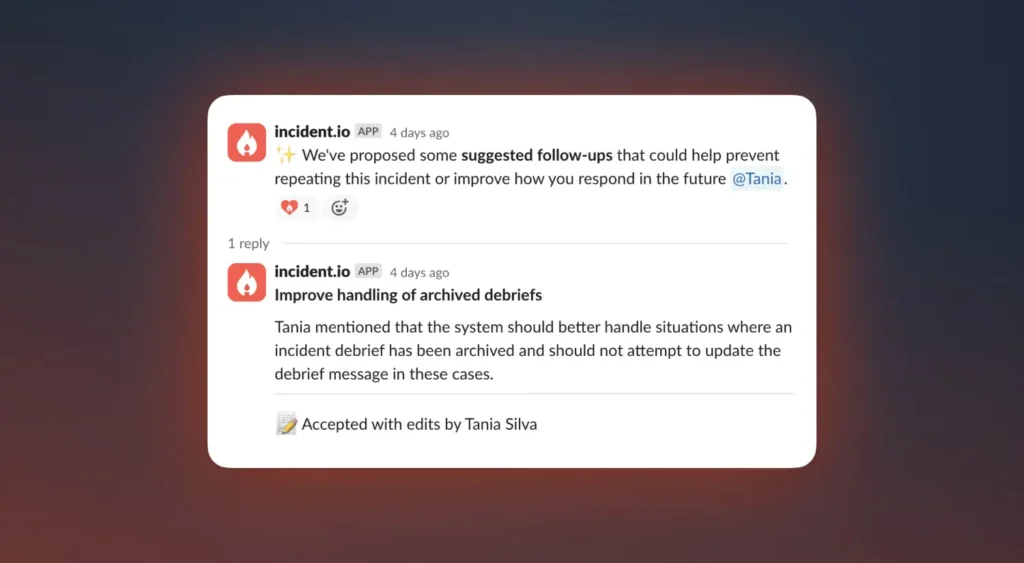
Platforms such as Incident.io, FireHydrant, and Rootly automatically compile key data points from your communication and monitoring systems. They can:
- Aggregate events from Slack, Teams, and alerting tools into a single, chronological view.
- Identify milestones such as detection, escalation, mitigation, and resolution.
- Generate timelines automatically with relevant timestamps, owners, and actions.
You can also integrate chat tools like Slack or Microsoft Teams to automatically capture critical messages, alerts, decisions, and updates, as they occur. Adding AI-driven summarization further helps extract key moments and insights without combing through long chat logs.
Enriching post-mortems with uptime and monitoring data
Integrating uptime monitoring tools, such as UptimeRobot, Better Stack, or StatusCake, adds valuable external visibility to your post-mortems. They help quantify the real-world impact of incidents by providing:
- Exact outage durations and response times.
- Correlation with user-facing downtime to measure true customer impact.
- Data to validate SLA or SLO performance against contractual or internal targets.
By linking these reports directly to your post-mortem template, you can turn static documentation into a living reliability record.
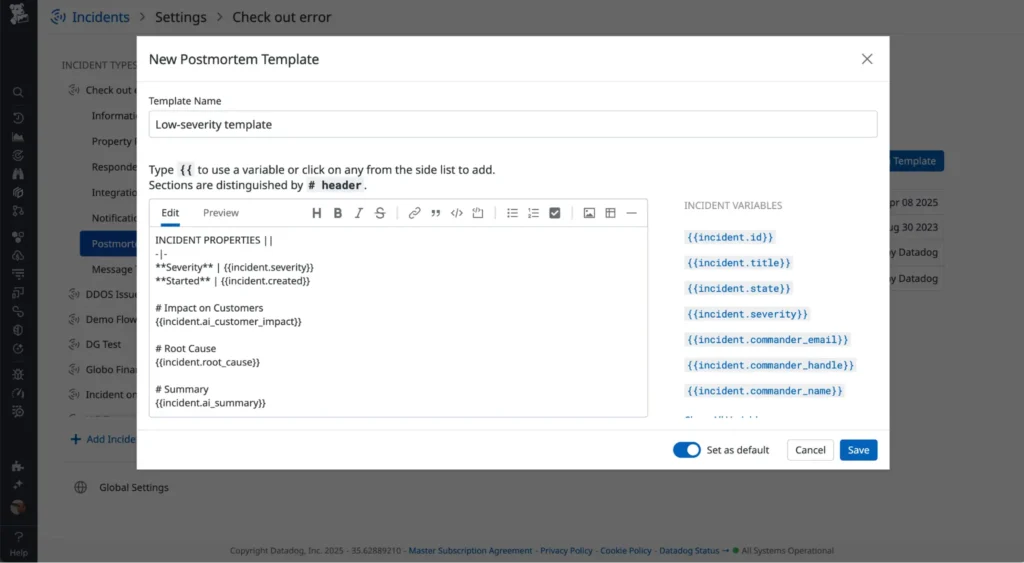
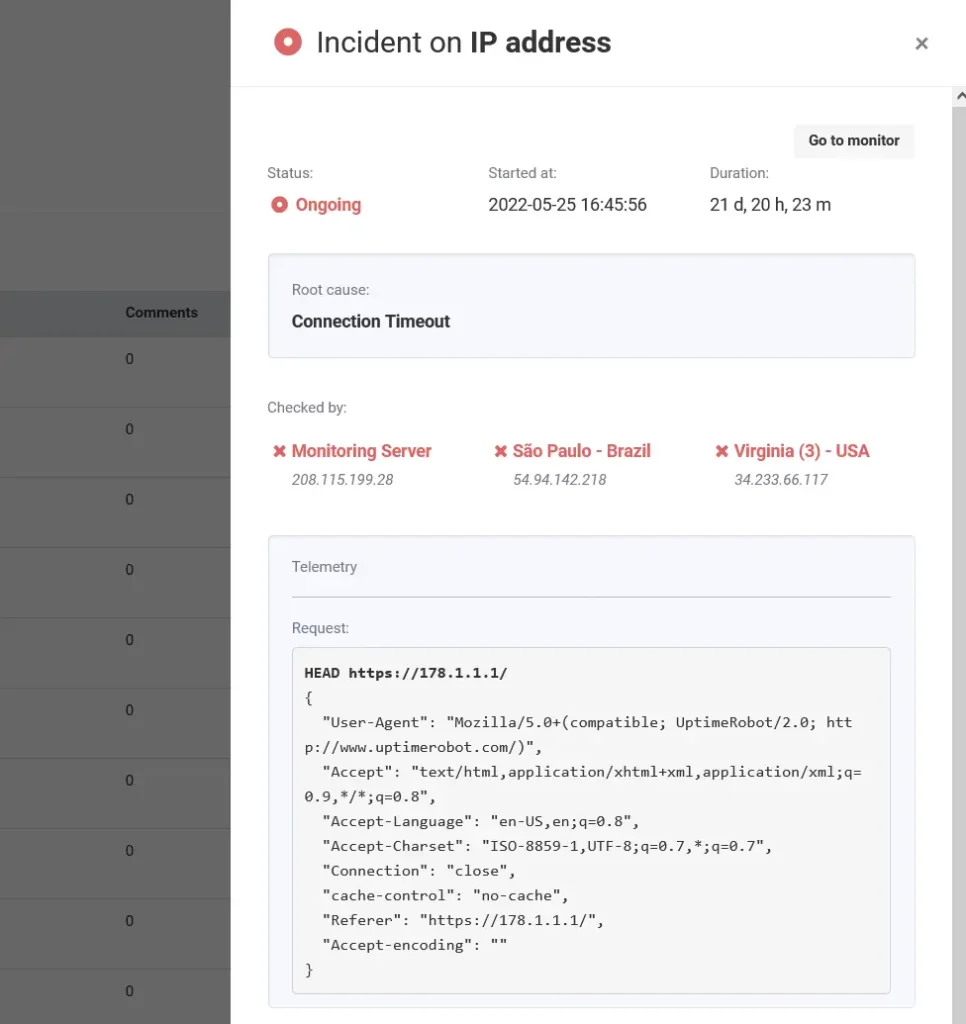
Example: UptimeRobot’s “Incidents” feature is a great example of how uptime monitoring data can make post-mortems more insightful and data-driven. Each incident includes key details like:
- A human-readable cause (SSL error, DNS issue).
- Start time, duration, and HTTP response details.
- Request and response data for the full technical context.
- Option to add post-mortem comments directly in the report.
Closing the loop with integrations
Finally, connect your post-mortem outputs to your project management tools such as Jira, Linear, or ClickUp so your corrective actions turn into real progress.
- Automatically create follow-up tickets from action items.
- Track completion rates and link them to reliability dashboards.
- Review improvement trends during quarterly reliability reviews.
FAQ's
-
A Post-Mortem is the full process of reviewing an incident. It includes documenting what happened, analyzing causes, and assigning corrective actions.
An RCA (Root Cause Analysis) is one part of that process, focused specifically on identifying the underlying technical or process failures.
RCA = the “why”; Post-Mortem = the “what, why, and what next.”
-
A post-mortem should be scheduled within 24-72 hours after the incident is resolved. That’s soon enough for details to still be fresh, but allows time for systems and people to stabilize. For major outages, consider scheduling an initial quick review within 24 hours, followed by a deeper post-mortem a few days later.
-
It depends on your organization’s culture and the sensitivity of the incident.
- Private post-mortems are common for operational transparency across teams.
- Public post-mortems (used by companies like Google, Cloudflare, or GitHub) build customer trust, but should be carefully written to protect sensitive data.
-
It’s rare to have every fact right away. Logs might be missing, timelines incomplete, or systems still recovering. Document what you know, clearly mark assumptions, and update the report as data becomes available. A “working draft” post-mortem is better than waiting weeks for a perfect one.