TL;DR (QUICK ANSWER)
Website downtime is any period when users cannot access your site, either partially or completely. Common causes include server failures, hardware issues, traffic spikes, cyberattacks, software updates, or human error.
The best way to minimize downtime is to use proactive uptime monitoring, which alerts your team immediately when issues occur, allowing for a fast response and lessening impact on users and revenue.
Even brief or partial website outages can frustrate visitors, hurt revenue, and damage long-term trust and search engine visibility.
This guide will walk you through everything you need to know about website downtime including common causes, prevention strategies, investigation frameworks, and more.
Key takeaways
- Website downtime is not always a full outage. Partial failures and slow performance can be just as damaging.
- Downtime can be caused by servers, networks, applications, DNS issues, or third-party services.
- Even short outages can impact revenue, user trust, and search visibility.
- Fast detection matters more than perfect uptime. The quicker you spot issues, the less damage they cause.
- External uptime monitoring helps catch real user-facing issues before customers report them.
- Clear incident response and communication reduce downtime impact and recovery time.
Website downtime is inevitable. The key is to detect issues early with effective monitoring and respond quickly before users are impacted. With that thought in mind, let us get started.
What is website downtime?
Website downtime refers to any period when a website is unavailable or unable to function properly for users. This can range from a full outage, where the site cannot be accessed at all, to partial degradation that prevents certain pages, features, or services from working as expected.
Full outage vs. partial degradation
Let us understand the difference between a full outage and partial degradation.
- Full outage: The entire website is inaccessible. Users may see server errors (such as 500 errors), connection timeouts, or DNS failures.
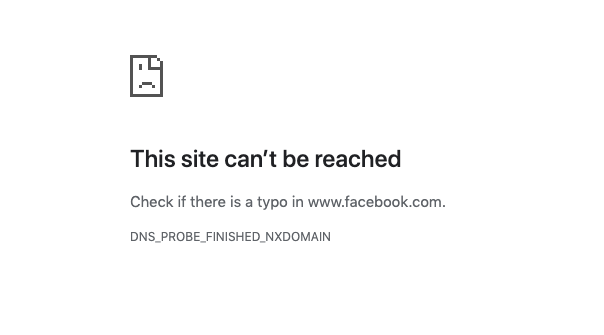
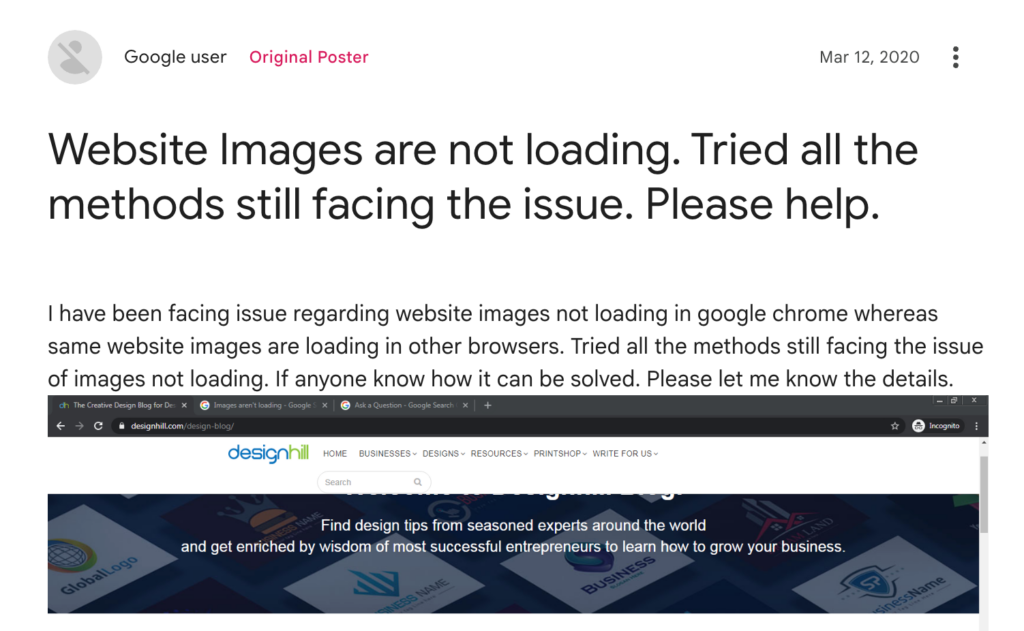
- Partial degradation: The website is technically online, but key components are failing. Pages may load slowly, images may not display, or specific features like checkout or login may be unavailable.
Frontend unavailable vs. backend failure
Now that you understand the difference between a full outage and a partial outage, let’s look at how frontend unavailability differs from a backend failure.
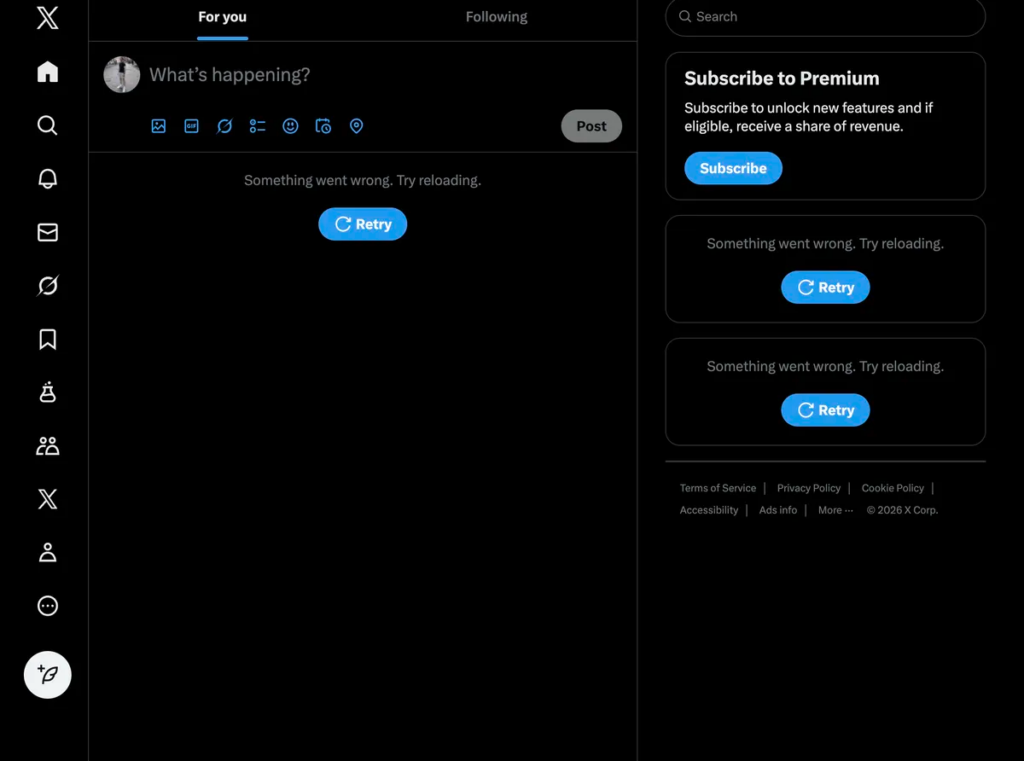
- Frontend unavailable: Frontend unavailable happens when the parts of a website that users interact with, like HTML, CSS, or JavaScript, fail to load or render correctly.
When this occurs, users may see blank pages, broken layouts, or missing content, even though the server itself is still running and technically online.
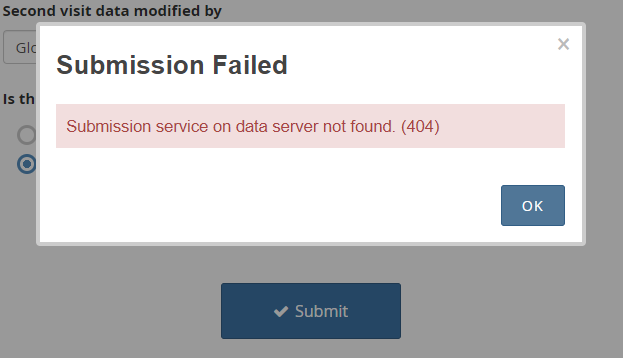
- Backend failure: Backend failure occurs when the server-side systems that power a website, such as databases, APIs, or application servers, stop functioning properly.
In this case, the site may appear to load normally, but users may not be able to retrieve data, submit forms, or complete actions, because the underlying systems that support those features are not working.
Why is downtime not always binary?
As we’ve seen, downtime isn’t just a simple matter of “up” or “down.” A website can appear online while still delivering a poor or broken user experience. Things like slow performance, intermittent errors, or failed integrations can all feel like downtime to users and impact your business, even if monitoring tools show the site as technically reachable.
The best way to address this is through comprehensive monitoring that tracks both uptime and performance, so issues can be detected and fixed before users are affected.

Why is website downtime so costly?
Website downtime is costly because every minute your site is offline can translate into real financial losses. For instance, Gartner (2014) estimates that large enterprises lose an average of $5,600 for every minute of downtime. Several factors contribute to these losses, from lost sales to operational disruptions.
Immediate revenue loss
When an e-commerce site goes down, visitors cannot browse products, add items to their cart, or complete purchases, which directly impacts sales. When Facebook went down again in 2021 (this time for only six hours), it cost the company nearly $100 million in revenue.
For B2B or SaaS businesses, downtime can be even worse, sometimes costing tens of thousands of dollars per minute as leads, sign-ups, and subscriptions slip through the cracks.
User trust erosion
Users expect websites to be fast and always available, and even a brief error or slowdown can lead to frustration. According to an Emplifi survey report, 46% of consumers stop engaging with a brand after just two bad experiences.
When visitors encounter an unavailable or slow website, their confidence in the brand takes a hit. Repeated downtime signals instability, making customers less likely to return, recommend your service, or rely on it for important tasks.
SEO and crawlability Impact
A few hours of downtime will not typically hurt your search rankings. Google’s Search Advocate John Mueller has explained that temporary outages, especially those under a day, aren’t treated as a quality issue and won’t immediately cause pages to drop in rankings.
That said, frequent or prolonged downtime can impact search visibility. If your site continues to return error responses like 503 Service Unavailable for more than a couple of days, Google may start to drop pages from its index, interpreting prolonged unavailability as if the content no longer exists.
When pages are removed from the index, they no longer appear in search results at all, which dramatically reduces organic traffic and can take time to recover even after the site is restored.
Internal operational costs
Downtime often triggers an immediate emergency response from engineering, operations, and support teams. This “firefighting” pulls staff away from planned projects, adds stress, and can result in overtime or temporary hires to handle the incident.
For example, if an e-commerce platform crashes during a sale, engineers might spend hours diagnosing server issues, all while regular work grinds to a halt. Over time, repeated incidents like this can lead to higher internal costs, even if no direct revenue is lost.
Tip: Read our guide The 6 Hidden Costs of Downtime to learn more about how downtime can affect your business.
What causes website downtime?
Website downtime can be caused by multiple reasons.
Infrastructure and server-level causes
These issues originate from the underlying hardware or operating system that runs your website.
- Hardware failure: Faulty disks, power supply failures, or ageing equipment.
- CPU or memory exhaustion: Traffic spikes or inefficient processes that overwhelm server resources.
- Disk issues: Full disks, slow I/O, or corrupted file systems.
- OS-level crashes: Kernel panics, misconfigured updates, or driver failures that bring servers offline.
Network-level causes
Network disruptions can prevent users from reaching your website even if servers are healthy.
- ISP outages: Connectivity failures at the internet service provider level.
- Routing issues: Misconfigured routes or BGP problems lead to misdirected traffic.
- DDoS attacks: Malicious traffic floods that overwhelm network or server capacity.
- Packet loss and latency spikes: Network instability leading to timeouts and slow responses.
Application-level causes
These are issues within the website or application code itself.
- Bad deployments: Buggy releases, configuration errors, or failed rollbacks.
- Memory leaks: Applications that gradually consume memory until they crash or stall.
- Unhandled exceptions: Errors that cause services or processes to terminate unexpectedly.
- Database bottlenecks: Slow queries, locked tables, or overloaded database servers.
DNS and domain issues
Problems with DNS can make a website unreachable even when everything else is working.
- Expired domains: Domains not renewed in time, causing immediate loss of access.
- DNS misconfiguration: Incorrect records, missing entries, or misrouted traffic.
- Slow DNS propagation: Delays when DNS changes take time to spread globally.
Third-party and dependency failures
Modern websites rely heavily on external services, and downtime can still happen due to failures outside your control.
- CDN outages: Content delivery network failures impacting site speed or availability.
- Payment provider outages: Outages preventing transactions and checkouts from completing.
- APIs and SaaS integrations: Failures in analytics, authentication, messaging, or other external services.
Server downtime vs. network downtime
Your website may go down because of either server downtime or network downtime. While the two sound similar, they are caused by different issues and affect users in different ways. Let’s break down the difference in detail.
| Server downtime | Network downtime | |
| Definition | Server downtime occurs when the server itself is unable to process requests due to hardware, operating system, or application failures. | Network downtime occurs when traffic cannot reach the server at all due to connectivity or routing failures. |
| Common symptoms | 5xx server errors (e.g., 500, 502, 503)Timeouts after a connection is establishedServices crash or restart repeatedlyHigh CPU, memory, or disk usage | Connection timeoutsDNS resolution failures“Site cannot be reached” or “Connection refused” errorsIntermittent accessibility from different regions |
| How users experience it | Users can reach the website, but pages fail to load properly or return error messages. Forms may not submit, logins may fail, or the site may appear partially broken. | Users are unable to access the website entirely. The site may work for some users but not others, depending on location or network path. |
| How monitoring tools detect it | Server health checks (CPU, memory, disk, load)Application logs and error ratesSynthetic tests that connect successfully but receive error responsesAPM tools detecting slow or failed transactions | Failed ping or TCP connection testsDNS lookup failuresGlobal monitoring probes showing regional outagesIncreased latency or packet loss metrics |
| Typical resolution owners | Internal teams: DevOps, SRE, platform, or engineering teamsSometimes, hosting providers, if hardware replacement is required | External providers: ISPs, cloud network services, DNS providers, CDN vendorsInternal network teams for firewall or routing misconfigurations |
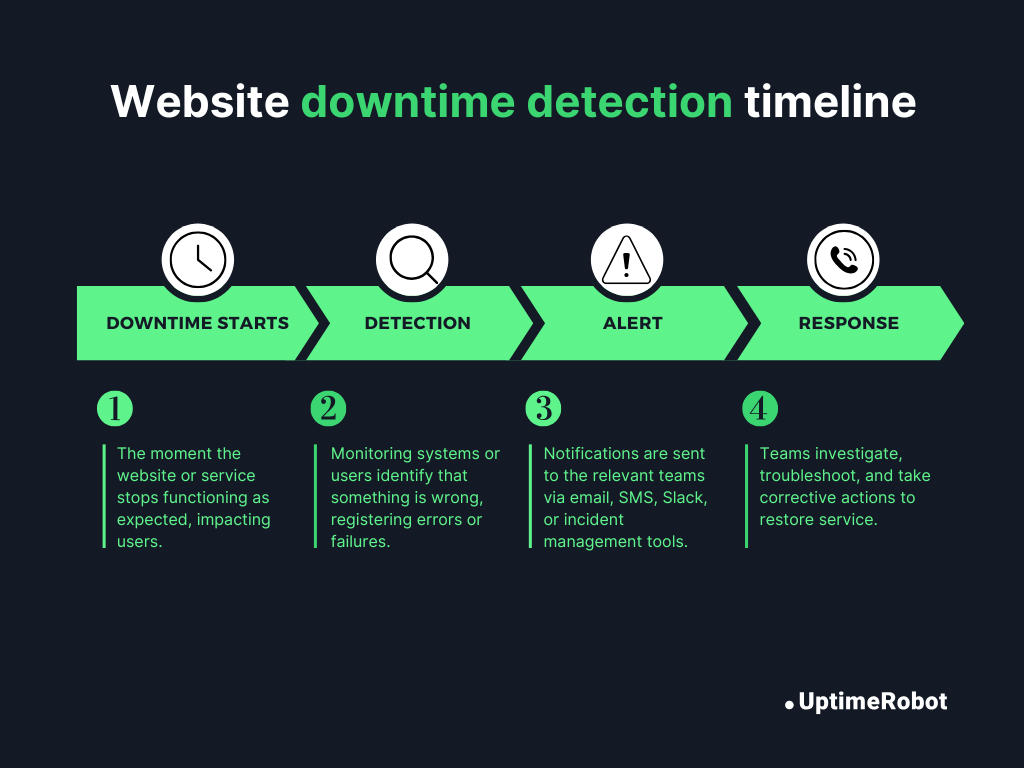
How website downtime is detected
Website downtime is usually discovered in one of two ways: by users noticing a problem or by automated monitoring systems detecting it proactively. The difference between these approaches often determines how costly an outage becomes.
User-reported downtime vs. automated detection
Without proactive monitoring in place, downtime is often first reported by users through support tickets, social media, or direct complaints. By the time this happens, the issue may have been affecting users for minutes or hours. This delay puts support teams in a reactive position.
For example, on January 13th, 2026, thousands of Reddit users reported problems accessing both the website and the mobile app before any official acknowledgement, highlighting how user reports often become the first signal that something is wrong.
Automated monitoring tools, on the other hand, continuously check website availability and performance. They detect issues in real time and alert teams immediately, often before users notice a problem. This faster detection reduces the duration of outages, limits business impact, and allows teams to respond proactively instead of firefighting after complaints start rolling in.
Why shouldn’t you rely on manual detection?
Even your best teams can’t monitor websites around the clock, and outages often happen outside business hours when no one is actively checking. Many users don’t report issues at all, they simply leave, retry later, or switch to a competitor. As a result, downtime, especially partial failures like broken checkouts, API errors, or slow pages, can go unnoticed for long periods.
Manual detection is also reactive and inconsistent. It relies on individual reports rather than continuous checks and provides little insight into when the issue started, how many users are affected, or which regions are impacted. By the time the problem is identified, the business impact has already occurred.
You need an automated detection system that covers the following:
- Regular frequency checks: Frequent checks (e.g., every 30-60 seconds) decrease the time between failure and detection.
- Geographic monitoring: Checking your site from multiple global locations helps identify regional outages, routing problems, or CDN failures.
- Multiple alerting channels: Deliver alerts through email, SMS, Slack, or incident management tools to make sure the right people are notified immediately.
Why does external uptime monitoring exist?
External uptime monitoring is the practice of checking your website’s availability from outside your own network or infrastructure. It simulates real user access from different locations on the internet to see whether your site is truly reachable.
This allows you to detect issues that internal checks might miss, such as DNS failures, ISP-specific outages, routing problems, or CDN disruptions. By monitoring your site externally, you get an unbiased perspective on whether your website is truly reachable from the internet, exactly how your users experience it.
Tools like UptimeRobot make this process simple, providing automated external checks and instant alerts without the need for complex setup, so your team can respond quickly before users are affected.
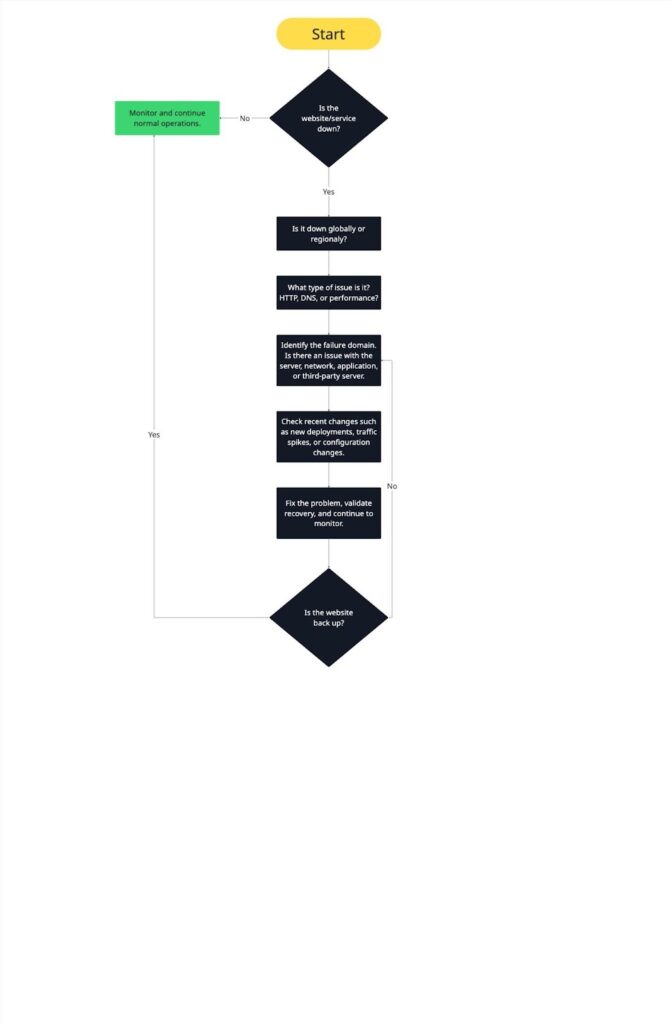
Website outage investigation framework (step-by-step)
Nobody likes a website outage, but when one happens, here’s a step-by-step guide to handling it without losing your mind.
Step 1: Confirm the outage
The first thing you need to do is make sure it’s actually an outage and not a false alarm. Don’t rush; confirming it upfront saves you a lot of time and stress later.
- Is it global or regional?
Check from multiple locations to see if everyone is affected or just certain regions, ISPs, or networks. This helps you understand the scope of the problem.
- What type of issue is it? HTTP, DNS, or performance?
- HTTP issues: Look for 4xx or 5xx errors, or requests that keep failing.
- DNS issues: Check if the domain is resolving correctly or if lookups are failing.
- Performance issues: Sometimes the site isn’t fully down, but extreme latency or timeouts make it feel like it is.
Taking a few minutes here prevents chasing ghosts, avoids false alarms, and narrows down where you should focus your investigation next.
Step 2: Identify the failure domain
Now that you know there’s a real outage, the next step is figuring out where the problem is happening. Pinpointing the right domain quickly saves time and prevents unnecessary troubleshooting.
- Server: Check for high CPU or memory usage, crashed services, or full disks. These are classic signs that the server itself is struggling.
- Network: Look for connectivity losses, routing failures, or issues with firewalls or your CDN. Sometimes the server is fine, but the network is blocking access.
- Application: Watch for crashing processes, unhandled exceptions, or broken dependencies that prevent your site or app from functioning properly.
- Third-party: Don’t forget about external dependencies like CDNs, payment gateways, APIs, or SaaS integrations. They can all cause downtime even if your servers are running fine.
By identifying the correct failure domain early, you can avoid wasted effort and escalate the issue to the right team faster.
Step 3: Check recent changes
Most outages are triggered by something that changed. Before diving deeper, ask yourself: Has anything changed recently that could have caused this?
- Deployments: Did a new release go live just before the outage?
- Configuration changes: Any updates to servers, databases, or firewalls?
- Traffic spikes: Did sudden traffic overload the system?
Looking at recent changes helps you connect the dots quickly and often reveals the root cause faster than guessing blindly. It also helps prevent repeating the same mistake in future releases.
Step 4: Validate recovery and monitor
Once you think you’ve fixed the problem, don’t relax just yet. Make sure everything is actually working for your users.
- Confirm full restoration: Test all key features, pages, and workflows. If possible, check from multiple locations and devices to ensure everyone can access the site as expected.
- Watch for regression: Keep monitoring closely for a while to catch any lingering issues. Track error rates, latency, and resource usage to make sure the outage doesn’t reappear.
This final step closes the loop: the outage is resolved, users are back online, and your team can document lessons learned for next time.
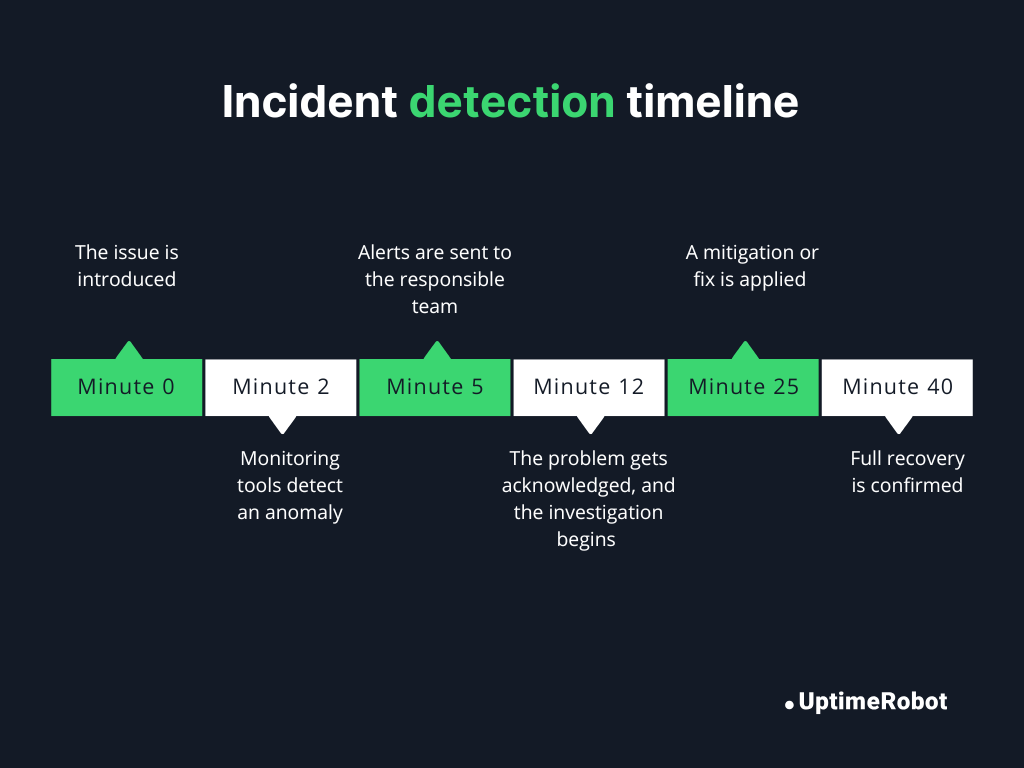
Website downtime timelines (what really happens during an incident)
When a website goes down, it’s easy to imagine it happening instantly and getting fixed immediately, but in reality, downtime unfolds in a series of steps. Here’s a typical timeline of a website downtime incident:
Minute 0: The issue is introduced
A new deployment goes live on an e-commerce site, but it contains a bug that crashes the checkout service. At this point, some users experience failed purchases, but the frontend still loads for others.
Minute 2: Monitoring tools detect an anomaly
Automated uptime monitoring detects repeated failed requests to the checkout endpoint and flags an error. The monitoring system records high latency and partial failures.
Minute 5: Alerts are sent to the responsible team
The monitoring system sends alerts to the engineering team via Slack and email, notifying them of the issue.
Minute 12: The problem gets acknowledged, and the investigation begins
An engineer acknowledges the alert, checks logs, and begins investigating. They notice that the new deployment caused a database connection error affecting the checkout service.
Minute 25: A mitigation or fix is applied
The engineer rolls back the deployment to the previous stable version. Error rates drop, and server metrics start returning to normal.
Minute 40: Full recovery is confirmed
The checkout service is fully operational. Tests from multiple regions confirm that users can complete purchases successfully. The team continues monitoring for any regression.
Key incident metrics you should measure
To understand how an outage unfolds and how your team responds, it helps to track a few key metrics that measure detection, acknowledgement, and resolution.
- MTTA (Mean Time to Acknowledge): How long it takes for someone to respond to an alert. In the example above, the engineer acknowledged the issue 10 minutes after the alert was sent.
- MTTD (Mean Time to Detect): How quickly the issue is detected from the moment it occurs. In our incident, monitoring tools detected the problem within 2 minutes.
- MTTR (Mean Time to Resolve): The total time it takes to fix the problem and restore normal service. In the example, it took 28 minutes from the start of the incident to full recovery.
Tip: learn more in our Incident Management Guide
Real-world website downtime examples
Here are some ways that downtime can play out in real life.
1. SaaS deployment failure disrupts customer access
A major SaaS platform providing CDN services suffered a widespread outage, impacting multiple websites and applications worldwide. Users attempting to access affected sites experienced service errors or incomplete page loads for nearly an hour.
Root cause:
A software bug introduced during a routine deployment triggered failures in the platform’s proxy system. The bug caused the evaluation of certain rulesets to fail, resulting in HTTP 500 errors being served to end users.
Detection method:
Monitoring tools flagged widespread service errors almost immediately. Customers also reported availability issues on social media and status pages.
Time to recovery:
Approximately 60 minutes from the onset of the outage until normal service was fully restored.
Lessons learned:
- Test deployments carefully, especially for globally critical changes.
- Legacy systems can amplify the impact of new bugs.
- Continuous monitoring and real-time alerts are essential to detect issues quickly.
- Transparent communication reduces confusion and maintains customer trust.
2. E-commerce website outage on peak sales day
During a peak shopping event, an e-commerce platform experienced a significant outage, preventing merchants from logging in or accessing point-of-sale systems. Thousands of businesses were unable to manage transactions during one of the highest-traffic periods of the year.
Root cause:
An issue with the login authentication flow caused intermittent access failures across merchant accounts. The outage coincided with unusually high traffic volumes, exacerbating the impact.
Detection method:
Monitoring dashboards and customer-reported issues on real-time feedback sites indicated widespread problems. Internal alerting confirmed high error rates on login and POS endpoints.
Time to recovery:
Services began recovering within a few hours of detection, with full resolution achieved after authentication issues were fixed and traffic normalized.
Lessons learned:
- High-traffic periods require stress-tested authentication systems.
- Real-time monitoring ensures rapid identification of service disruptions.
- Prioritize recovery of critical workflows like login and payment processes.
- Keep customers informed to reduce frustration during outages.
3. DNS misconfiguration causes a global website outage
A leading DNS and proxy provider experienced a partial outage affecting a subset of websites worldwide. Users visiting affected sites received HTTP 500 errors, while others remained unaffected depending on their configuration and region.
Root cause:
A configuration change in the provider’s global system, intended to enhance security and buffer handling, inadvertently triggered runtime errors in their legacy proxy infrastructure. This caused a portion of customer traffic to fail.
Detection method:
Automated monitoring detected HTTP 500 errors across multiple endpoints, supplemented by customer reports. Internal logging identified the faulty configuration change.
Time to recovery:
About 25 minutes from the incident onset until full restoration of services for all impacted customers.
Lessons learned:
- Even small configuration changes can break website availability.
- Legacy systems increase the risk of widespread impact.
- Monitoring and real-time alerts are essential to detect problems immediately.
- Clear communication and status updates reduce user confusion.
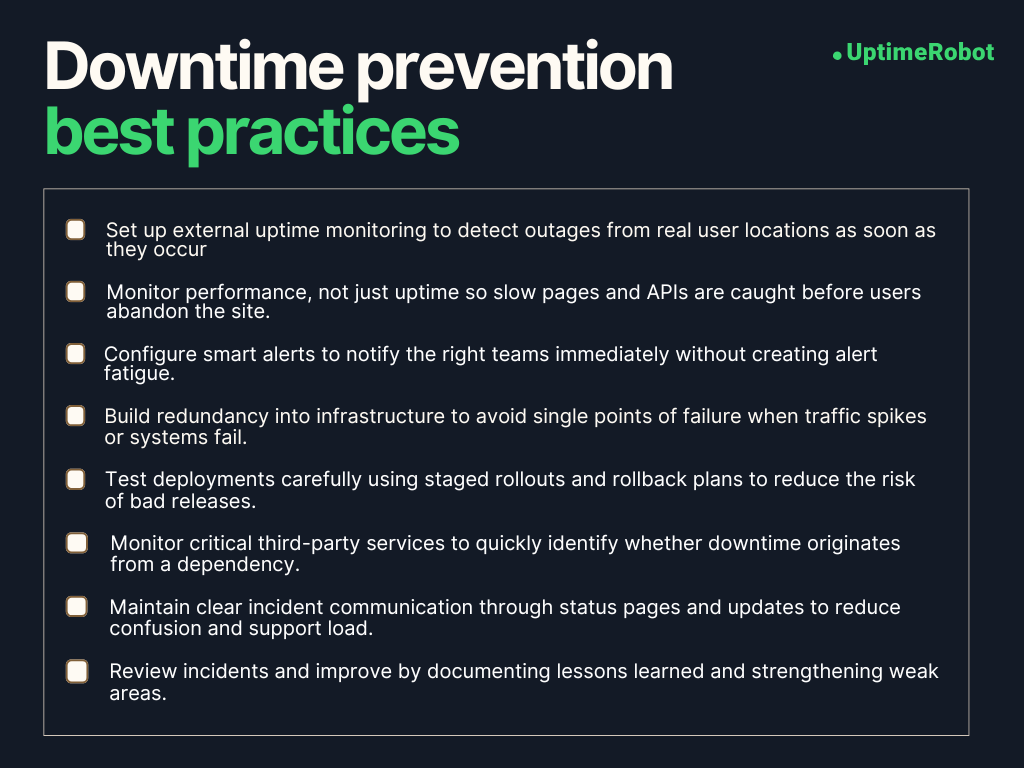
How to prevent website downtime
Website downtime can’t be completely avoided, but you can significantly reduce its impact by putting the right processes and safeguards in place.
1. Monitoring and alerting best practices
Think of monitoring as your early warning system. Instead of finding out about problems from angry customers or support tickets, monitoring allows you to spot issues as soon as they occur.
- Uptime checks: Keep an eye on website availability from multiple locations. That way, you’ll spot outages or regional failures quickly.
- Response time monitoring: Track page load times and API latency. Slow performance might not be a full outage, but it frustrates users just the same.
- Status pages: Whether internal or public, a status dashboard keeps your team and your users informed about what’s going on.
- Alerting: Make sure alerts reach the right people immediately via email, SMS, Slack, or your incident management tools. Set smart thresholds, so you don’t drown in false alarms, but still catch real issues fast.
2. Infrastructure resilience
Make sure your infrastructure is built to survive problems without taking your site down.
- Redundancy: Reduce a single point of failure by deploying duplicate critical components like servers, databases, and network paths.
- Load balancing: Spread traffic across multiple servers or regions so no single server gets overwhelmed.
- Failover: Make sure backups automatically kick in if the primary system fails.
3. Deployment and change management
A lot of downtime happens because of new changes. The trick is to deploy carefully.
- Canary releases: Roll out new features to a small subset of users first. If something goes wrong, you catch it early.
- Rollbacks: Always have a plan to revert changes quickly, whether manually or automatically.
- Maintenance windows: Schedule updates during low-traffic periods so fewer users are affected.
4. Dependency monitoring
Even if your own infrastructure is stable and well-maintained, your website still depends on several external services to function properly. If any one of these services goes down, your site can feel broken to users.
- Third-party uptime tracking: Use external monitoring tools to keep an eye on critical services, so you can quickly determine whether a problem is coming from your own systems or from a third-party dependency.
- SLA awareness: Understand your providers’ availability guarantees so you can plan accordingly and know what to expect during outages.
SLAs, SLOs, and uptime percentages explained
SLAs, SLOs, and uptime percentages help you measure and agree on how reliable your website or service should be. Understanding them will help you set expectations, track performance, and ensure your team delivers consistent uptime.
1. SLA (Service Level Agreement)
A formal contract between a service provider and customers defining guaranteed service levels, including uptime commitments, penalties, and responsibilities.
2. SLO (Service Level Objective)
A specific target within an SLA that defines acceptable performance or uptime for a service (e.g., “99.9% uptime per month”).
3. SLI (Service Level Indicator)
The metric used to measure performance against an SLO (e.g., actual uptime percentage, error rate, response time).
Tip: Take a look at SLA vs. SLO vs. SLI: What’s the Difference? to learn more.
SLAs are essential for setting clear expectations with your customers and stakeholders, but they only matter if you can measure whether they’re being met.
That’s where continuous monitoring comes in. It tracks uptime, error rates, and other key service indicators in real time. These metrics feed into SLO reporting, which compares actual performance against agreed-upon targets to verify SLA compliance. If targets aren’t met, penalties or credits may apply, creating accountability and driving operational improvements.
High-availability websites are often measured in “nines,” which directly reflects SLA commitments: the more nines your SLA guarantees, the less downtime is acceptable.
Here’s how that downtime adds up over time:
| Uptime percentage | Annual downtime | Monthly downtime | Daily downtime |
| 99.9% (three nines) | ~8.76 hours/year | ~43.8 min/month | ~1.44 min/day |
| 99.99% (four nines) | ~52.56 min/year | ~4.38 min/month | ~8.64 sec/day |
| 99.999% (five nines) | ~5.26 min/year | ~25.9 sec/month | ~0.86 sec/day |
Even a small difference in “nines” dramatically reduces downtime, which is critical for mission-critical systems like banking or SaaS platforms.
How to communicate during website downtime
We know how stressful downtime can be, for both your team and your users. The best way to handle it quickly is to have a clear communication guideline in place. This keeps everyone organized and ensures the right people are involved at the right time.
1. Internal communication
Strong internal communication during downtime avoids panic and helps teams move faster.
Immediate alerts
As soon as monitoring detects an issue, notify engineering, DevOps, support, and leadership. Early awareness reduces response time and avoids surprises.
Incident channels
Use a dedicated Slack channel, Microsoft Teams group, or incident management tool to centralize all updates. This prevents scattered conversations and missed information.
Roles and responsibilities
Clearly define who is investigating the issue, who is handling external communication, and who is responsible for escalation and decisions. This avoids duplication and confusion.
Regular updates
Share progress updates and estimated resolution times, even if they’re rough. Frequent communication keeps everyone aligned and cuts down on repeated status checks.
2. Customer updates
Internal coordination is only half the job. Your customers are feeling the impact too, and how you communicate with them can make a big difference in maintaining trust.
Timely notifications
Let affected customers know as soon as possible, ideally within the first few minutes of a major outage. Early acknowledgement reassures them that the issue is recognized.
Transparency
Share what you know, what you’re actively working on, and any expected timelines if available. Be honest, but avoid guessing or overpromising.
Channels
Use the channels your customers already rely on, such as email, in-app banners, status pages, or push notifications, to ensure the message reaches them quickly.
Tone
Keep the message empathetic, professional, and solution-focused. Acknowledge the inconvenience, take responsibility, and reassure users that your team is actively resolving the issue.
3. Status pages
A status page acts as your single source of truth during an incident. It reduces support load and gives users confidence that you’re on top of the situation.
Public-facing status pages
Share real-time updates about system availability and ongoing incidents so users don’t have to guess what’s happening.
Granularity
Show exactly which parts of the system are affected, such as APIs, checkout, login, or search, and how severe the impact is.
Automated updates
Connect your monitoring tools directly to the status page, so updates reflect real system changes, not manual guesswork.
Historical data
Allow users to view past incidents and resolutions. This transparency builds long-term trust and shows accountability over time.
4. Post-incident reports
Once the outage is over, the work isn’t quite done. A post-incident report helps you understand what went wrong, improve your systems, and avoid repeating the same mistake.
Root cause analysis (RCA)
Clearly explain what happened, why it happened, and how the issue was fixed. Focus on facts, not blame.
Metrics
Include important numbers like MTTD, MTTA, and MTTR, along with total downtime and how many users were affected. These metrics show how quickly the issue was detected and resolved.
Lessons learned
Call out what could have prevented the outage or reduced its impact, whether that’s better monitoring, safer deployments, or infrastructure changes.
Internal sharing
Share the report with engineering, operations, support, and leadership so everyone learns from the incident and can improve future responses.
Customer summary (optional)
For major incidents, provide a short, plain-language summary to affected customers. Transparency about what happened and what you’re fixing helps rebuild trust.
How uptime monitoring helps reduce downtime
When a website goes down, it’s not just a technical issue; revenue takes a hit, customer trust is affected, and brand reputation suffers. In regulated industries like banking and finance, downtime can also lead to serious compliance issues and financial penalties.
Uptime monitoring helps address the root of these problems by detecting issues faster, providing clear visibility into what’s broken, and creating accountability around response and resolution.
External monitoring software checks your website from outside your infrastructure, helping you detect real user-facing issues quickly. Alerts reduce response times and confusion during incidents by notifying the right teams immediately.
Over time, historical uptime reports provide visibility into reliability trends, help verify SLA compliance, and create accountability for how quickly issues are detected and resolved.
Together, these capabilities turn downtime from a reactive problem into something measurable, manageable, and easier to prevent.
Stay ahead of outages with UptimeRobot monitoring your site every 30 seconds so you can act before your users are affected.
FAQ's
-
Acceptable website downtime depends on your website’s purpose. Most websites target 99.9% uptime, which allows for approximately 8.76 hours of downtime per year. However, if you run a mission-critical website, such as a financial or healthcare platform, you should aim for 99.99% or even 99.999% uptime, limiting downtime to just minutes or seconds annually.
-
Yes. Frequent or prolonged downtime can negatively affect SEO. If search engine crawlers repeatedly encounter an unavailable site, rankings may drop, pages may be deindexed, and crawl frequency can decrease. Short, infrequent outages usually don’t cause lasting harm, but recurring downtime does.
-
Monitoring tools can’t prevent all downtime, but they greatly reduce its impact. They provide real-time alerts, performance tracking, and early warning signs, allowing teams to fix issues quickly, often before users even notice a problem.
-
Downtime means the website is completely inaccessible.
Slow performance means the site is online but takes too long to load or respond. Both harm user experience, but slow performance often goes unnoticed longer while still driving users away.
-
Uptime should be monitored 24/7, ideally with checks every 30-60 seconds. Continuous monitoring ensures issues are detected immediately, regardless of time zones, traffic spikes, or unexpected failures.