TL;DR (QUICK ANSWER)
Distributed tracing lets you follow a single request as it travels through multiple services, showing the full path, timing, and dependencies end to end. It fills the gap left by logs and metrics by explaining where time was actually spent and why a specific request was slow or failed. Tracing works by creating a trace ID, recording work as spans, and propagating context across services, then visualizing the trace in a backend. It is most useful for debugging latency spikes, uncovering hidden dependency issues, and speeding up incident response, and it works best when you instrument critical paths first and use sensible sampling to control cost.
Distributed systems make failures harder to see. A single user request can touch dozens of services, cross networks, trigger async jobs, and fail in places you are not directly monitoring.
When something slows down or breaks, logs tell you what happened in one service. Metrics tell you that something is wrong in aggregate. Neither tells you how a specific request moved through the system or where time was actually spent.
Distributed tracing exists to answer that question. It shows the full path of an individual request across services, with timing and relationships intact, so teams can understand real behaviour instead of guessing from partial signals.
That context becomes critical as systems scale, architectures decentralize, and performance issues stop having a single obvious cause. Let’s examine distributed tracing and all you need to know including how it functions, best practices, and use cases.
Key takeaways
- Distributed tracing shows how a single request moves through multiple services, end to end.
- Logs and metrics alone can’t explain where time is spent in distributed systems.
- Traces make latency, failures, and dependencies visible across service boundaries.
- Tracing becomes essential as systems move from monoliths to microservices.
- The value of tracing is understanding real request behaviour, not just system averages.

What is distributed tracing?
Distributed tracing is a way to follow a single request as it moves through a distributed system. It records where the request goes, how long each step takes, and how different services are connected.
Instead of looking at logs or metrics in isolation, tracing ties everything together using a shared identifier. That identifier lets you see the full request path from start to finish.
A simple example
A user loads a product page.
That request might:
- Hit an API gateway
- Call a product service
- Query an inventory service
- Fetch pricing from another service
- Trigger an async recommendation call
Each of those steps adds latency. Distributed tracing captures every step and shows how much time was spent in each service, in the correct order.
Without tracing, you see just fragments. With tracing, you see the whole journey.
Why logs and metrics fall short
Logs tell you what happened inside a single service. Metrics show trends like error rates or average latency. Both are useful, but neither can answer a simple question in distributed systems:
Why was this specific request slow or broken?
Logs lack context across services. Metrics average away individual failures. Tracing fills that gap by preserving request-level context across service boundaries.
Why distributed tracing exists
Distributed tracing exists because modern systems broke the old debugging model.
In a monolithic application, a request stayed inside one codebase and usually one process. If something was slow, logs and stack traces were often enough to find the cause.
That stopped working once systems were split into services.
The shift to microservices
Microservices introduced flexibility and scale, but they also introduced complexity. A single request now crosses service boundaries, networks, queues, and sometimes regions.
Each hop adds:
- Network latency
- Failure points
- Retry logic
- Time spent waiting on other services
When something goes wrong, the problem rarely lives in one place.
Hidden dependencies and async workflows
Modern systems rely heavily on asynchronous processing. Requests trigger background jobs, event consumers, and message queues that don’t show up in a simple request-response flow.
These hidden dependencies make debugging harder. A slow API response might be caused by a downstream service, a queue backlog, or an external dependency that isn’t immediately visible.
Without traces, these relationships stay invisible.
Core concepts in distributed tracing
Distributed tracing relies on a small set of core concepts. Once these are clear, the rest of the system becomes much easier to reason about.
Traces
A trace represents the full lifecycle of a single request as it moves through a system.
It starts when the request enters the system and ends when the final response is returned or the work completes. Everything that happens along the way belongs to the same trace.
Think of a trace as the timeline of one request, end to end.
Spans
A span represents a single unit of work within a trace.
Examples include:
- An HTTP request to another service
- A database query
- A cache lookup
- A message published to a queue
Each span has a start time and duration. Spans are linked together in parent-child relationships, which show how work flows between services.
A trace is made up of many spans connected in order.
Context propagation
Context propagation is how trace information moves between services.
When a request enters the system, a unique trace ID is created. That ID is passed along with the request as it calls other services, usually through headers.
As long as services pass this context forward, all spans can be connected back to the same trace. If propagation breaks, the trace becomes fragmented and loses value.
This is why consistent instrumentation across services matters more than adding more traces.
How distributed tracing works step by step
The mechanics of distributed tracing stay similar across languages and platforms.
Here’s the typical flow.
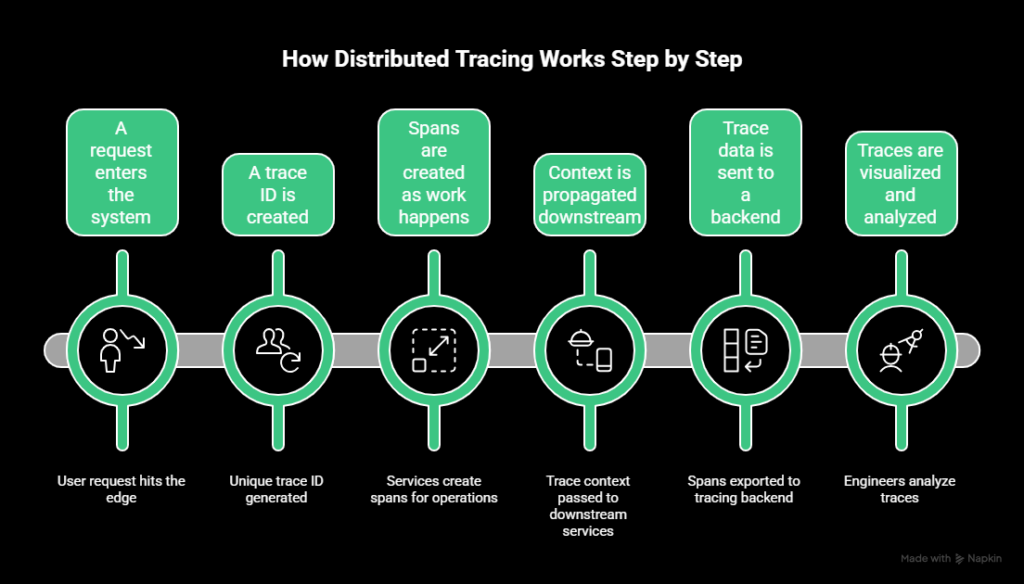
1. A request enters the system
A user request hits the edge of your system. That might be an API gateway, load balancer, or frontend service.
If no trace exists yet, tracing starts here.
2. A trace ID is created
The tracing system generates a unique trace ID for the request. This ID becomes the thread that ties all related work together.
From this point on, every service involved should reference the same trace ID.
3. Spans are created as work happens
Each service creates spans for the work it performs.
That can include:
- Handling the incoming request
- Calling downstream services
- Querying a database
- Publishing messages or jobs
Each span records timing and metadata about that operation.
4. Context is propagated downstream
As services call other services, the trace context is passed along with the request.
This allows downstream services to attach their spans to the same trace and preserve the correct parent-child relationships.
5. Trace data is sent to a backend
Spans are exported to a tracing backend. This usually happens asynchronously to reduce the impact on request latency.
The backend stores spans, reconstructs traces, and prepares them for querying and visualization.
6. Traces are visualized and analyzed
Engineers view traces as timelines or graphs that show how requests flowed through the system.
This makes it possible to:
- See where time was spent
- Identify slow or failing dependencies
- Understand execution order across services
The value comes from seeing the entire request path in one place, rather than stitching together logs and metrics by hand.
Distributed tracing vs. logs vs. metrics
Logs, metrics, and traces answer different questions. Problems start when teams expect one signal to do the job of another.
Here’s how they compare:
| Signal | What it shows | Best used for | Where it falls short |
| Metrics | Aggregated system behaviour over time | Alerting, trend analysis, capacity planning | Averages hide individual failures |
| Logs | Discrete events inside a service | Debugging known issues, audits | Hard to correlate across services |
| Traces | End-to-end request behaviour | Debugging latency and dependency issues | Requires instrumentation and sampling |
Why tracing completes the observability triad
In distributed systems, failures rarely live in one place. A slow request might involve multiple services, retries, and dependencies that aren’t obvious from metrics alone.
Tracing connects the dots. It preserves request-level context across services, which logs and metrics can’t do on their own.
Used together, metrics tell you that there’s a problem, logs help explain what happened locally, and traces show why it happened across the system.
Common use cases for distributed tracing
Distributed tracing is most valuable when systems behave in ways that are hard to explain with logs or metrics alone. These are the scenarios where traces tend to pay for themselves quickly.
Debugging latency spikes
When a request is slow, metrics can show increased latency but not where the time was spent.
Traces break latency down by service and operation. They show whether the delay came from a database query, a downstream API call, or a queue wait, without guessing or correlating timestamps across logs.
Finding bottlenecks in microservices
In microservice architectures, performance problems often move as systems evolve.
Tracing makes it easier to spot bottlenecks that shift over time, such as a service that becomes a critical dependency or a call path that grows longer than expected.
Identifying failing dependencies
Some failures don’t show up as errors. Timeouts, retries, and partial failures can degrade performance without triggering alerts.
Tracing reveals these hidden issues by showing retries, long waits, and error propagation across service boundaries.
Understanding real user request paths
Architecture diagrams describe how systems are supposed to work, while traces show how they actually work.
They reveal unexpected call paths, redundant requests, and services involved in requests that engineers didn’t anticipate.
Supporting incident response and root cause analysis
During incidents, time matters. Traces help teams move from alert to cause faster by showing exactly how failing requests behaved.
After incidents, traces provide concrete evidence for root cause analysis, instead of relying on assumptions or incomplete data.
Our tip: UptimeRobot can help you with incident management
Distributed tracing standards and ecosystem
Distributed tracing only works when services can share context reliably. That’s why standards and ecosystem choices matter more here than in many other parts of observability.
Open standards
The most important standard today is OpenTelemetry.
OpenTelemetry defines:
- How traces, spans, and context are represented
- How data is collected and exported
- Common libraries and SDKs across languages
Using an open standard keeps instrumentation consistent across services and teams. It also decreases long-term risk if tooling changes, because trace data isn’t tied to a single vendor format.
Open source backends
Several open source projects act as trace storage and visualization backends.
Common examples include:
These tools are often used for learning, experimentation, or as part of internal observability stacks. They give teams control, but also require operational effort around scaling, storage, and maintenance.
Commercial observability platforms
Commercial platforms typically bundle tracing with metrics, logs, dashboards, and alerting.
They focus on:
- Easier setup and management
- Scalable storage and querying
- Integrated workflows for debugging and incidents
The tradeoff is cost and platform dependency, which makes standards support especially important.
Interoperability and lock-in risks
Tracing data is most valuable when it can move between tools.
Standards-based instrumentation lets teams:
- Change backends without re-instrumenting code
- Mix open source and commercial tools
- Avoid rebuilding tracing pipelines during migrations
Without standards, tracing quickly becomes brittle and expensive to maintain.
Instrumentation approaches
Distributed tracing only works if services are instrumented correctly. How you instrument has a direct impact on trace quality, overhead, and long-term maintenance.
There are two main approaches, and most teams end up using a mix of both.
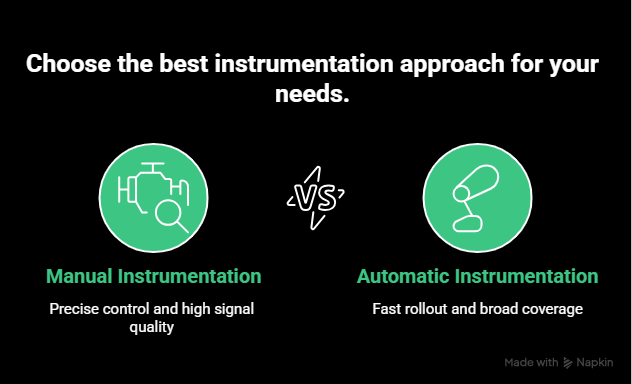
Manual instrumentation
Manual instrumentation means explicitly adding tracing code to your application.
You decide:
- Where spans start and end
- What metadata is attached
- Which operations are traced
This gives you precise control and very high signal quality. It’s most useful for business-critical paths where you want detailed visibility.
The downside is effort. Manual instrumentation takes time, requires discipline, and can drift out of sync as services change.
It works best when applied selectively, not everywhere.
Automatic instrumentation
Automatic instrumentation relies on language agents or libraries that hook into common frameworks and protocols.
These tools can automatically trace:
- HTTP requests
- Database queries
- Messaging systems
- Common middleware
This approach is much faster to roll out and provides broad coverage with minimal code changes. It’s often the easiest way to get initial visibility in large systems.
The tradeoff is control. Automatically generated spans can be noisy, inconsistent, or missing important context unless teams review and tune them.
Common instrumentation mistakes
Teams often run into trouble when they:
- Instrument everything at once without prioritization
- Rely only on automatic instrumentation and never refine spans
- Forget to propagate context across async boundaries
- Treat tracing as a one-time setup instead of an ongoing practice
Starting small, validating traces early, and iterating over time usually leads to better results than trying to capture everything on day one.
Trace sampling strategies explained
Tracing every request in a distributed system rarely scales. Data volume grows fast, storage costs climb, and analysis becomes noisy.
Sampling exists to balance visibility with cost and performance. The challenge is choosing a strategy that preserves useful traces without overwhelming your system.
Why sampling is required
In high-traffic systems, tracing 100% of requests can generate an enormous amount of data. Even lightweight spans add overhead when multiplied across services and requests.
Without sampling, teams often run into:
- High ingestion and storage costs
- Slower trace queries
- Increased operational overhead
- Difficulty finding meaningful traces in a sea of noise
Sampling limits how many traces are collected while still aiming to keep the most valuable ones.
Head-based sampling
Head-based sampling decides whether to keep a trace at the start of the request. For example, a system might sample 1 out of every 100 requests and drop the rest.
The main advantage is simplicity. The decision is made early, overhead stays predictable, and implementation is straightforward.
The downside is accuracy. Because the decision happens before the request completes, head-based sampling can miss rare errors or slow requests. A trace that looks unimportant at the start might become critical later.
Tail-based sampling
Tail-based sampling makes the sampling decision after the request has completed.
Instead of sampling randomly, it can keep traces based on conditions such as:
- High latency
- Errors or retries
- Specific services or endpoints
This way, teams end up with the traces they actually need when debugging performance issues or hard-to-reproduce failures.
The tradeoff is complexity. Tail-based sampling requires buffering trace data and adds operational overhead. It’s harder to implement and scale correctly.
Sampling tradeoffs
There is no perfect sampling strategy.
Head-based sampling offers predictability and low cost but risks missing important data.
Tail-based sampling improves visibility but increases complexity and resource usage.
Many teams start with simple head-based sampling, then introduce more selective strategies as systems grow. The key is aligning sampling decisions with what actually matters for debugging and reliability.
Performance and cost considerations
Tracing adds overhead. How much depends on how it’s implemented, how much data you collect, and how long you keep it.
Most cost problems come from tracing too much, not from tracing at all.
Runtime overhead
Creating spans, propagating context, and exporting data all take resources. In well-instrumented systems, this overhead is usually small, but it isn’t zero.
Problems show up when:
- Every internal operation becomes a span
- High-cardinality attributes are attached everywhere
- Tracing runs synchronously in hot paths
Keeping spans focused on meaningful work helps control overhead without losing visibility.
Storage growth
Trace data grows faster than logs in busy systems because each request can generate many spans.
Costs rise quickly when teams:
- Retain traces for long periods
- Store unsampled traces unnecessarily
- Duplicate data across environments
Clear retention policies and sampling strategies matter more than raw infrastructure size.
Cardinality pitfalls
High-cardinality data, such as user IDs or request-specific values, makes traces harder to query and more expensive to store.
Attaching this data everywhere feels useful at first, then becomes unmanageable. Limiting attributes to what actually helps debugging keeps systems usable over time.
Avoiding observability bill shock
Teams avoid cost surprises by:
- Sampling early and adjusting gradually
- Tracing critical paths before everything else
- Reviewing trace volume regularly
- Aligning retention with operational needs, not curiosity
Tracing works best when treated as an engineering system, not a fire-and-forget feature.
Distributed tracing in incident response
During an incident, speed matters more than completeness. Teams need to understand what’s failing and why, without stitching together data from multiple tools under pressure.
Distributed tracing shortens that path.
Faster time to root cause
Alerts usually fire on metrics. They tell you something is wrong, not where to look.
Traces provide a starting point.
By examining slow or failing requests, teams can see which services were involved, how requests flowed, and where time or errors accumulated. That cuts a lot of guesswork early in an incident.
Using traces during live incidents
During active incidents, traces help teams:
- Identify which dependency is causing delays
- Confirm whether failures are isolated or systemic
- Validate whether a mitigation actually improved request behaviour
Because traces show individual request paths, they’re especially useful when failures affect only a subset of traffic.
Supporting post-incident analysis
After an incident, traces provide concrete evidence for root cause analysis.
They show:
- The exact sequence of events leading to failure
- How retries and fallbacks behaved
- Whether similar traces existed before the incident
This makes postmortems more factual and less speculative, and helps teams prevent repeat issues instead of reacting to symptoms.
Our tip: read more in our incident management guide
Common challenges and pitfalls
Distributed tracing can lose value quickly if implementation gaps creep in. Most issues don’t come from the tooling itself, but from how tracing is rolled out and maintained.
Partial instrumentation
Tracing only a subset of services creates blind spots.
When some services emit traces and others don’t, request paths appear broken or incomplete. This makes traces harder to trust and limits their usefulness during debugging.
Instrumenting critical paths end to end matters more than instrumenting everything.
Broken context propagation
Context propagation failures are one of the most common tracing problems.
If trace context isn’t passed across service boundaries, queues, or async jobs, spans stop linking together. The result is fragmented traces that look like unrelated requests.
This often shows up after introducing new middleware, messaging systems, or background workers.
Over-instrumentation
Adding spans everywhere creates noise.
Too many low-value spans make traces harder to read and more expensive to store. They also increase overhead without improving understanding.
Tracing works best when spans represent meaningful units of work, not every internal function call.
Ignoring asynchronous workflows
Async processing is easy to miss.
Background jobs, message consumers, and scheduled tasks often run outside the main request path. If they aren’t traced or don’t propagate context, large parts of system behaviour remain invisible.
Distributed systems rely heavily on async workflows. Tracing strategies need to account for that from the start.
Best practices for distributed tracing
Good tracing isn’t about collecting more data. It’s about collecting the right data, consistently, and using it when it matters.
Start with critical paths
Begin with the request paths that matter most to users and the business.
That usually means:
- Entry points like APIs and gateways
- Core user flows
- Services involved in revenue or reliability
End-to-end visibility on a few critical paths is more valuable than partial coverage everywhere.
Instrument APIs first
APIs define how services interact. Tracing them early gives immediate insight into latency, failures, and dependency behaviour.
Once API boundaries are traced, internal spans can be added selectively where they provide clear value.
Align sampling with SLAs
Sampling decisions should reflect what you care about operationally.
If certain endpoints have strict latency or availability targets, traces for those requests should be prioritized. Sampling strategies that ignore SLAs tend to drop the traces teams actually need during incidents.
Review traces regularly
Tracing shouldn’t only be used when something breaks.
Regularly reviewing traces helps teams:
- Spot slow paths before they trigger alerts
- Identify growing dependencies
- Catch instrumentation gaps early
This keeps traces trustworthy and gets rid of surprise during incidents.
Treat tracing as part of system design
Tracing works best when it’s planned, not bolted on.
Changes to architecture, async workflows, or middleware should include a quick check for context propagation and trace impact. That habit prevents silent regressions over time.
The future of distributed tracing
Distributed tracing is becoming less of a specialist tool and more of a baseline capability.
As systems grow more dynamic, traces are increasingly combined with metrics and logs to
provide a unified view of system behaviour. Instead of switching between tools, teams expect to move fluidly from alerts to traces to root cause.
Sampling is also getting smarter. Rather than static rules, newer approaches focus on keeping traces that matter most, based on latency, errors, or unusual behaviour.
Over time, tracing is shifting from something teams opt into to something platforms provide by default. The emphasis moves away from collecting traces and toward using them automatically to detect problems earlier and reduce manual debugging.
Final thoughts
As systems grow more distributed, tracing becomes less about tooling and more about visibility. Logs and metrics still matter, but they can’t explain request-level behaviour on their own. Traces fill that gap by preserving context end to end.
Teams get the most value from tracing when they start small, focus on critical paths, and treat instrumentation and sampling as ongoing work. Done well, tracing shortens debugging cycles, improves incident response, and reduces guesswork when systems behave in unexpected ways.
At scale, distributed tracing isn’t just a debugging aid. It becomes a core part of how teams understand, operate, and improve modern systems.
FAQ's
-
No. Tracing is most common in microservices, but it’s useful anywhere requests cross process or service boundaries. Even small systems can benefit once async processing or external dependencies are involved.
-
Tracing adds some overhead, but it’s usually small when implemented correctly. Most performance issues come from over-instrumentation or poor sampling, not from tracing itself.
-
APM often focuses on monitoring individual services, transactions, and performance metrics. Distributed tracing focuses on how requests flow across services. Many modern platforms combine both, but the concepts solve different problems.
-
Not always. For simple systems, logs and metrics may be enough. Tracing becomes valuable when debugging spans multiple services or when latency and reliability issues are hard to explain with existing signals.