TL;DR (QUICK ANSWER)
Observability explains what’s happening inside a system when something fails. It connects logs, metrics, and traces so teams can follow request paths, identify root causes, and resolve issues faster. In distributed architectures, monitoring alone isn’t enough.
Modern applications are no longer simple, single-server setups. Today, your systems are likely to run in the cloud, utilize microservices, scale automatically, and rely on third-party services. While this speeds up development, it also makes failures much harder to understand.
When something breaks, the root cause is rarely obvious. An issue in one service can manifest elsewhere entirely. In these complex environments, traditional monitoring starts to fall short. It relies on predefined metrics like CPU usage, memory, or uptime signals that can tell you that something is wrong, but not why it’s happening.
This is why observability has become so important for modern systems.
With observability, you can follow requests across services, understand dependencies, and spot unusual behavior before it turns into a major outage.
In this guide, you’ll learn what observability really means, how it’s different from traditional monitoring, and how it helps you troubleshoot faster, reduce downtime, and run modern systems with confidence.
Key takeaways
- Observability goes beyond monitoring by explaining why issues occur, not just detecting them.
- It relies on correlated telemetry: logs, metrics, traces, events, and high-cardinality data.
- Distributed systems require dynamic exploration, not static dashboards.
- Observability improves MTTR, reduces downtime, and supports safer deployments.
- Modern architectures like microservices, Kubernetes, and serverless demand deeper visibility.
- A structured implementation approach keeps observability practical and cost-aware.
- Future trends include AI-driven anomaly detection, predictive models, and tighter security integration.

What is observability?
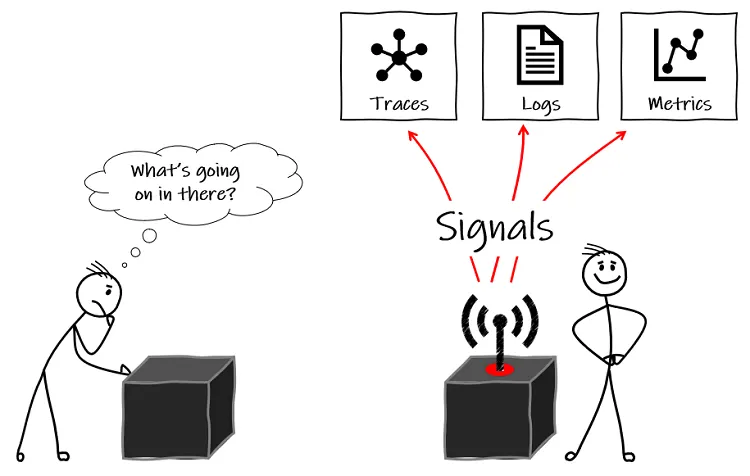
Observability is the ability to understand a system’s current state based on the data it produces, mainly logs, metrics, and traces. Instead of treating your system like a black box, these signals let you see what’s happening inside it, not just whether it’s up or down.
In simple words, observability helps you understand your system from the outside. When something goes wrong, you can quickly see what changed, which part of the system is affected, and how different components are interacting.
Why observability matters in modern systems
In cloud-native and distributed environments, problems are rarely simple or isolated. Observability gives you the context you need to understand complex behavior and respond effectively when things go wrong.
- Discover unknown unknowns
In distributed systems, failures don’t always follow predictable patterns. Observability lets you investigate issues you didn’t plan for, without needing predefined alerts for every possible problem. - Gain deep visibility into internal system behavior
Observability helps you understand what’s happening inside each service, dependency, and request path. - Connect cause and effect across your system
Rather than just knowing that an error occurred, you can trace it back to the exact change, service, or dependency that caused it. - Troubleshoot faster with less guesswork
With the right signals in place, you spend less time guessing and more time fixing, reducing downtime and improving reliability as your system scales.
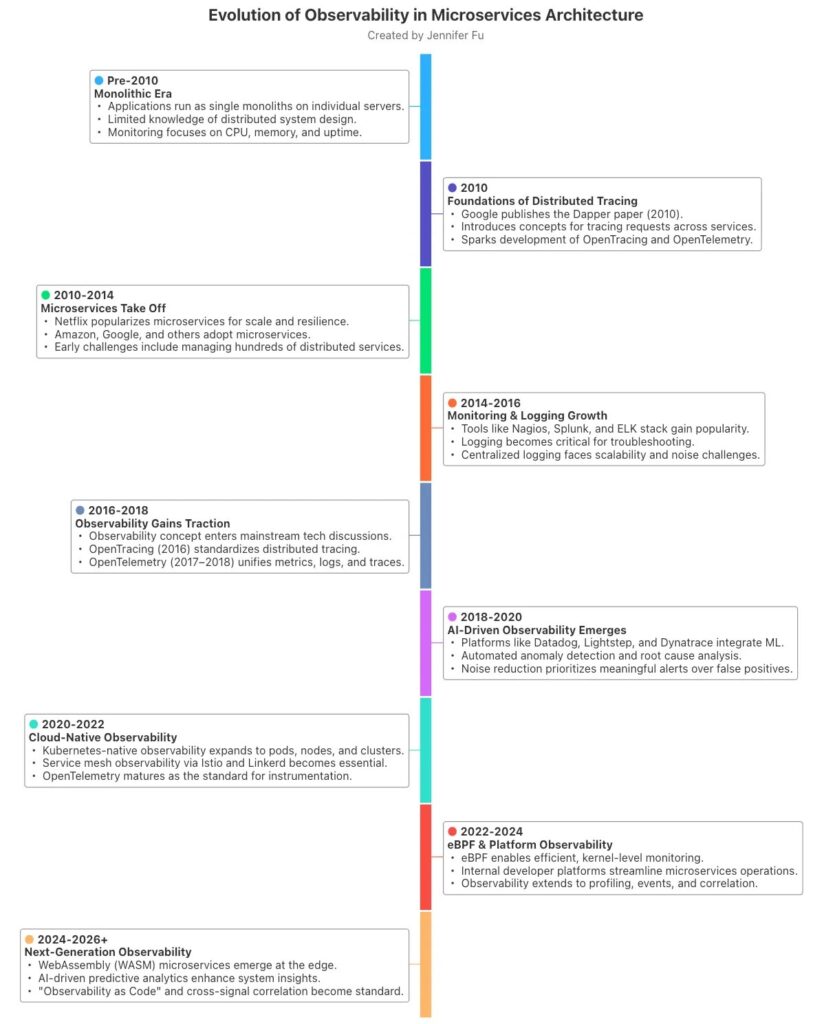
The evolution from monitoring to observability
Traditional monitoring was designed for simpler systems. You defined a fixed set of metrics, built dashboards, and waited for alerts to fire. This worked well when systems were predictable, and failures were easy to spot. As architectures became more complex, this approach started to fall apart. If an issue didn’t match a predefined alert, monitoring could only tell you that something was wrong, not why.
For example, CPU and memory might look fine, yet users are still experiencing slow page loads or failed checkouts.
Microservices made this even harder. A single user request might pass through an API gateway, multiple backend services, a message queue, a database, and a third-party API. A slowdown in one downstream dependency can cause errors somewhere else entirely.
In this world, knowing that a service is “up” isn’t enough; you need to understand how requests move through the system and how services depend on one another.
This gap is what drove the shift from reactive monitoring to exploratory observability.
Instead of relying on predefined checks, observability lets you ask new questions when something unexpected happens. When an alert fires, you can follow the request path, see where latency was introduced, and understand which service or dependency caused the issue.
Tip: Curious how observability differs from monitoring? Explore our detailed blog.
As systems evolved, observability tools evolved alongside them. Modern platforms bring metrics, logs, and traces together and automatically correlate signals across services. This means you can move from an alert straight to the affected request, service, and dependency. This cuts investigation time dramatically and makes root-cause analysis far more reliable.
Static dashboards vs. dynamic exploration
Static dashboards show only what you expected to look for in advance. They work on known issues, like a server running out of disk space, but they struggle with new or complex problems. When something unusual happens, those dashboards often raise more questions than answers.
Observability shifts you toward dynamic exploration. Instead of staring at fixed graphs, you can drill into live data, filter by user, region, or request, and trace a problem across services in real time. Debugging becomes less about guessing and more about discovery, exactly what modern, distributed systems demand.
The core telemetry signals of observability
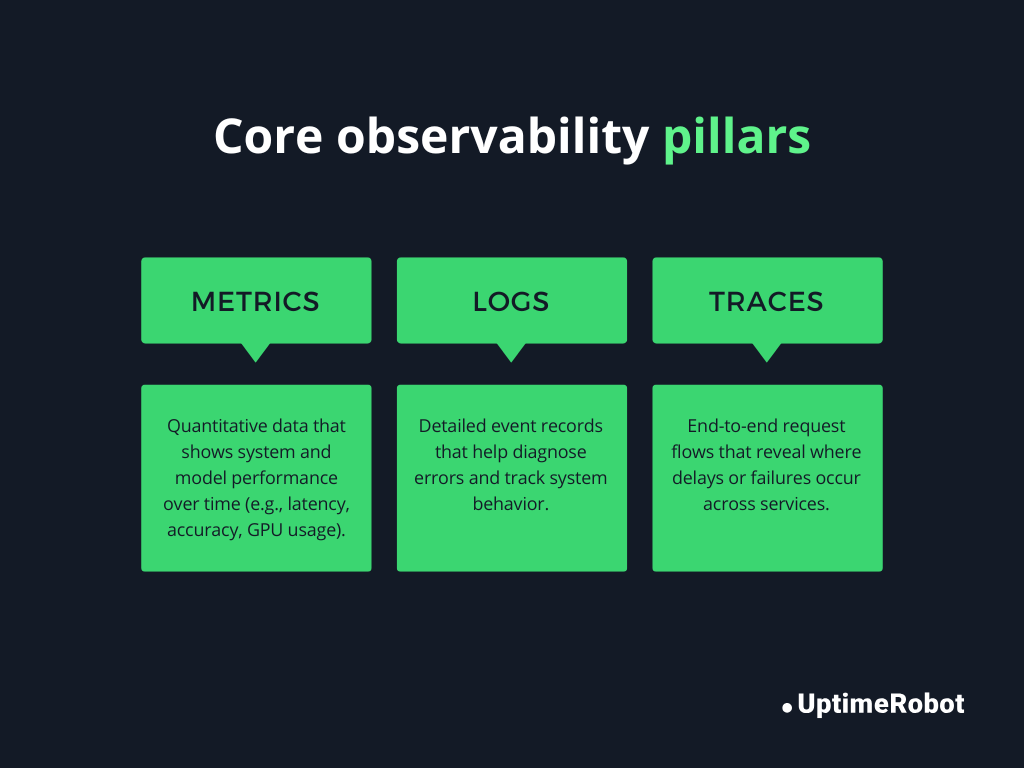
Observability relies on collecting rich signals from your system so you can understand what’s happening, why it’s happening, and how to fix it. These signals are often referred to as telemetry, and the core pillars are logs, metrics, and traces, but modern observability goes beyond these three. We will discuss the three telemetry pillars and beyond.
Logs
Logs are time-stamped records of events happening inside your system. They tell you what happened and can include details like error messages, user IDs, or transaction data.
Structured logs take this a step further by formatting logs as key-value pairs or JSON. This makes them easier to search, filter, and analyze across multiple services. By correlating logs from different services, you can follow a single request end-to-end, helping you understand where and why it failed.
Metrics
Metrics are numerical measurements that track system performance over time. Examples include CPU usage, memory consumption, or request rates. Metrics are often aggregated into SLIs (Service Level Indicators) that measure reliability, latency, and error rates.
Monitoring these performance indicators, you can quickly spot trends and anomalies, like a slow database query or an unexpected spike in error rates. Metrics give you a high-level view of system health and help you identify when to dig deeper.
Traces
Traces show the path of a request as it moves through multiple services. They help you understand how different components interact and pinpoint latency or failures.
For example, if an API request takes longer than expected, tracing lets you see exactly which service or database call caused the slowdown. This makes finding root causes in complex, distributed systems much faster.
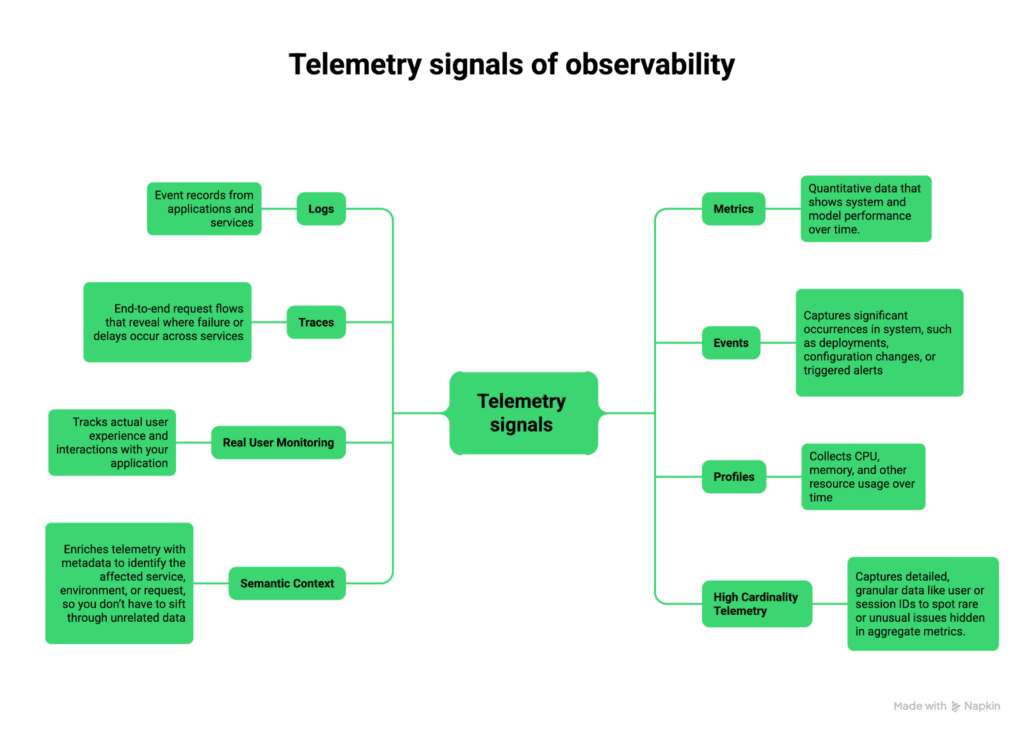
Beyond the three observability pillars
While logs, metrics, and traces form the foundation of observability, modern systems require additional signals to fully understand complex behavior. These extra signals give context, detail, and actionable insight that the core pillars alone can’t provide.
Events
Events capture significant occurrences in your system, such as deployments, configuration changes, or triggered alerts. They help you understand why something changed or failed.
For instance, if a spike in errors coincides with a recent deployment, events provide the context needed to pinpoint the cause.
Real user monitoring (RUM)
RUM tracks how actual users experience your application. It records front-end performance, page load times, and interaction delays. It surfaces usability issues that don’t show up in backend metrics, including sluggish checkout flows and lagging dashboards.
Profiles
Profiling collects CPU, memory, and other resource usage over time. This data helps optimize performance, identify bottlenecks, and detect issues such as memory leaks or inefficient code paths.
For instance, a microservice consuming steadily increasing memory can be identified before it causes a crash.
Semantic context
Adding metadata to telemetry, like service name, region, request type, or user ID, makes it easier to filter, correlate, and understand signals.
Semantic context ensures that when you investigate an issue, you know which service or environment is affected, instead of hunting through unrelated data.
High cardinality telemetry
High cardinality means capturing detailed, granular data, such as individual user IDs, session IDs, or transaction IDs. It surfaces edge-case problems that aggregate metrics tend to hide.
For example, you could spot that a single user’s transaction fails due to a specific combination of inputs, even if 99% of requests are successful.
Observability vs. monitoring vs. APM vs. data observability
Here’s a clear comparison to understand how these approaches differ and complement each other:
| Feature | Monitoring | Observability | APM (Application Performance Monitoring) | Data Observability |
| Purpose | Detect known issues and confirm system health | Understand why issues occur and explore unknown problems | Track application performance, latency, and user transactions | Ensure data quality, reliability, and pipeline health |
| Data collected | Predefined metrics, alerts | Logs, metrics, traces, events, high-cardinality telemetry | Traces, metrics, error rates, transaction details | Data lineage, freshness, quality metrics, schema changes |
| Use cases | Uptime monitoring, threshold alerts, resource tracking | Debugging unknown failures, root cause analysis, and system exploration | Slow requests, transaction bottlenecks, and SLA tracking | Detect broken pipelines, missing or corrupted data, and improve analytics reliability |
| Examples | Nagios, Zabbix, CloudWatch metrics, UptimeRobot | Prometheus + Grafana, Datadog, New Relic, OpenTelemetry | AppDynamics, Dynatrace, New Relic APM | Monte Carlo, Bigeye, Soda, Databand |
| Limitations | Reactive, limited insight into root cause, can’t handle unknown unknowns | Requires instrumentation and expertise, higher data volume | Focused on performance, may not capture system-wide behavior | Only covers data systems, doesn’t provide full application visibility |
Why observability matters for modern architectures
Modern applications are no longer monolithic; they span multiple services, platforms, and environments.
Microservices
In microservices architectures, a single user request often passes through many services. If one service slows down or fails, it can cause a ripple effect across the system. Observability helps you map dependencies between services, identify bottlenecks, and quickly isolate failures without disrupting unrelated parts of the system.
Kubernetes
Kubernetes introduces dynamic scaling, self-healing, and ephemeral workloads, which makes it powerful but also more complex to observe. Pods and containers can be created, terminated, or rescheduled across nodes at any time. Services may move, scale up or down, and depend on multiple underlying resources.
Observability in Kubernetes allows you to track system behavior in real time and understand how workloads interact, and measure the impact of scaling events or resource limits.
Serverless
Serverless functions spin up on demand and often last only milliseconds. Traditional monitoring struggles to capture these short-lived executions. Observability provides detailed tracing and metrics, helping you understand performance, latency, and resource usage across ephemeral functions.
Hybrid and multi-cloud
When your infrastructure spans multiple clouds or on-premises systems, understanding dependencies and change impact becomes critical. Observability lets you map interactions across environments, spot cross-cloud issues, and ensure that changes in one environment don’t unexpectedly break others.
By giving you deep visibility into dependencies, failure points, and the effects of changes, observability ensures you can run modern, distributed architectures reliably and respond to issues quickly before they affect users.
Business and operational benefits of observability
Observability directly impacts your business and operations by providing deep visibility into your systems, enabling faster, smarter decisions and minimizing the impact of failures.
- Faster MTTR: Identify the exact service, dependency, or change causing an issue without digging through disconnected logs.
- Reduced downtime: Detect abnormal behavior early and isolate failures before they cascade across services.
- Better customer experience: Catch slow pages, failed transactions, and latency spikes before they impact users.
- Higher engineering productivity: Spend less time firefighting and more time shipping features.
- Cost optimization: Identify overprovisioned resources and inefficient workloads to limit cloud spend.
- Lower deployment risk: Understand the impact of changes in real time and roll back quickly when needed.
Sample KPI table to measure the benefits of observability
| KPI | Before observability | After observability | Impact |
| MTTR | 4 hours | 45 minutes | 89% faster resolution |
| Downtime per month | 6 hours | 1 hour | 83% reduction |
| Failed user transactions | 200/day | 50/day | 75% improvement |
| Time spent on firefighting | 30% of engineering time | 10% of engineering time | 66% productivity gain |
How observability works in practice
Observability works through a series of practical steps that turn raw system activity into actionable insights. Here’s how it happens:
Instrumentation
Everything starts with instrumentation. You add code, agents, or libraries to your services to collect data like logs, metrics, traces, and other signals. This ensures every request, event, and resource usage is recorded.
Data ingestion
Once data is collected, it needs to be sent to a central platform for storage and analysis. Data ingestion pipelines handle this efficiently, even at large scale, so you can access logs, metrics, and traces in near real time.
Correlation
Correlation links metrics to logs and traces, and ties events across services together. For example, it can show how a spike in errors relates to a slow database query or a recent deployment, helping you see the full chain of cause and effect.
Visualization
Dashboards, graphs, and heatmaps turn telemetry into meaningful insights. They let you spot trends, anomalies, and patterns at a glance, and make it easy to explore system behavior interactively.
Alerting
Unlike traditional monitoring, these alerts are context-aware and tied to correlated signals, reducing noise and letting your team focus on the issues that really matter.
Root cause analysis
With correlated and visualized data, you can quickly find the root cause of problems. You can trace a failed request across services, identify the exact component causing latency, and determine which change or dependency triggered the issue.
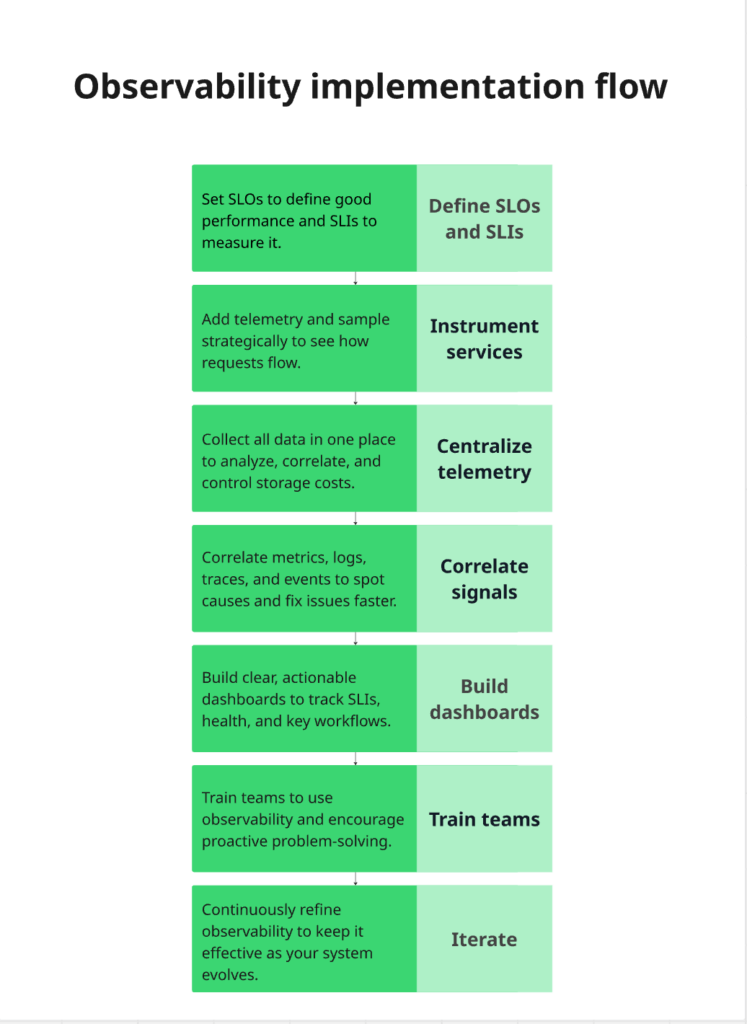
A practical observability implementation framework
Implementing observability doesn’t have to be overwhelming. You can take a structured, step-by-step approach to gain clear visibility into your systems while keeping costs and complexity under control.
1. Define SLOs and SLIs
Set Service Level Objectives (SLOs) to define what “good performance” means for your users. Select Service Level Indicators (SLIs) to track progress toward these goals.
Example:
- SLO: 99.9% uptime for your API.
- SLI: Percentage of successful API requests over 30 days.
This focus helps you monitor what truly matters instead of tracking every metric blindly.
Tip: Check out our post on SLOs vs. SLAs vs. SLIs to learn more.
2. Instrument services
Add telemetry to your services, logs, metrics, traces, and other signals. Decide what to sample and how frequently to avoid overwhelming your system. With that visibility, you can trace requests across services and pinpoint delays or failures.
Example:
- Add distributed tracing to track requests across microservices.
- Include structured logs for key operations, like user login or payment processing.
3. Centralize telemetry
Collect all your data in one platform or data store. Centralization allows you to query, correlate, and visualize signals from different services, environments, and teams in one place. Set data retention policies to balance historical insights with storage costs.
Example:
- Send logs from your app servers, metrics from your Kubernetes cluster, and traces from your APIs to a single dashboard in Grafana or Datadog.
- Retain 30 days of logs for investigation while aggregating older data to save storage costs.
4. Correlate signals
Connect metrics, logs, traces, and events so you can see cause and effect across your system. Correlation helps you identify dependencies, isolate failures, and cut the time it takes to resolve incidents.
5. Build dashboards
Create dashboards that reflect your SLIs, system health, and key workflows. Keep them actionable and easy to read, so your team can quickly spot trends, anomalies, or potential issues.
6. Train teams
Provide training on querying data, investigating incidents, and interpreting dashboards. Encourage a culture of proactive problem-solving instead of constant firefighting.
7. Iterate
Regularly refine what you measure, improve instrumentation, adjust sampling, and optimize costs. Review dashboards, alerts, and SLOs frequently to make sure your observability evolves with your system.
Following this framework helps you build observability without losing control of cost or complexity.
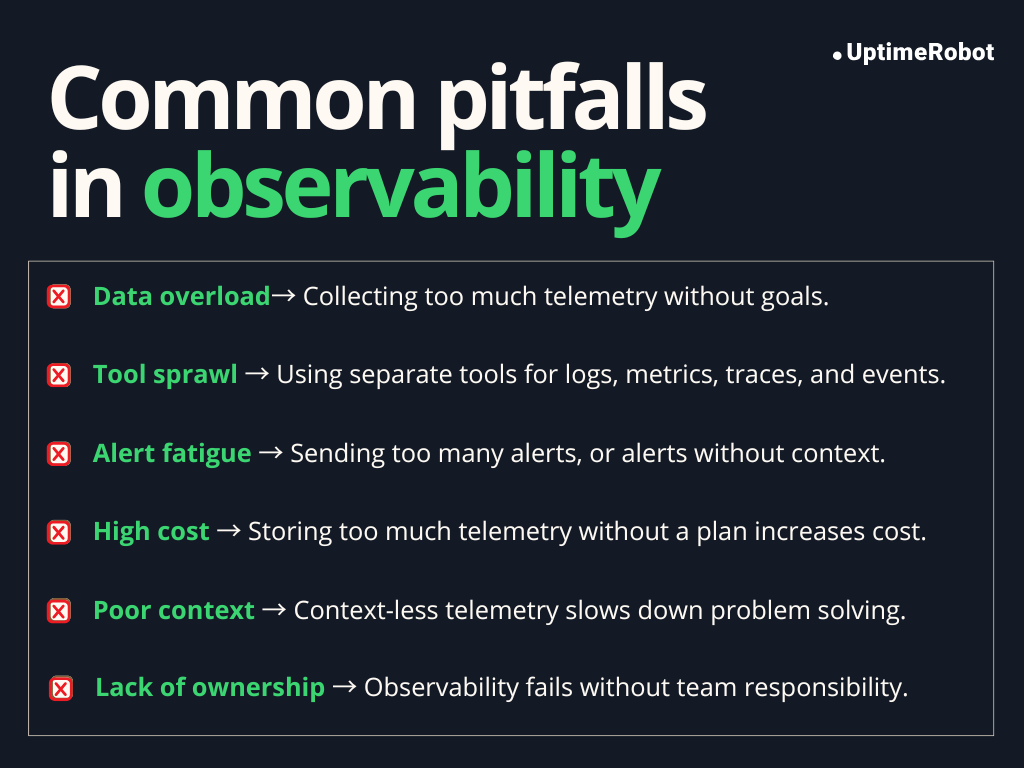
Common challenges and pitfalls
Observability can be extremely valuable, but it comes with potential pitfalls. Being aware of these challenges and how to address them can save your team time, money, and frustration.
Data overload
Collecting too much telemetry can be overwhelming. Without clear goals, it’s easy to get lost in a sea of logs, metrics, and traces.
Solution: Focus on the most important signals tied to your SLOs. Use sampling, aggregation, and filtering to reduce noise while retaining enough detail to troubleshoot effectively.
Tool sprawl
Using separate tools for logs, metrics, traces, and events can create silos and make correlation difficult. Teams spend more time switching platforms than solving problems.
Solution: Consolidate observability data into a single platform where possible, or ensure integrations are seamless. Unified dashboards and cross-tool correlation improve efficiency and reduce friction.
Alert fatigue
Too many alerts, or alerts without context, can desensitize teams. Important issues may be ignored if notifications are constant or unclear.
Solution: Tune alert thresholds, correlate signals, and focus on actionable alerts. Include context in notifications, like affected service, environment, or request ID, so teams know exactly what to address.
High cost
Ingesting and storing massive amounts of telemetry without a strategy can be expensive, especially at scale.
Solution: Implement sampling, aggregation, and retention policies. Track the cost of data ingestion and storage, and balance detail with affordability.
Poor context
Telemetry without context, like which service, deployment, or user caused an issue, limits usefulness and slows down troubleshooting.
Solution: Enrich signals with metadata (semantic context). Include information like service name, region, version, or user/session ID to make debugging faster and more accurate.
Lack of ownership
Observability is a team effort. Without clear responsibility, dashboards, instrumentation, and alerts may become outdated, incomplete, or ignored.
Solution: Assign clear ownership for instrumentation, dashboards, and alerts. Make observability part of development and operations processes, with accountability for maintaining and improving it over time.
Observability use cases
Observability powers a wide range of operational and business benefits. Here are the key ways it’s used in practice:
Incident response
When something breaks, observability helps teams find the root cause fast. By correlating logs, metrics, and traces, you can see exactly where a failure started and how it spread.
Example:
An e-commerce company notices a spike in checkout failures during a sale. Observability traces show requests timing out at a payment service due to a slow third-party API. The team quickly reroutes traffic and restores service, reducing lost revenue and downtime.
Performance optimization
Observability makes performance bottlenecks visible. You can identify slow services, inefficient queries, or resource-heavy operations and fix them before users are impacted.
Example:
A SaaS analytics platform finds that dashboard load times increase as customer data grows. Traces reveal a single database query causing delays. After optimizing the query and caching results, page load times improve significantly.
Security threat detection
Unusual patterns in logs, metrics, or user behavior can indicate security threats. Observability helps detect anomalies early and investigate suspicious activity quickly.
Example:
A fintech company notices a sudden increase in failed login attempts from a specific region. Observability data highlights abnormal request patterns, allowing the security team to block the source and prevent a potential account takeover.
Capacity planning
Tracking resource usage over time helps teams understand growth patterns and plan scaling needs accurately.
Example:
A video streaming service uses observability metrics to analyze traffic spikes during major events. This data helps them scale infrastructure ahead of time, avoiding buffering issues while preventing unnecessary over-provisioning.
Release validation
Observability allows teams to monitor the impact of deployments in real time. You can quickly detect errors, regressions, or performance issues introduced by a release.
Example:
A retail app deploys a new search feature. Observability dashboards show increased latency and error rates immediately after release. The team rolls back the change within minutes, preventing a poor shopping experience.
User experience monitoring
Observability tracks real user interactions to reveal slow page loads, failed transactions, or region-specific issues.
Example:
A global travel website uses real user monitoring to detect slower page loads for users in Asia. Observability data points to a CDN configuration issue, which is fixed to restore consistent performance worldwide.
Common problems and how observability solves them
| Problem | Solution |
| Slow system performance | Traces and metrics pinpoint bottlenecks and high-latency services |
| Unknown outages or errors | Correlating logs, metrics, and events reveals the root cause quickly |
| High MTTR (Mean Time to Resolution) | Rich telemetry and dashboards speed up incident investigation |
| Resource overuse or inefficiency | Metrics and profiling show CPU, memory, and resource usage trends |
| Poor user experience | Real user monitoring uncovers frontend and backend performance issues |
| Security incidents | Observability highlights unusual patterns in logs, metrics, and user behavior |
| Difficulty understanding the impact of changes | Deployment events and signal correlation show how changes affect the system |
The future of observability
Observability is becoming smarter, more predictive, and closely tied to real business outcomes. Below is a clear look at what’s coming next and why it matters, with supporting data where available.
AI-driven anomaly detection
In the future, many critical systems will depend on AI-driven workloads running on complex infrastructure. Failures in these environments are often subtle and don’t always cross fixed thresholds.
To keep up, observability platforms will increasingly use AI to monitor AI. This will help in spotting unusual patterns in logs, metrics, and behavior before they turn into outages.
For example, an AI agent can continuously analyze logs, learn what “normal” looks like, and flag anomalies as soon as something changes. That agent can then work with other automated systems to investigate the issue or trigger remediation, helping teams reduce downtime and improve mean time to repair (MTTR).
Predictive observability
Instead of reacting after something breaks, the next step is to anticipate issues before they impact users. Predictive observability uses historical trends and telemetry to forecast potential failures, capacity bottlenecks, or performance dips.
For example, if latency has been gradually rising before peak usage hours, systems can warn you ahead of time so you can take corrective action.
Analysts predict this shift toward predictive models will continue as observability matures and more organizations aim for proactive reliability.
Security observability
More teams are using observability data to strengthen their security posture. By analyzing signals from applications, infrastructure, networks, and user behavior in one place, security issues can be detected earlier and investigated with better context.
This approach also improves collaboration across teams. Splunk’s State of Observability 2025 report shows that 64% of organizations see fewer customer-impacting incidents when observability and security teams work closely together.
As a result, many organizations are adopting unified platforms that combine IT and security analytics, making it easier to spot threats and respond quickly before users are affected.
Edge and IoT observability
The enterprise IoT market reached USD 324 billion in 2025 and is growing rapidly. More organizations are moving from simple connected devices to autonomous, data-driven operations. These systems rely on constant telemetry from sensors, gateways, and edge devices to function properly.
As computing shifts closer to users and devices, observability must follow. Future tools will provide real-time insight into highly distributed, resource-constrained environments.
Business observability
Observability is expanding beyond IT to directly impact business outcomes. According to Splunk’s State of Observability 2025 report, 65% of respondents state that observability positively impacts revenue, and 64% say it influences product roadmaps.
By linking system behavior with KPIs like user engagement, revenue, and churn, teams can make smarter decisions that drive growth.
For example, observing slow checkout performance and connecting it to revenue loss helps prioritize backend improvements with direct business impact.
As more organizations adopt this approach, observability is evolving from a purely technical tool into a strategic asset that guides both engineering and business decisions.
Conclusion
Observability has become essential for modern systems, giving teams the ability to understand complex architectures, trace issues, and act with confidence. As systems grow more distributed and dynamic, observability itself is evolving.
The next generation of tools will be smarter, more predictive, and capable of handling everything from AI-driven workloads to edge devices and IoT networks, while also integrating security and real-time telemetry across all layers of your infrastructure.
Embracing observability helps teams to navigate this complexity, respond to incidents faster, and maintain reliable, high-performing systems now and in the future.
FAQ's
-
Monitoring tells you that something is wrong by tracking predefined metrics and triggering alerts. Observability goes deeper; it helps you understand why something is happening by collecting and correlating logs, metrics, traces, and other signals across your system.
-
In microservices, a single request often touches multiple services and dependencies. Observability helps you map these interactions, identify bottlenecks, isolate failures, and trace issues end-to-end, tasks that traditional monitoring alone cannot handle.
-
The three core pillars are: Logs, metrics, and traces. Logs capture events, metrics track performance over time, and traces show request flows across services.
-
No. While DevOps and SRE teams benefit the most, observability also supports developers, security teams, and business stakeholders by providing insights into performance, reliability, security, and user experience.
-
By giving visibility into system behavior and enabling root cause analysis, observability helps teams detect anomalies early, troubleshoot faster, and prevent small issues from cascading into major outages.
-
Observability tools often combine metrics, logs, traces, and dashboards in a single platform. Examples include Prometheus, Grafana, OpenTelemetry, Datadog, New Relic, and Splunk. These tools help collect, correlate, and visualize telemetry efficiently.
-
Yes. Observability allows you to detect unusual patterns, trace suspicious activity, and investigate security incidents across services. It adds context to alerts, helping teams respond quickly to potential threats.