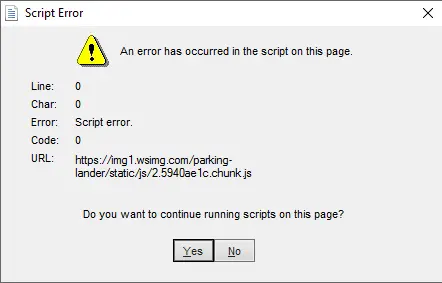
You open the browser console and all you get is:
Script error.
No filename, no line number, no stack trace. Just a dead end.
This happens when JavaScript fails inside a script that’s loaded from a different origin (like a CDN or a third-party widget). The browser hides the details for security reasons, so instead of a real error message you get this vague one.
The result: something on the page is broken, but you have no clue where to start.
This guide explains why “Script error.” happens, how to get real debugging information back, and how to prevent it from happening in production. We’ll walk through common causes, practical fixes, and real-world scenarios with fixes.
Key takeaways
- “Script error.” happens when the browser blocks error details for cross-origin scripts
- Add
crossoriginand correct CORS headers to get real stack traces - Third-party scripts are the most common source
- Source maps and proper error monitoring make debugging much easier
- You can fix this once and prevent it going forward

What is a script error?
A script error is a JavaScript error that appears in the browser console without useful details, often showing only:
Instead of a stack trace or file reference. It means the browser knows something failed, but it can’t show you where or why.
This usually results in:
- No line number
- No filename
- No context to trace the issue
And the impact is real. Even a small script failure can break:
- Buttons and UI interactions
- Forms and checkout flows
- Embedded widgets or analytics scripts
In short: a script error tells you something went wrong, but not why or what.
Why a script error occurs
A script error usually happens because the browser blocks the real error details, not because the error itself is unusual. The cause is almost always related to how the script was loaded or where it came from.
Here are the main reasons:
1. The script is loaded from a different origin (CORS issue)
If a script is loaded from a different domain, the browser will hide the real error message unless the script is served with the right CORS (Cross-Origin Resource Sharing) headers.
Example scenario:
- Your site loads a script from https://cdn.example.com
- The CDN (Content Delivery Network) does not include
Access-Control-Allow-Origin
The browser shows only: Script error.
This is a same-origin policy restriction, not a bug.
2. The script failed to load entirely
If the file 404s, times out, or is blocked (ad blockers, privacy extensions), the browser may report a script error with no details.
Common causes:
- CDN outage
- Incorrect script path
- Browser extensions blocking analytics or tracking scripts
In these cases, the script never ran, so there is no stack trace to show.
3. The script is minified or obfuscated (and source maps are missing)
If the script is minified, an error might technically have a stack trace, but it won’t mean anything without source maps.
Example:
TypeError at p.a.b()
Becomes:
TypeError at updateWidget()
only if source maps are available.
4. Inline scripts swallow errors silently
If an inline <script> catches errors without logging them properly, you lose context.
try {
  initApp();
} catch (e) {
  console.log("Something went wrong");
}
This hides the real cause.
Basically, the browser knows something went wrong, but the details are blocked due to cross-origin rules, missing source maps, or swallowed exceptions.

When a script is loaded from another domain, the browser’s security policy blocks the real error details. Without CORS + crossorigin, all you see is the generic “Script error.“.
How to fix the “script error”
To get real error details instead of the generic “Script error.“, the script must be loaded with the crossorigin attribute, and the server hosting the script must send the correct CORS headers.
1. Add the crossorigin attribute to the script tag
<script src="https://cdn.example.com/app.js" crossorigin="anonymous"></script>Use anonymous unless the script needs cookies or auth.
If it does, use:
<script src="https://cdn.example.com/app.js" crossorigin="use-credentials"></script>2. Add CORS headers on the server hosting the script
Node.js / Express
app.use((req, res, next) => {
  res.header("Access-Control-Allow-Origin", "https://yourdomain.com");
  next();
});
NGINX
add_header Access-Control-Allow-Origin https://yourdomain.com;Apache
Header set Access-Control-Allow-Origin "https://yourdomain.com"3. If it’s a third-party script, and you can’t change the server
You have options:
- Host the script on your domain (if the license allows)
- Proxy it through your server and apply CORS
- Replace the script with one that supports CORS
- Remove it if it isn’t critical
4. Make sure source maps are available in production
If the script is minified, include source maps so stack traces point to real code.
//# sourceMappingURL=app.js.map5. Use an error monitoring tool that supports cross-origin reporting
Tools like Sentry, Bugsnag, or Raygun can capture full stack traces if:
- The script is loaded using
crossorigin - The hosting server sends correct CORS headers
- Source maps are available
Once these are in place, the browser will start showing full error details again, and your debugging workflow returns to normal.
Tip: You can monitor whether scripts and endpoints are reachable using UptimeRobot’s ping monitoring.
Real-world examples of script error fixes
We’ve created three real-world script error scenarios you’re likely to encounter in the wild, along with how to fix them.
1. Cross-origin script failing on a CDN
A front-end application loaded its main JavaScript bundle from a CDN. When an error occurred inside that script, the console showed only:
Script error.
Because the script came from a different domain and wasn’t loaded with the crossorigin attribute, the browser suppressed the error details.
Fix: Load the script with CORS enabled and configure the CDN to send the appropriate header.
<script src="https://cdn.example.com/app.js" crossorigin="anonymous"></script>
Access-Control-Allow-Origin: *
Once applied, full stack traces returned and debugging became straightforward.
2. Minified bundle without source maps
In a production build, the JavaScript files were minified but the corresponding source maps were not deployed. When a runtime error occurred, the stack trace pointed only to the minified output:
Uncaught TypeError: a is null
    at r (bundle.min.js:1)
Fix: Generate and deploy source maps alongside the minified files so browsers and monitoring tools can map errors back to the original code.
devtool: 'source-map'After source maps were available, the stack trace showed real file names and line numbers, making the error easy to locate and resolve.
3. Third-party script blocked by privacy tools
A page relied on a third-party analytics script. For users with privacy extensions, the script was blocked before loading. This caused related code to fail, and the console reported:
Script error.
Fix: Serve the script through a first-party domain so it loads reliably.
Example proxy configuration:
location /analytics/ {
  proxy_pass https://tracking.example.com/;
}
<script src="/analytics/track.js" crossorigin="anonymous"></script>
Once the script loaded consistently, any real errors produced readable stack traces.
Why this matters
These scenarios reflect the three most common causes of “Script error.“:
- A script is loaded from another origin without proper CORS support
- Minification hides the original source without accessible source maps
- A third-party script is blocked and never executes
Recognizing these patterns makes it easier to restore visibility and debug the underlying issue.
Best practices to prevent script errors
Most script errors are preventable. The key is to make sure the browser can access error details and that your front-end build is easy to debug in production. The practices below reduce noise, improve traceability, and help you catch issues before they affect users, especially if you’re actively trying to learn javascript through production-style debugging.
Load external scripts with crossorigin
Always add the crossorigin attribute when loading scripts from CDNs or third-party domains. This allows the browser (and your monitoring tools) to report full error information instead of masking it.
<script src="https://cdn.example.com/app.js" crossorigin="anonymous"></script>Configure CORS headers on the server
The server hosting the script must send CORS headers to allow error details to be shared. If you control the server, confirm it returns:
Access-Control-Allow-Origin: *If you don’t control the server (e.g., third-party widget), consider self-hosting or proxying it.
Publish source maps with production builds
Source maps convert minified production errors back into readable file names and line numbers. Make sure your build pipeline generates and deploys .map files, and that they are not blocked by the server or firewall.
Monitor third-party scripts and dependencies
If your site relies on external scripts (analytics, chat widgets, A/B testing tools), treat them as part of your application. Monitor their availability and performance, since failures can silently break functionality.
You can track whether external scripts are loading correctly by setting up a keyword or status page monitor
Use error monitoring tools that support cross-origin reporting
Tools like Sentry, Raygun, LogRocket, and Rollbar can capture stack traces and browser context when configured correctly. This is especially useful for catching intermittent or device-specific issues.
In practice: If scripts are loaded with crossorigin, CORS headers are in place, and source maps are deployed, the browser will be able to show full error context rather than “Script error.“.
How to debug “script error” efficiently
The goal is to make the browser show you what actually went wrong, then trace it back to the source.
1. Enable CORS and the crossorigin attribute
If the script is loaded from a different domain, the browser blocks the error message by default. Add the crossorigin attribute when loading it, and make sure the server hosting the script sends the correct CORS headers.
<script src="https://cdn.example.com/app.js" crossorigin="anonymous"></script>Server hosting the script should send:
Access-Control-Allow-Origin: *Once these are in place, the console will show real error messages instead of “Script error.”.
2. Capture errors with better event listeners
window.onerror often gives limited information. Use these listeners instead to log more context:
window.addEventListener('error', (event) => {
  console.log('Script error:', event.message, event.filename, event.lineno);
});
window.addEventListener('unhandledrejection', (event) => {
  console.log('Unhandled promise rejection:', event.reason);
});
Send this data to your monitoring tool or logging endpoint.
3. Use source maps for readable stack traces
Minified code makes errors difficult to trace. Make sure your build generates and publishes .map files so tools like Chrome DevTools or Sentry can map stack traces back to your actual source files.
When using Webpack:
devtool: 'source-map'4. Reproduce the error in a controlled environment
If the error only happens for certain users or devices:
- Try different browsers
- Test with throttled network speeds
- Check if content blockers or privacy extensions are blocking external scripts
- Look at the Network tab to see if any scripts return 404 or 403
Sometimes “Script error.” is just a failed script load hiding behind the scenes.
Tip: You can also monitor and alert on job and task failures using UptimeRobot’s cron job monitoring:
5. Add fallback logging when needed
If you still can’t reproduce the issue, log basic context from the browser:
{
  "message": "Script error",
  "page": "https://yourapp.com/dashboard",
  "userAgent": "Mozilla/5.0",
  "timestamp": 1712345678
}
This helps spot patterns across devices, users, or regions.
Fixing “Script error.” is about restoring visibility. Once the browser can report full error details, debugging becomes straightforward.
Final thoughts
Most “Script error.” messages trace back to missing context: the browser couldn’t show what actually went wrong. By loading external scripts with the crossorigin attribute, configuring the correct CORS headers, and publishing source maps, you restore full visibility into errors and make debugging significantly easier.
Once the error details are available, proactive monitoring becomes the next step. Tracking script loading failures, API errors, and client-side exceptions helps prevent silent breakages from reaching users.
Tools like UptimeRobot can alert you when pages fail to load correctly, when a key script or endpoint starts returning errors, or when response times begin to degrade.
Restoring visibility and adding ongoing monitoring gives your team the context needed to diagnose issues faster, reduce downtime, and maintain a more reliable user experience.
FAQ's
-
“Script error” has no details because the script was loaded from a different domain without the correct CORS headers. When this happens, the browser hides the filename, stack trace, and line number for security reasons.
-
“Script error” does not always mean your code is broken. It usually indicates a loading or origin problem. Once the script is served with the crossorigin attribute and proper CORS headers, the actual underlying error becomes visible.
-
You cannot prevent all script errors, but you can prevent the browser from hiding their details. Using crossorigin, configuring CORS on the server, and publishing source maps allow you to see what went wrong and debug it directly.
-
“Script error” is not a browser bug. It is expected behavior under the same-origin policy. The browser blocks cross-origin error details unless permission is explicitly granted through CORS.