Managing incidents just got a whole lot easier. With our latest update, you get better visibility, smarter filtering, and a seamless way to collaborate with your team – right inside UptimeRobot.
You can now access all incidents in one place under the new Incidents tab in the left sidebar.
FYI: Some of our best improvements come directly from you—like the ability to add comments and make incidents searchable.
We listen and we don’t judge—do you have an idea? Share it or vote for your favorites on our Nolt board!
Smarter filtering and sorting
Find exactly what you’re looking for with new filtering and sorting options:
✅ Filter by status, root cause (timeouts, 2xx, 3xx, 4xx, 5xx codes), or custom tags
✅ Sort by duration or Started/Resolved Newest/Oldest status
✅ Search incidents by monitor name or URL
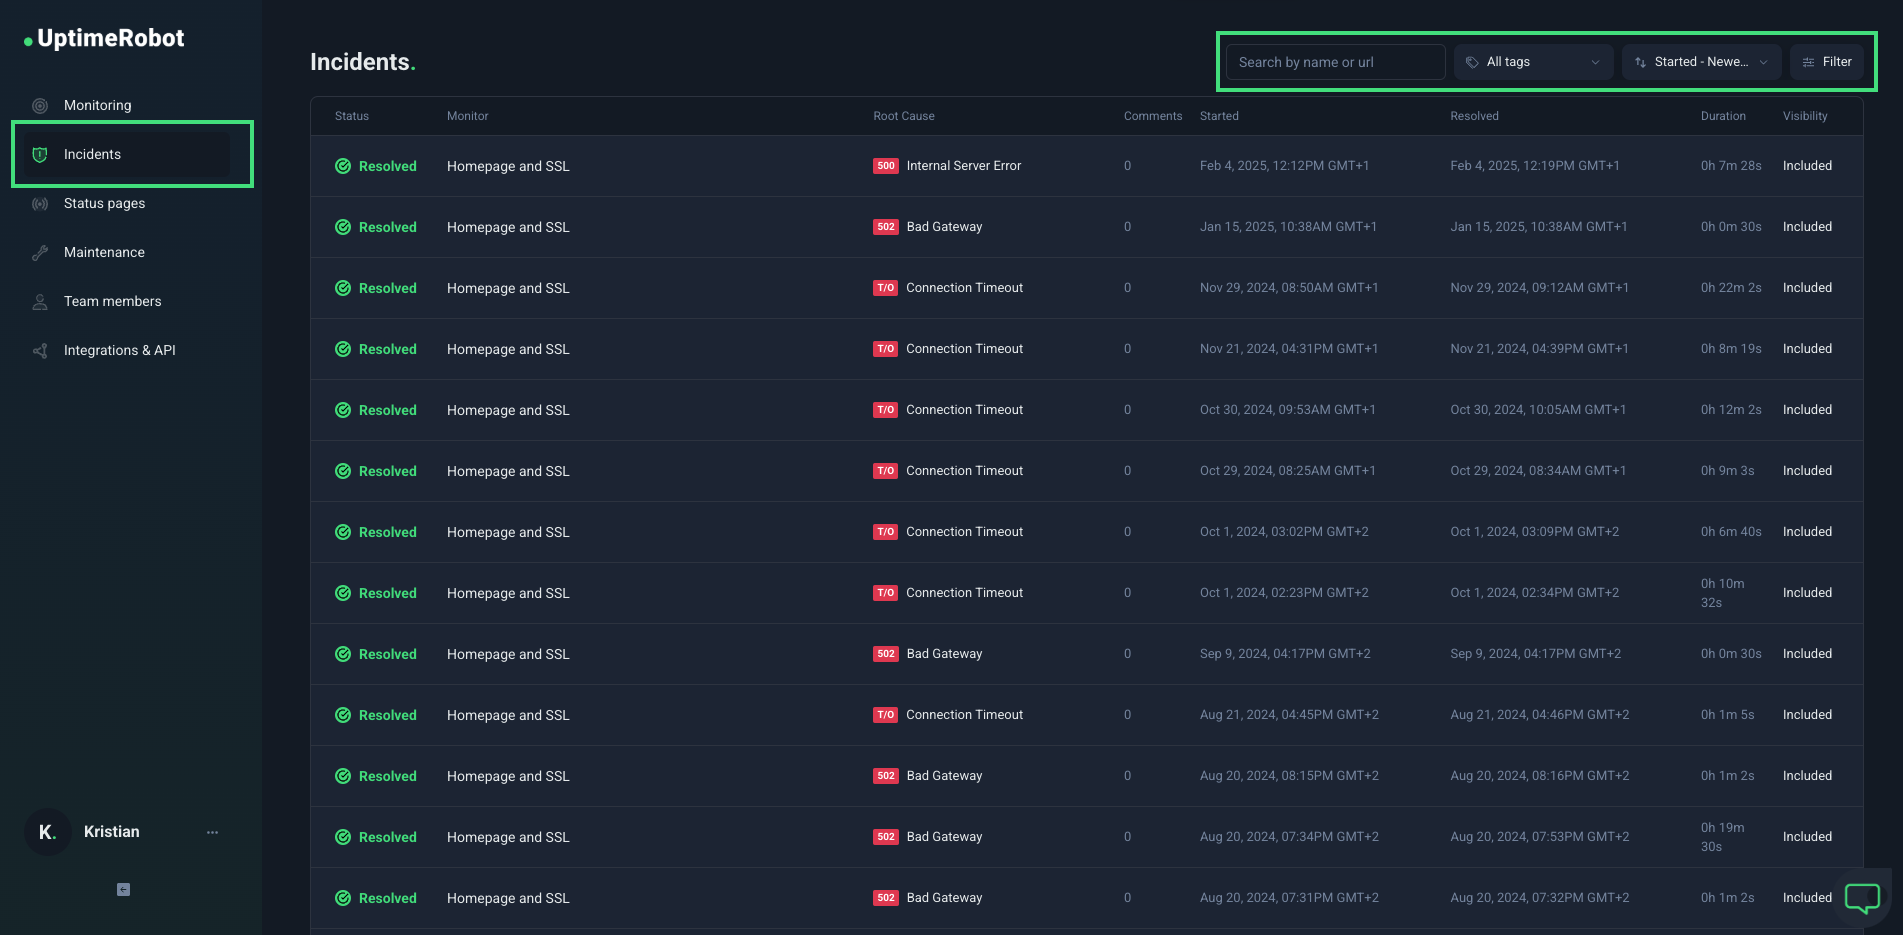
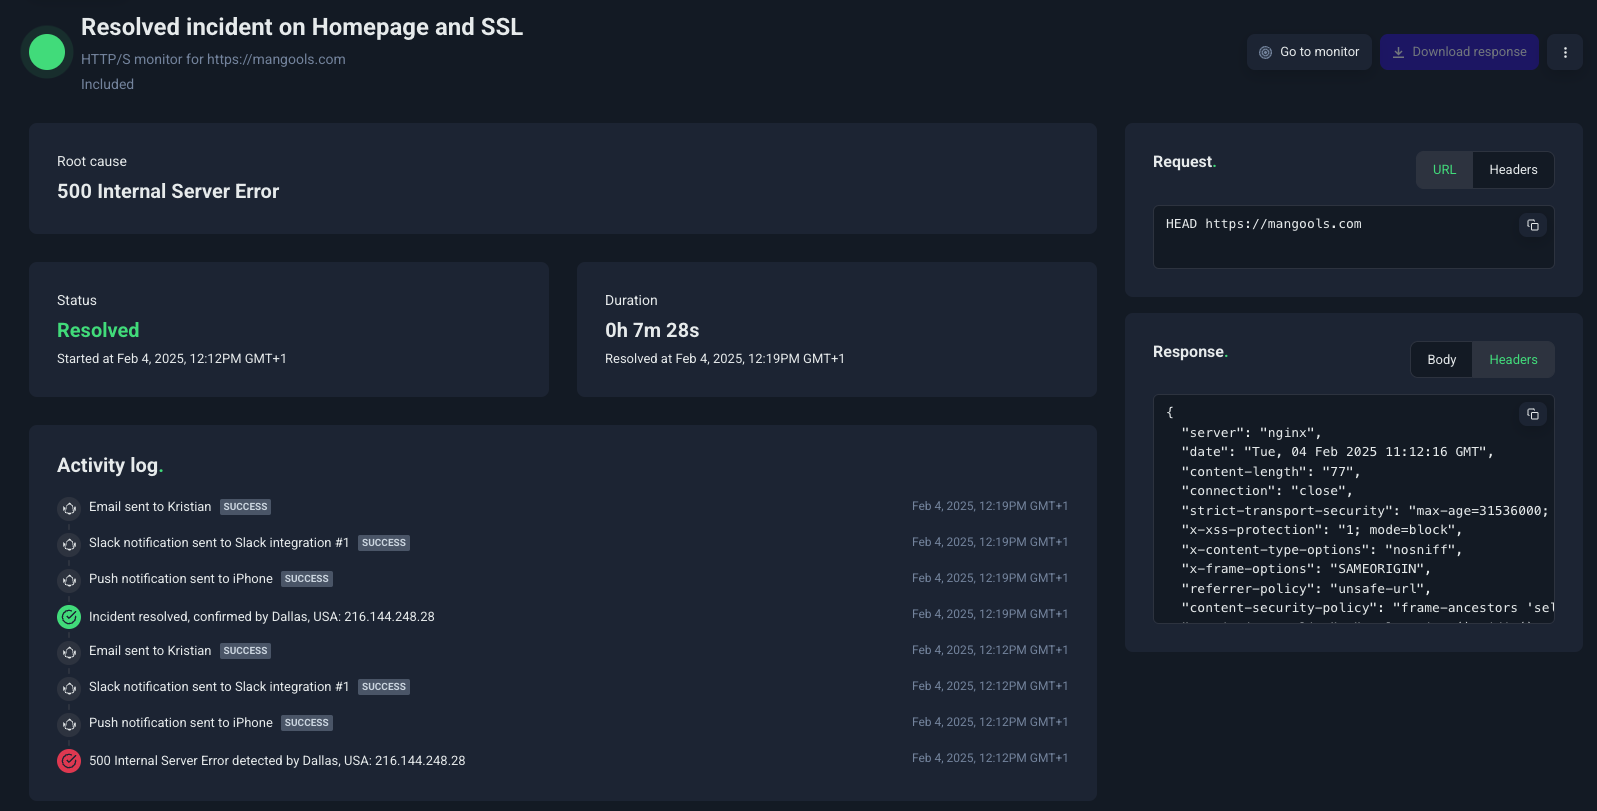
From there, you’ll see an overview of all incidents across all monitors, with the ability to click on each one for detailed insights:
✅ Full request (URL & Headers) and response details (Body & Headers) for better debugging
✅ Root cause, status, and duration at a glance
✅ Activity log history
✅ Comments section – tag colleagues and push comments to your status page as described below
Push comments to your status page
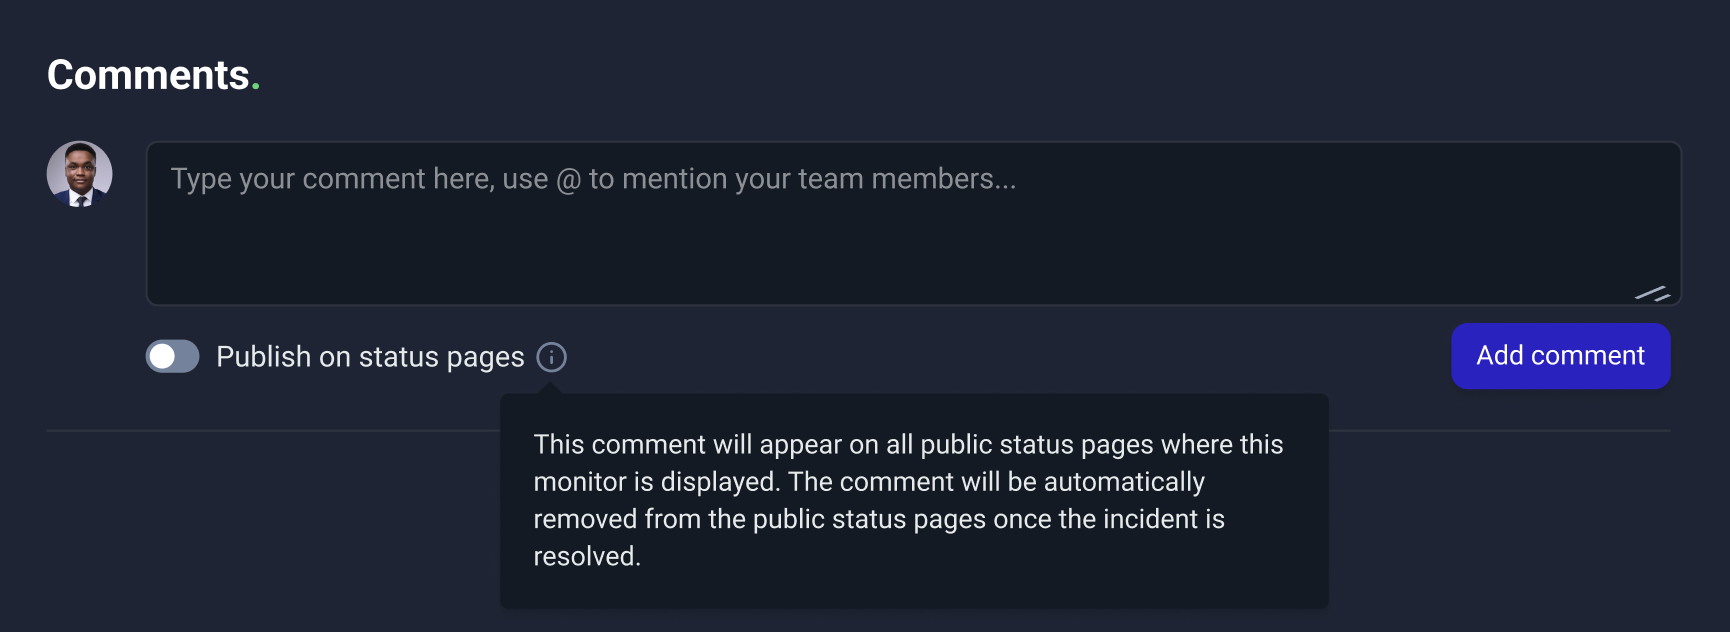
Keep customers informed with just one click. You can push incident comments directly to your status page with a simple toggle from the incident detail page. Once the incident is resolved, the comments disappear automatically.
Tag teammates for faster response
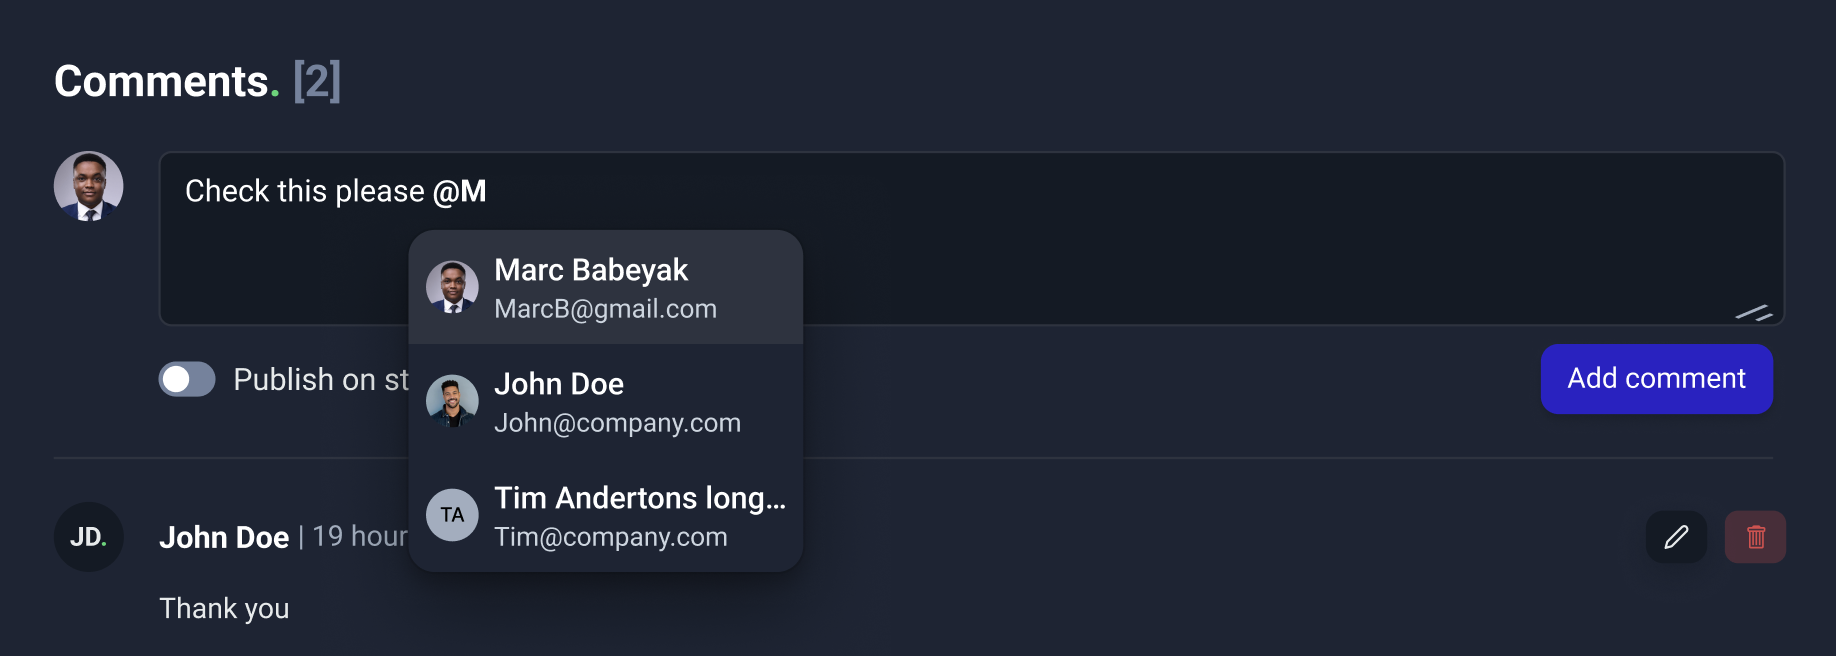
Need someone’s input? Just @mention a team member in the comments, and they’ll get an email notification, ensuring quick collaboration and faster resolutions.
Share your feedback
With this update, we aim to allow more control, better teamwork, and clearer communication.
Stay tuned for more updates this year and let us know how you like the new incident management system, we can’t wait to hear your feedback!