Uptime Kuma is one of the most popular open-source uptime monitors for a reason. It’s simple, free, and takes minutes to deploy. But once multiple people depend on it, the trade-offs become harder to ignore.
Running your own monitoring server, managing backups, and working around limited automation eventually send many teams looking for alternatives.
Key takeaways
- Uptime Kuma’s SQLite setup slows down once monitor counts grow past a few hundred.
- No native REST API makes bulk changes and automation harder than they should be.
- UptimeRobot is the closest hosted swap with 50 free monitors, 5-minute checks, and a public status page included.
- Better Stack adds logs and on-call routing, but pricing rises fast as responders and log volume grow.
- Gatus fits GitOps teams that want YAML-based checks and no UI dependency.
- Healthchecks.io is built for cron and heartbeat monitoring, not full website uptime checks.
- Zabbix is the enterprise pick for large infrastructure, at the cost of a significant setup investment.
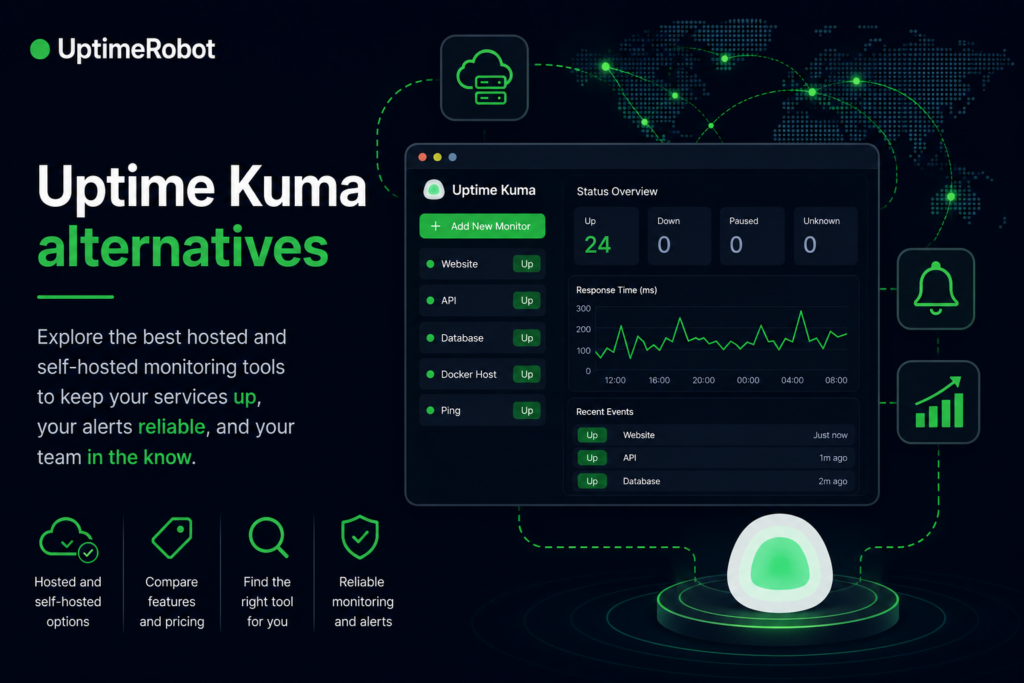
Uptime Kuma alternatives compared
Here’s how the leading alternatives compare.
| Tool | Deployment | Best for | Starting price |
| UptimeRobot | Hosted SaaS | Fast, low-friction move off Uptime Kuma with a generous free tier | Free; paid from around $9/mo |
| Better Stack | Hosted SaaS | Unified monitoring, logs, and on-call in one platform | Free tier; paid from $29/mo |
| Checkly | Hosted SaaS | Playwright-based synthetic and end-to-end testing in CI/CD | Free tier; paid from ~$24/mo |
| Pingdom | Hosted SaaS | Real user monitoring plus multi-step transaction checks | From ~$15/mo, no free tier |
| Site24x7 | Hosted SaaS | All-in-one IT monitoring bundling uptime, APM, and servers | From ~$9/mo |
| StatusCake | Hosted SaaS | Page speed, domain, and SSL monitoring | Free tier; paid from ~$24.49/mo |
| Healthchecks.io | Hybrid (SaaS or self-hosted) | Cron job and heartbeat monitoring | Free tier (20 jobs); paid from $20/mo |
| Gatus | Self-hosted OSS | Config-as-code health checks for GitOps teams | Free |
| Kener | Self-hosted OSS | Modern, polished status pages | Free |
| OnlyStatus | Self-hosted OSS | Fully self-contained synthetic monitoring, no SaaS dependencies | Free |
| Statping-ng | Self-hosted OSS | Visual status pages with real database backends | Free |
| Cachet | Self-hosted OSS | Pure incident-communication layer | Free |
| HertzBeat | Self-hosted OSS | AI-assisted, multi-protocol observability | Free |
| Cabot | Self-hosted OSS | Lightweight, PagerDuty-style alert routing | Free |
| Zabbix | Self-hosted OSS | Enterprise infrastructure monitoring at scale | Free |
Why teams leave Uptime Kuma
Uptime Kuma’s biggest strengths are also its biggest limitations. Its lightweight architecture and simple setup make it easy to deploy, but those same design choices can become obstacles as monitor counts, automation needs, and team size increase.
The SQLite scaling ceiling
Uptime Kuma stores everything in a local SQLite file. For a handful of monitors checked every few minutes, that’s fine. Push past that, and concurrent checks plus growing history start competing for the same database lock, and response times inside the dashboard suffer.
In one r/selfhosted thread, a user described loading 600 URLs into Uptime Kuma and finding the app barely usable afterward. Tools with real database backends, or hosted platforms that handle the infrastructure entirely, don’t hit that wall.
No config-as-code, no automation
Uptime Kuma has no GitOps-friendly configuration format and no full REST API. That leaves teams managing monitors one click at a time through a browser. You can’t define checks in version control, spin up monitors from a CI/CD pipeline, or push bulk changes without touching the UI.
Teams running infrastructure as code everywhere else often find this gap is the actual reason they start shopping around.
Missing enterprise-grade features
Uptime Kuma has no multi-tenant access controls, no distributed multi-location probing, and nothing resembling on-call scheduling or escalation policies. These gaps don’t make it a bad tool, they make it a tool built for individual use.
The alternatives below are where those specific needs get addressed, whether through a hosted platform or a self-hosted project built with teams in mind.
Hosted and managed alternatives to Uptime Kuma
These seven tools remove the self-hosting burden entirely, trading server maintenance for a subscription. They’re the right starting point if your main complaint about Uptime Kuma is “who’s watching the watcher” rather than a specific missing feature.
1. UptimeRobot
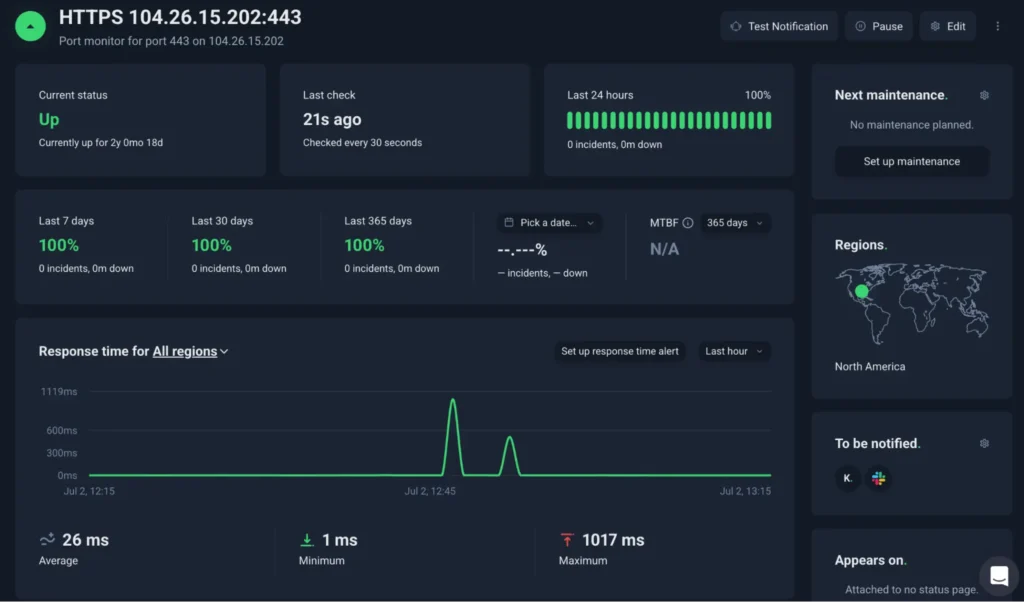
UptimeRobot ping monitoring dashboard
Best for: The fastest switch off Uptime Kuma without giving up simplicity or a free tier.
UptimeRobot keeps the simplicity that made Uptime Kuma popular without requiring you to maintain your own monitoring server. Teams that have outgrown self-hosting can move to a managed service while keeping a familiar monitoring workflow.
The free plan includes 50 monitors for ping, port, website, keyword, and endpoint monitoring, along with 5-minute checks and a status page.
Paid plans add 60-second and 15-second intervals, multi-location verification, additional seats, and broader monitoring options, including API monitoring, DNS, UDP, heartbeat (cron job), SSL certificates, domain expiration, and more.
One limitation of Uptime Kuma is that managing larger deployments often requires more manual work. UptimeRobot’s bulk import, maintenance windows, and API make it easier to set up, organize, and maintain monitors as your environment grows.
| Pros | Cons |
| 50 monitors free, no server to maintain | Free plan limited to personal/non-commercial use |
| Broad check-type coverage including API monitoring and UDP | 5-minute check intervals on free (60 sec on paid) |
| v3 API for full automation without touching the dashboard | Advanced status page features require Team plan or above |
| No per-seat pricing as team grows | No on-call scheduling built in |
2. Better Stack
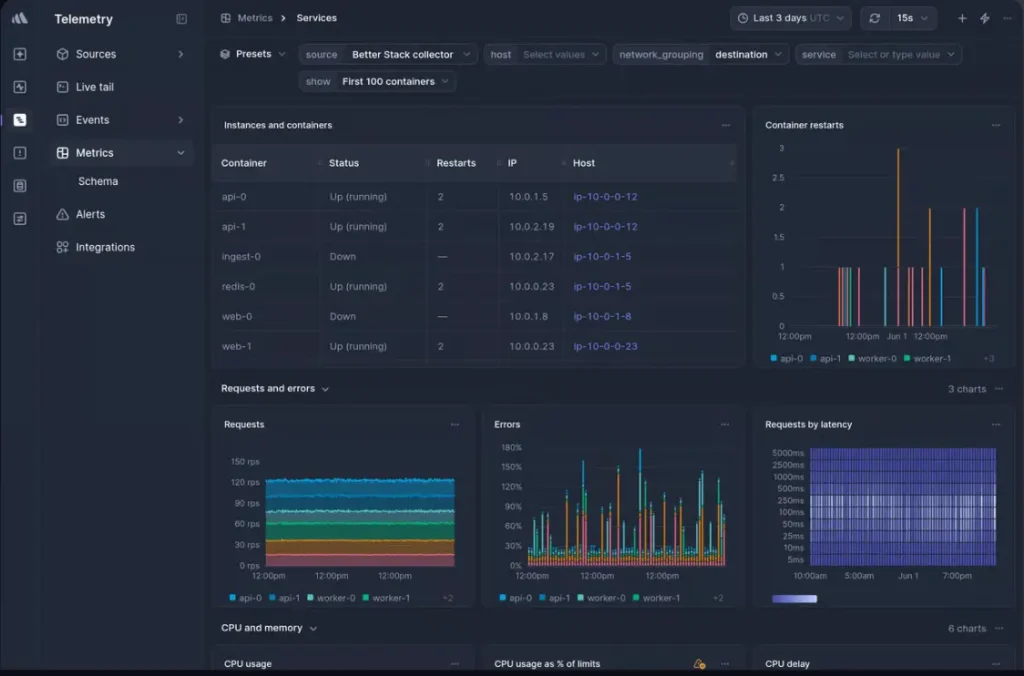
Source: Better Stack uptime monitoring dashboard
Best for: Teams that want uptime monitoring, log management, and on-call scheduling in one platform.
Better Stack combines uptime monitoring with log management and on-call scheduling, so it’s a good fit for engineering teams that would otherwise stitch together several separate tools. When an alert fires, engineers can jump directly into the logs and route incidents through built-in escalation policies without switching platforms.
The free tier includes 10 basic uptime monitors with 3-minute checks. Paid plans start around $29 per responder per month and add more advanced incident management, while log ingestion scales separately based on usage. SSO and custom status page branding are reserved for higher-tier plans.
The biggest tradeoff is pricing. Per-responder licensing and log volume can become expensive as a team grows. If uptime monitoring is the primary goal, much of Better Stack’s broader observability platform may go unused.
| Pros | Cons |
| Logs, on-call, and uptime monitoring in one platform | Per-responder pricing scales steeply for larger teams |
| SQL-queryable log search alongside uptime data | SSO and custom branding require premium tiers |
| Built-in escalation policies and on-call scheduling | More complexity than most teams need for basic uptime |
| Free tier available | Log volume pricing adds a second unpredictable cost dimension |
3. Checkly
Source: Checkly dashboard
Best for: Development teams that already use Playwright and CI/CD pipelines.
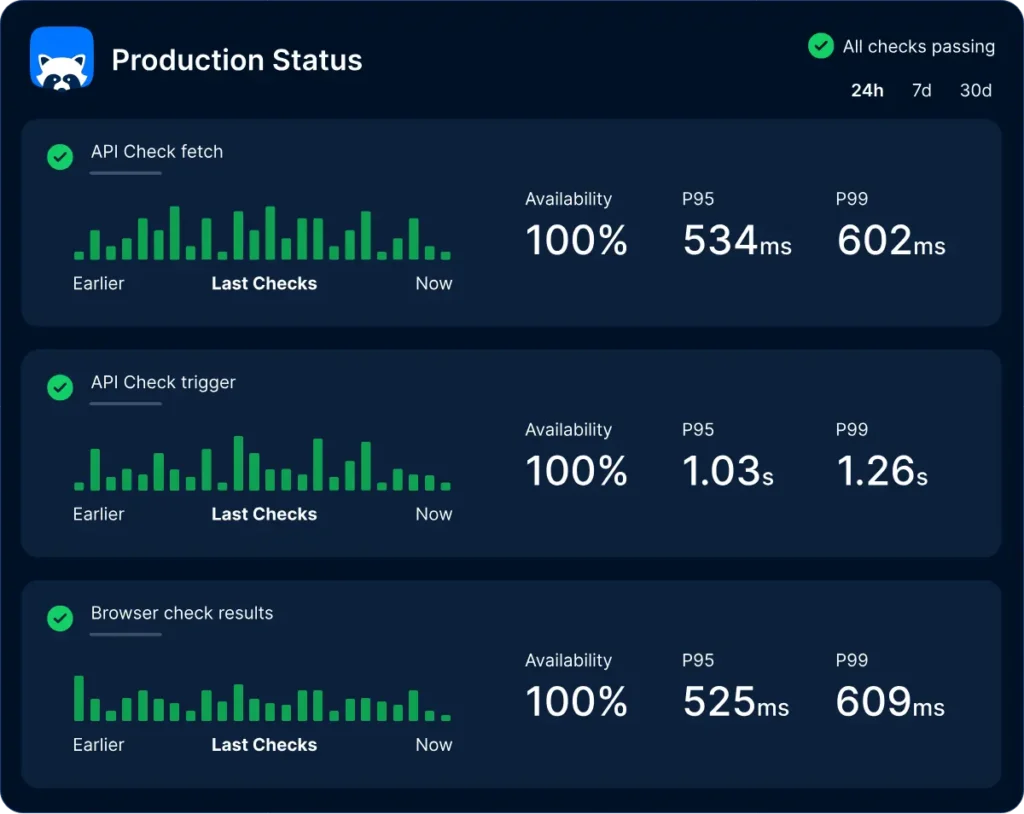
Checkly isn’t a traditional uptime monitor. Instead of relying on simple HTTP or ping checks, it runs browser and API tests written in JavaScript or TypeScript, allowing the same Playwright scripts used during development to monitor production continuously.
The free Hobby tier includes browser and API checks with monthly usage limits, while paid plans start around $24 per month and scale based on browser runs and team features. It’s an attractive alternative for engineering teams that want monitoring tightly integrated into deployment pipelines.
That flexibility comes with additional complexity. Getting the most from Checkly requires writing and maintaining test scripts, making it far more than most teams need if the goal is simply knowing whether a website is online.
| Pros | Cons |
| Playwright-based browser testing for real user flows | Requires JavaScript/TypeScript skills to write monitors |
| Tight CI/CD integration, checks run on deploy | Browser-check costs climb quickly at scale |
| API assertion monitoring with request scripting | Overkill for basic uptime checks |
| Free Hobby tier available | Limited check run budgets on entry plans |
4. Pingdom
Source: Pingdom dashboard
Best for: Teams that want real user monitoring alongside uptime checks.
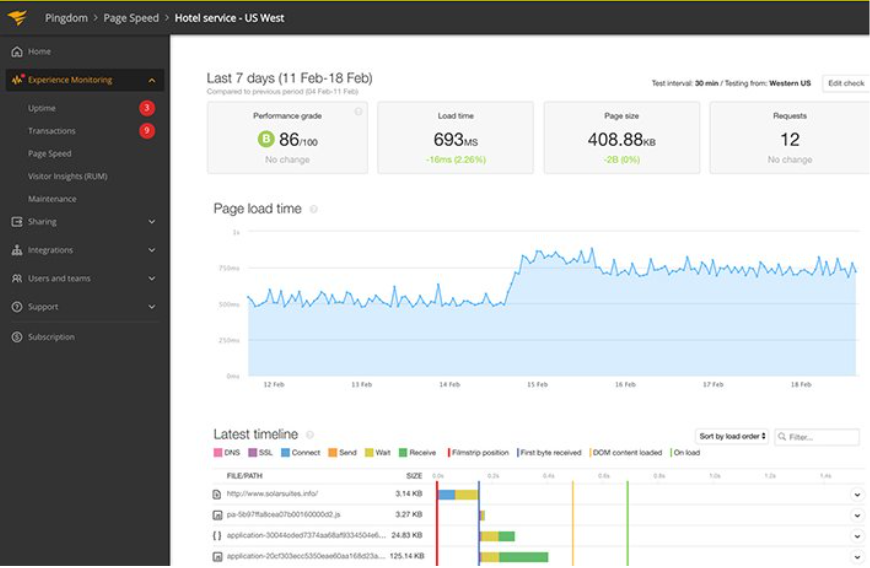
Pingdom features traditional uptime monitoring with real user monitoring (RUM) and synthetic transaction testing. That makes it useful when understanding customer experience matters just as much as knowing whether a website is available.
Plans start around $15 per month, with no permanent free tier. Real user monitoring is licensed separately, and several popular integrations rely on custom webhooks rather than dedicated connectors.
The platform remains a solid choice for website performance monitoring, but entry-level plans include relatively few monitors, making it less attractive if you’re primarily replacing Uptime Kuma.
| Pros | Cons |
| Real user monitoring data alongside synthetic checks | No free tier, trial only |
| Multi-step transaction monitoring | RUM sold separately from uptime plans |
| Established platform with long uptime history | Entry plan limited to 10 monitors |
| Multiple global probe locations | Common integrations require custom webhooks |
5. Site24x7
Source: Site 24×7 dashboard
Best for: Teams already investing in broader infrastructure monitoring.
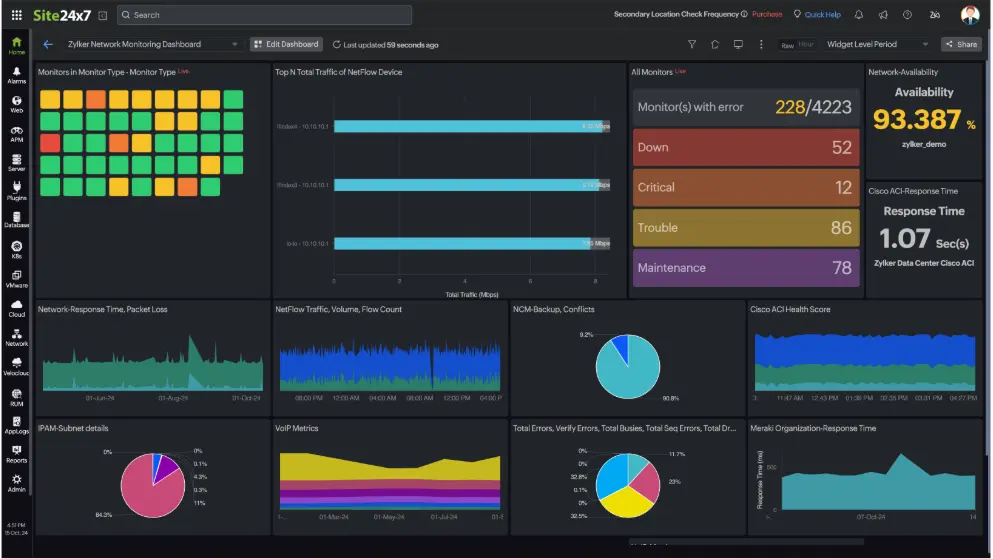
Site24x7 bundles uptime monitoring with application performance monitoring, server monitoring, cloud infrastructure, and network monitoring in a single platform. It’s designed for IT teams that want one dashboard covering much more than website availability.
Pricing starts around $9 per month for basic uptime monitoring, while larger plans add server agents, APM, and cloud monitoring. More than 130 monitoring locations provide broad geographic coverage.
If you’re moving away from Uptime Kuma simply to avoid maintaining your own monitoring server, Site24x7 may feel much larger than necessary. Many of its enterprise features only become valuable once you’re monitoring an entire infrastructure stack.
| Pros | Cons |
| Full-stack APM and server monitoring bundled with uptime | Dense interface with a steep learning curve |
| 130+ global monitoring locations | Most features go unused for basic uptime use cases |
| Low entry price at $9/mo | Cost jumps significantly when adding server agents |
| Part of the broader Zoho ecosystem | Less developer-friendly than modern uptime tools |
6. StatusCake
StatusCake dashboard
Best for: Teams that want page speed, SSL, and domain monitoring together.
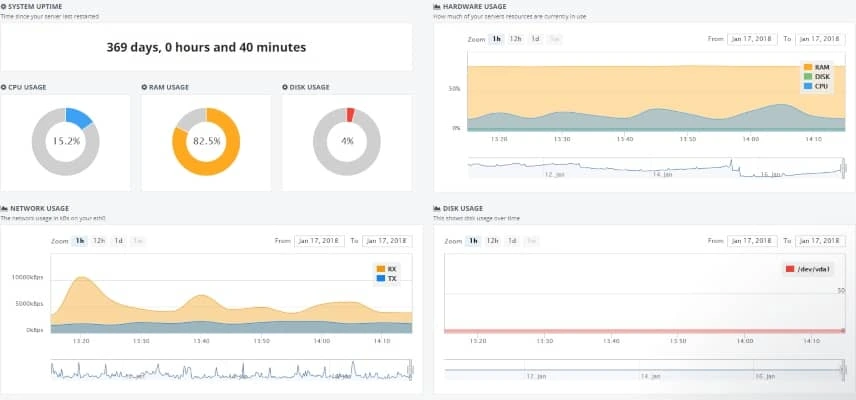
StatusCake extends traditional uptime monitoring with page speed testing, SSL certificate monitoring, domain expiration tracking, and server resource monitoring. It’s a practical choice for websites where performance and domain health matter alongside availability.
The free plan includes 10 monitors with 5-minute checks, while paid plans start around $24.49 per month and unlock additional alerting channels and monitoring features.
Compared with broader monitoring platforms, StatusCake stays focused on website monitoring. Teams needing a wider range of monitor types or more advanced automation may eventually outgrow it.
| Pros | Cons |
| Page speed testing alongside uptime checks | SMS and Slack alerts require paid tiers |
| SSL and domain expiry monitoring | Free plan limited to 10 monitors |
| Server resource threshold monitoring | Page speed test frequency capped even on paid plans |
| Free tier available | Fewer monitor types than UptimeRobot or Better Stack |
7. Healthchecks.io
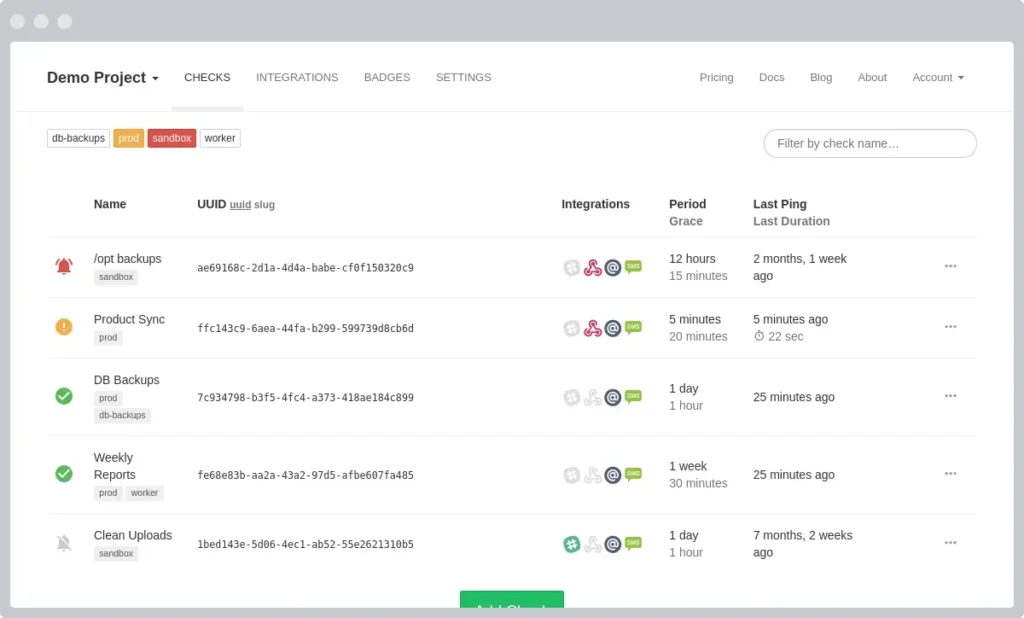
Source: Healthchecks.io cron job dashboard
Best for: Cron jobs, scheduled tasks, and backups.
Healthchecks.io solves a different problem from most uptime monitoring platforms. Instead of polling your applications, it waits for scheduled jobs to report in and alerts you when an expected heartbeat never arrives.
The hosted service includes a free tier covering 20 jobs, with paid plans starting around $20 per month. A fully self-hosted version is also available for teams that prefer managing the service themselves.
It’s excellent for monitoring scheduled tasks, backups, and cron jobs, but it isn’t designed to replace website uptime monitoring. Most teams pair it with a broader monitoring platform rather than relying on it alone.
| Pros | Cons |
| Designed specifically for cron and heartbeat monitoring | Can’t poll websites or check SSL expiry |
| Self-hosted option available for free | Not a full uptime monitoring replacement |
| Simple API for integrating with any scheduled task | Needs to be paired with a separate uptime tool for web checks |
| Generous free tier (20 jobs) | Limited alerting channels on lower tiers |
Self-hosted open-source alternatives to Uptime Kuma
These eight projects keep monitoring on infrastructure you control, which matters for teams with data-residency requirements, homelab setups, or anyone who’d rather skip a recurring subscription.
8. Gatus
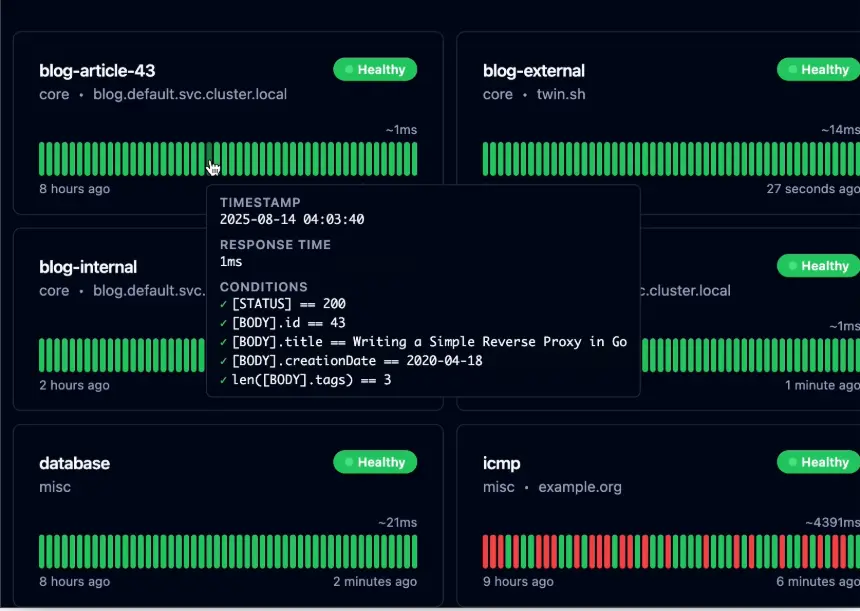
Source: Gatus dashboard
Best for: GitOps teams that manage everything as code.
Gatus replaces browser-based configuration with YAML files stored in version control. Every monitor becomes part of your infrastructure-as-code workflow, making reviews, automated deployments, and Git-based change tracking straightforward.
It supports HTTP, TCP, UDP, ICMP, DNS, gRPC, and WebSocket monitoring while running comfortably in a tiny Docker container or single binary. Kubernetes users also get an official Helm chart.
The catch is usability. Every monitor change requires editing configuration files instead of using a web interface, making Gatus a better fit for infrastructure engineers than general IT teams.
| Pros | Cons |
| Full config-as-code, version-controllable in git | No web GUI, every change requires editing YAML |
| Tiny resource footprint (~30MB RAM) | No user management or role-based access |
| Condition-based evaluation beyond simple HTTP status checks | Steeper setup curve than UI-based tools |
| Official Helm chart for Kubernetes deployment | Community and plugin ecosystem smaller than Uptime Kuma |
9. Kener
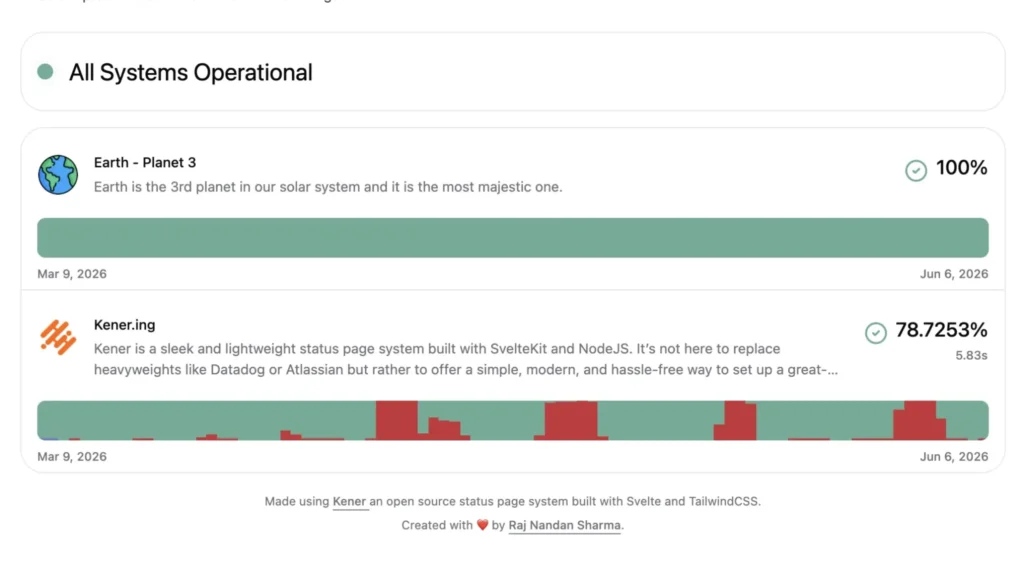
Source: Kener status example
Best for: Teams that want a polished self-hosted status page alongside their uptime monitoring.
Kener combines uptime monitoring with one of the best-looking public status pages in the open-source ecosystem. Built on SvelteKit, it supports multiple monitor types, incident timelines, and integrations with Slack, Discord, and email.
Deployment is straightforward through Docker, and configuration can be managed through JSON, YAML, or the built-in dashboard.
As a relatively new project, its ecosystem and community remain smaller than older open-source alternatives, although the project continues to evolve quickly.
| Pros | Cons |
| Best-looking self-hosted status page in the category | Younger project, smaller community |
| Fast Docker setup, MIT licensed | Plugin and integration ecosystem still thin |
| Incident timelines built into the status page | Fewer monitor types than Gatus or Zabbix |
| Slack, Discord, and email notifications | Less battle-tested in production than Uptime Kuma |
10. OnlyStatus
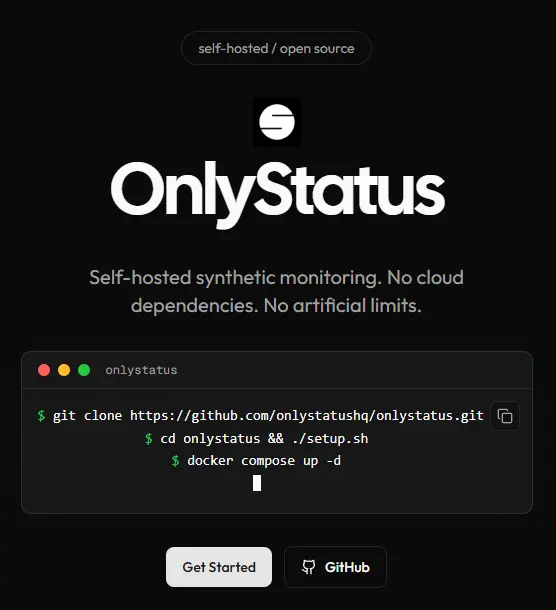
Source: OnlyStatus homepage
Best for: Teams that want a fully self-contained monitoring stack.
OnlyStatus removes external SaaS dependencies entirely while providing HTTP, TCP, and DNS monitoring with branded status pages. Everything runs on infrastructure you control, making it attractive where privacy, compliance, or complete ownership matters.
Deployment happens through a single Docker Compose stack, with built-in API access, two-factor authentication, and WebAuthn support.
The project is still relatively young, so documentation and community resources haven’t reached the maturity of longer-established open-source projects.
| Pros | Cons |
| Completely self-contained, no external SaaS at runtime | Recent fork, documentation is still thin |
| Token-based API with 2FA and passkey support | Smaller community than Gatus or Uptime Kuma |
| Single docker-compose deployment | Fewer monitor types than some alternatives |
| Custom domain status pages | Less mature than the OpenStatus project it forked from |
11. Statping-ng
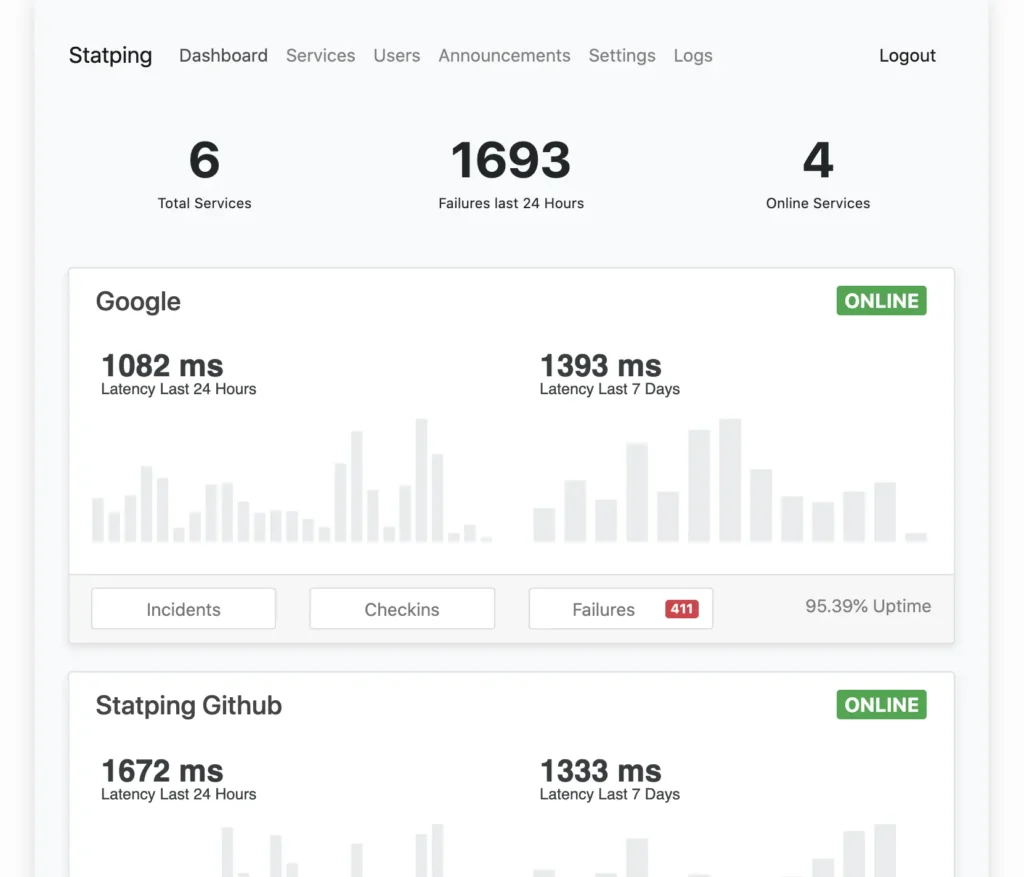
Source: Statping-ng dashboard
Best for: Teams that have outgrown SQLite.
Statping-ng addresses one of Uptime Kuma’s biggest architectural limitations by supporting MySQL and PostgreSQL alongside multiple monitoring protocols. For teams whose monitor count has outgrown SQLite, that’s a meaningful advantage.
It also includes public status pages, response-time graphs, and support for HTTP, TCP, UDP, ICMP, and gRPC monitoring.
The biggest drawback is maintenance. Development has been less consistent than some alternatives, and updates or migrations may require more attention than actively maintained hosted platforms.
| Pros | Cons |
| MySQL and PostgreSQL backends, avoids SQLite limits | Stalled maintenance cycles in the past |
| Interactive status pages with response-time charts | Documented bugs in notification and migration handling |
| Multiple protocol support (HTTP, TCP, UDP, gRPC) | Higher resource usage reported by some users |
| Free under GPL-3.0 | Community fork means uncertain long-term maintenance |
12. Cachet
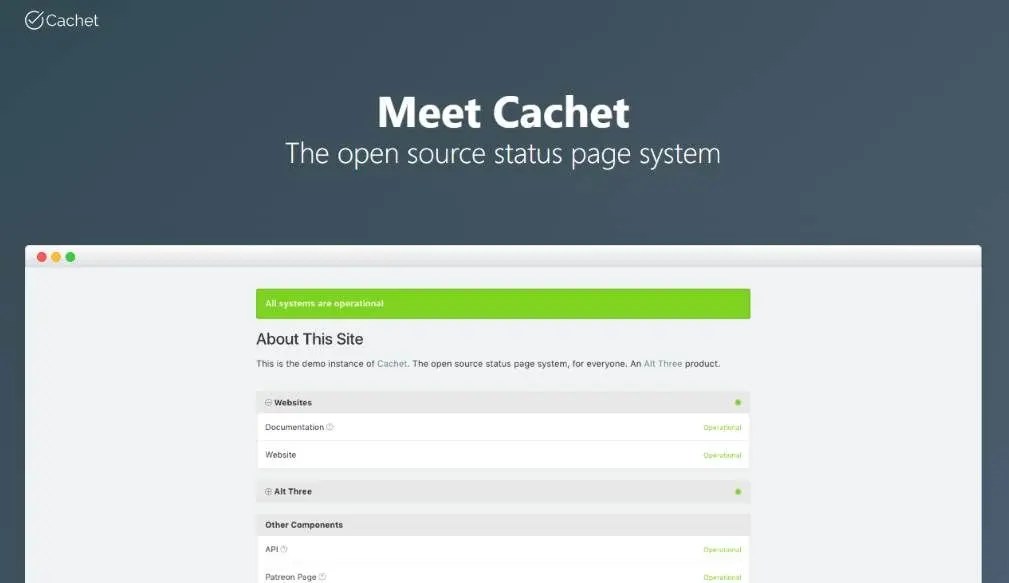
Source: Cachet status page creation page
Best for: Incident communication rather than monitoring.
Cachet focuses entirely on communicating incidents, maintenance windows, and service status. Unlike most tools in this comparison, it doesn’t perform active monitoring itself.
Instead, another monitoring platform updates Cachet through its API, allowing teams to separate monitoring from customer communication.
That architecture works well for organizations already running their own monitoring stack, but many teams will prefer an all-in-one platform that monitors services and updates status pages automatically.
| Pros | Cons |
| Polished incident management and subscriber notifications | No active monitoring built in, requires a separate pinger |
| Planned maintenance window management | v3.0 rewrite in progress, legacy branch stalled |
| Free under MIT license | PHP + web server + database required, heavier setup |
| JSON API for external status updates | More overhead than single-binary tools |
13. HertzBeat
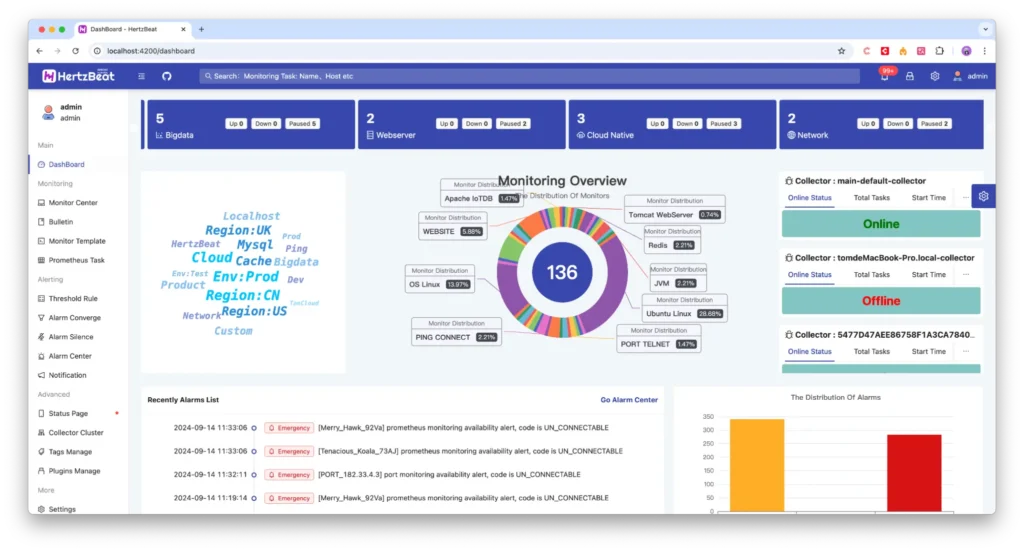
Source: HertzBeat dashboard
Best for: Multi-protocol observability without SaaS.
HertzBeat sits closer to an observability platform than a traditional uptime monitor. Alongside website checks, it supports protocols including JMX, SSH, SNMP, and JDBC while adding threshold alerts, dashboards, and AI-assisted analysis.
The platform is completely free under the Apache 2.0 license and works well in environments already running Java infrastructure.
Its feature set comes with higher resource requirements and a more complex interface than lightweight uptime monitoring tools, which makes it better suited to infrastructure teams than small websites.
| Pros | Cons |
| Agentless, broad protocol coverage (HTTP, SNMP, JDBC, SSH) | Java runtime adds significant memory overhead |
| AI-assisted metric and log analysis | Complex for teams that only need uptime checks |
| Apache 2.0 license, free | Smaller community than Zabbix or Prometheus |
| Built-in status pages and threshold alerting | Less documentation than more established OSS tools |
14. Cabot
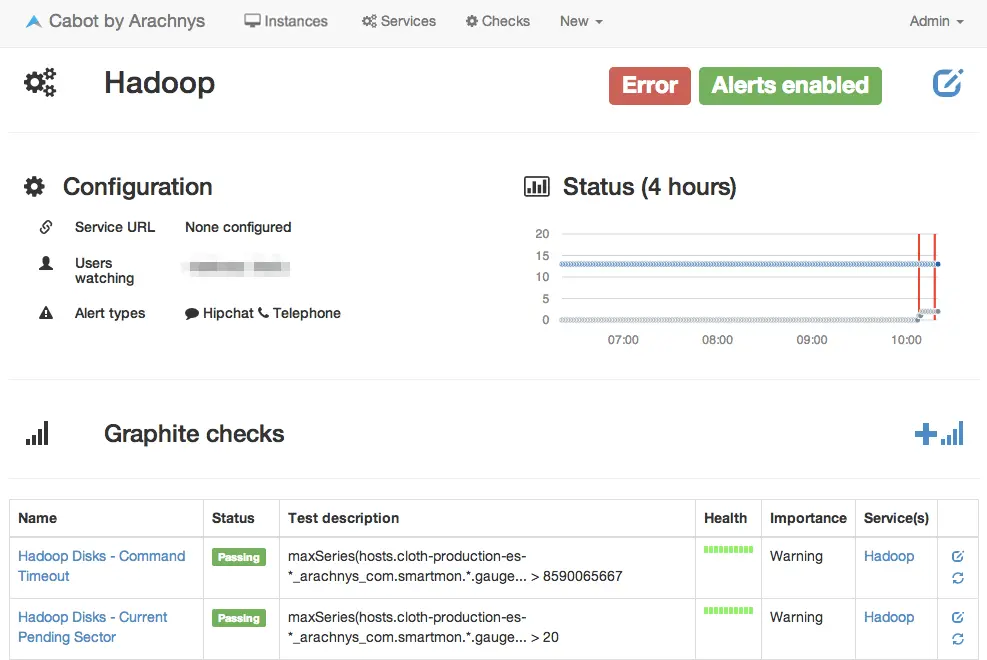
Source: Cabot dashboard
Best for: Self-hosted alert routing.
Cabot was built to provide PagerDuty-style alert routing from a self-hosted deployment. Phone calls, SMS, Slack notifications, and integrations with Graphite or Jenkins make it attractive for teams wanting full control over alert delivery.
It’s free and open source, but requires a Python, Django, Redis, and database stack to operate.
The bigger concern is long-term maintenance. Development has slowed, and the project is no longer under active development. Unless its alerting workflow is exactly what you need, there are safer choices for new production deployments.
| Pros | Cons |
| Phone, SMS, and Slack alert routing | Not actively maintained, developers seeking new maintainers |
| PagerDuty-style escalation for self-hosters | Python + Django + Redis + database, heavier setup |
| Free under MIT license | Running in production carries risk without active maintenance |
| Works with Graphite and Jenkins metrics | Limited to those specific data sources |
15. Zabbix
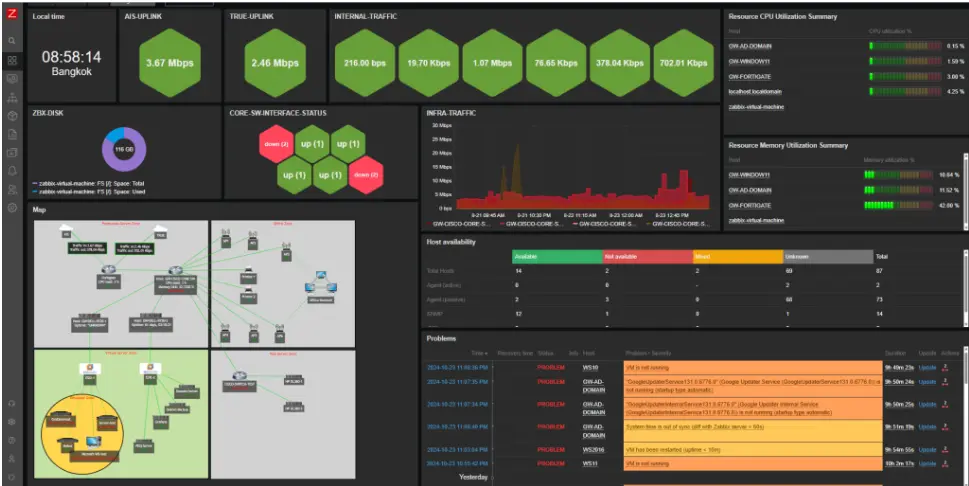
Source: Zabbix dashboard example
Best for: Enterprise infrastructure monitoring at scale.
Zabbix goes far beyond website uptime, monitoring servers, networks, databases, virtual machines, and applications across large environments. Sophisticated dependency logic helps reduce alert storms, making it a long-standing choice for enterprise infrastructure teams.
The platform is completely free, with optional commercial support, but deploying it requires significantly more effort than most hosted monitoring platforms. A Linux server, database, web server, and PHP environment all need configuring before monitoring even begins.
If you’re replacing Uptime Kuma because you’re tired of maintaining the monitoring system itself, Zabbix is unlikely to solve that problem. It shines when comprehensive infrastructure monitoring is the goal rather than straightforward website uptime.
| Pros | Cons |
| Enterprise-scale monitoring across networks, servers, and databases | Weeks to fully configure for complex environments |
| Trigger-dependency logic prevents alert storms | Dense, utilitarian UI with a steep learning curve |
| Agent-based and agentless monitoring | Infrastructure-as-code support limited compared to Gatus |
| Free, with optional commercial support | Overkill for teams that just need website uptime |
How to choose the right Uptime Kuma alternative
The best replacement depends on why you’re moving away from Uptime Kuma. Most teams fall into one of these categories.
You want to stop managing a monitoring server
If your biggest complaint is maintaining the VPS behind Uptime Kuma, a hosted platform is the simplest upgrade. UptimeRobot is the closest match if you want to keep the same lightweight experience, while Better Stack and Site24x7 make sense if you also want logs, on-call management, or infrastructure monitoring in the same platform.
You want to stay self-hosted
Not every team wants SaaS. Gatus is the strongest choice if you manage infrastructure as code, while OnlyStatus appeals to teams that want a fully self-contained deployment. If your main concern is SQLite scaling, Statping-ng moves to MySQL or PostgreSQL instead.
You need more than website uptime
Some alternatives solve much broader problems than Uptime Kuma. Checkly focuses on browser and API testing, Better Stack combines uptime with logs and incident response, and Zabbix monitors entire infrastructure environments rather than individual websites. If those capabilities aren’t part of your requirements, they may introduce more complexity than you need.
Compare long-term cost, not just the starting price
Free plans and low entry prices only tell part of the story. Better Stack and Checkly become more expensive as teams, responders, or usage grow, while self-hosted tools replace subscription costs with ongoing maintenance. UptimeRobot keeps pricing predictable while removing the operational overhead of managing your own monitoring server.
Next steps
If you’re happy managing your own infrastructure, tools like Gatus, OnlyStatus, and Zabbix expand on what Uptime Kuma already does. If maintaining the monitoring server has become the bigger problem, a hosted platform removes that overhead entirely.
Before committing to a migration, run your preferred alternative alongside Uptime Kuma for a few days. Comparing alerts, response times, and day-to-day management makes it much easier to decide whether the switch is worthwhile.
If you’re looking for the closest hosted replacement, try UptimeRobot’s free plan to see whether it covers your monitoring needs before moving to a paid tier.
-
Gatus, OnlyStatus, and Statping-ng are the strongest picks if you want to stay self-hosted while fixing Uptime Kuma’s specific gaps. Gatus runs on YAML config files for a GitOps-style setup. OnlyStatus adds token-based API access and two-factor login. Statping-ng supports MySQL and PostgreSQL instead of a single SQLite file. Zabbix covers the enterprise end if you need full infrastructure monitoring rather than just uptime checks.
-
Zabbix is the usual answer for enterprise-scale infrastructure monitoring: agent-based and agentless checks across networks, servers, and databases, with logic built to prevent alert storms. Site24x7 is worth considering if you’d rather get that same scope through a hosted plan. Both come with a heavier setup and learning curve, so they make sense mainly for teams already running a full infrastructure fleet.
-
Yes. UptimeRobot’s free plan covers 50 monitors with 5-minute checks and a status page, which is the closest hosted match to what Uptime Kuma offers for free. Better Stack, Healthchecks.io, and StatusCake also have free tiers, though each caps monitors or check intervals more tightly.
-
It comes down to what’s actually bothering you about Uptime Kuma. If you like managing your own infrastructure but want config-as-code or better database handling, a self-hosted option like Gatus or OnlyStatus fixes that without giving up control. If server upkeep is the annoyance, a hosted platform like UptimeRobot or Better Stack removes that maintenance entirely, trading it for a subscription.
-
No. Uptime Kuma doesn’t offer a full REST API or a config-as-code format, which means monitors have to be set up and changed through its web interface. That’s a common reason teams move to tools like Gatus, which defines checks in YAML, or UptimeRobot, whose v3 API lets you manage monitors and status pages without touching the dashboard.