Port failures don’t always take a service offline. A port stops accepting connections, times out intermittently, or gets blocked by a firewall change, while everything else looks healthy. When that happens, users feel the break long before uptime checks notice.
This article reviews port monitoring tools from an operational point of view. It looks at how they detect closed or slow ports, how alerts behave in noisy environments, and where basic checks fall short during real incidents.
You’ll learn which tools fit simple reachability checks, which handle deeper service validation, and how to choose one without overcomplicating your setup. If ports matter to your app or infrastructure, this is where monitoring needs to go deeper.
Looking for more amazing monitoring tools? Check out our post about the top 7 ping monitoring tools in 2026.
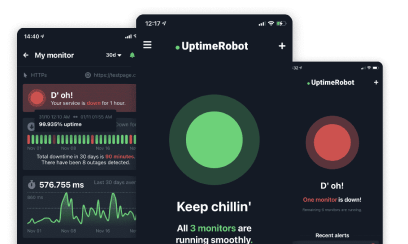
What is port monitoring?
Port monitoring is a process that constantly checks the status of certain ports on your network, and often comes along with network monitoring software packages.
It is important for analyzing network ports, including switch port activity.
Network and port-specific software play a large part in managing and maintaining a healthy network environment. These tools offer a range of functionalities to help you stay on top of your network’s performance. Here are some key features they can provide:
- Identify bandwidth usage: Helps in monitoring the amount of data transferred over the network.
- Throughput changes: Tracks any alterations in the rate of successful message delivery over a communication channel.
- Packet loss rate: Monitors the rate at which data packets are lost in transmission.
- Detecting misconfigurations: Flags any incorrect settings that could impact network performance.
- Auto-negotiation issues between devices: Identifies issues related to automatic configuration between network devices.
If this monitoring technology isn’t used properly it could lead to unauthorized access of sensitive data, malware infection, and other security concerns, such as insider threats leading to false alarms (in worst-case scenarios).
These methods are important for making sure network services run smoothly and safely through TCP ports. This is especially key when you’re monitoring the network and checking the status of these ports.
Benefits & challenges of port monitoring
Let’s first start off with the perks of port monitoring.
Improved security
Monitoring ports is an effective way to identify unauthorized connections that may compromise the safety of the network. This serves as a first line of defense against potential intruders and can help in taking timely action to mitigate risks.
Advanced features
Utilizing port monitoring tools offers access to a variety of advanced network topology options. These features contribute to enhanced performance, making the network more robust and efficient.
Smart resource allocation
Understanding the traffic patterns on each port is key to optimizing resource allocation. A well-monitored network allows for a more balanced distribution of data, which in turn leads to improved efficiency and reduced bottlenecks.
Better understanding of data patterns
Monitoring protocols through port monitoring tools provide valuable insights into the types of data that are transmitted across the network. This can be beneficial for data management and for making informed decisions related to network operations.
Long-term reliability
Regular port monitoring contributes to the ongoing stability and security of the network. This proactive approach can preemptively identify issues, allowing for early resolution and contributing to the network’s reliability over time.
Now that we’ve told you the good side, here are some problems or struggles you may encounter.
Resource-intensive process
Implementing and maintaining port monitoring can be a resource-intensive process. It requires dedicated hardware and software, as well as skilled personnel to manage and analyze the data. This can be a significant investment, especially for larger networks.
Complexity in setup and management
Setting up a comprehensive port monitoring system can be complicated. It involves configuring multiple tools and integrating them into the existing network infrastructure. Managing these systems often requires specialized knowledge and continuous updates to keep up with evolving network demands and security threats.
Potential for false positives
Port monitoring systems can sometimes generate false positives, indicating a security threat where there is none. This can lead to unnecessary investigations and can divert attention and resources away from actual security incidents.
Impact on network performance
Continuous monitoring of all network ports can potentially lead to a decrease in network performance. The extra processing required to analyze and log all the traffic can introduce latency, especially in networks with high traffic volumes.
Data privacy concerns
Port monitoring involves scrutinizing all data passing through the network, which can raise data privacy issues. Making sure you’re in compliance with data protection regulations and maintaining user privacy while monitoring network traffic can be challenging, but is absolutely necessary.
What to look for when choosing a port monitoring tool
As with any product, there are a number of things to consider when looking for the best monitoring tool that will meet your needs. Here are some things to keep in mind while you’re shopping around:
- Ease of use: A user-friendly interface makes it simple to manage.
- Scalability: The tool should be able to easily monitor many ports across multiple networks.
- Customization: The ability to fine-tune the system to meet your specific needs helps you get the most value from it.
- Cost-effectiveness: Make sure the tool fits within your budget while still meeting your needs.
- Compatibility: The tool should work well with your existing network infrastructure and software.
- Technical support: Look for a tool that offers strong customer service and technical assistance.
- Reporting features: Detailed logs and analytics can provide valuable information about your network’s performance.
- Update frequency: A tool that is regularly updated will offer the latest features and security patches.
1. UptimeRobot
UptimeRobot is an uptime monitoring service with more than 3.5 million users. Its port monitoring checks whether the service on a TCP port is accepting connections, so you know your mail server, database, or SSH is reachable, not just the machine it runs on.
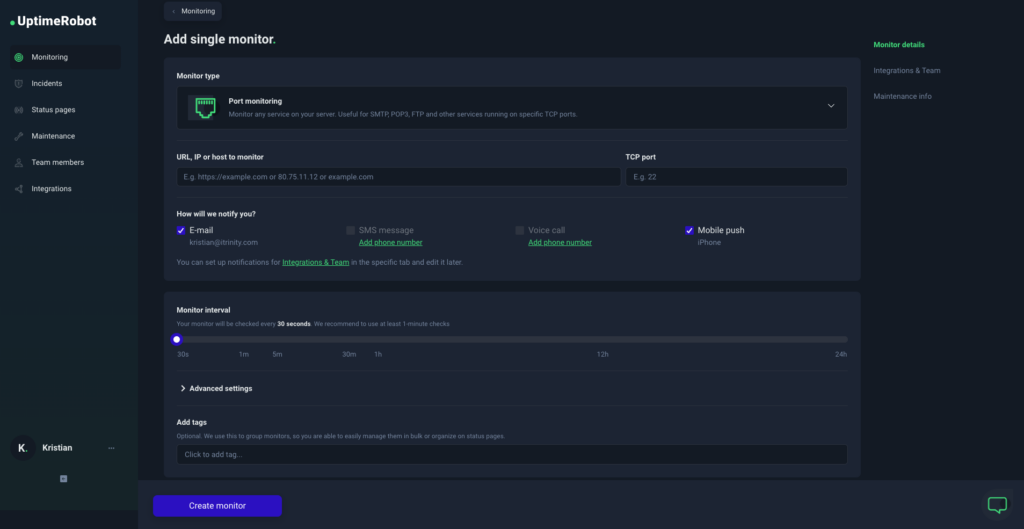
Each port monitor has an alert condition. Alert when port is closed, the default, tells you when a service stops accepting connections. Alert when port is open tells you when a port that should stay shut, like a database or remote desktop port, becomes reachable.
Why is UptimeRobot the top choice?
Here is what you get when you monitor ports with UptimeRobot:
Any TCP port, open or closed alerts
Monitor any TCP port, from 22 for SSH to 3306 for MySQL or a custom application port. For each monitor, choose whether you get alerted when the port closes or when it opens.
Checks down to 15 seconds
Checks run every 5 minutes on the Free plan, every 60 seconds on Solo, every 30 seconds on Team, and every 15 seconds on Scale. Enterprise plans can get custom intervals.
Fewer false alerts
When a check fails, UptimeRobot re-checks it from a second data center in the same region before it alerts you. This works on every plan. Paid plans add location-specific monitoring: check one monitor from up to four regions and set alert thresholds per region.
Monitor types
The Free plan covers HTTP(S), port, ping, and keyword monitors. Paid plans add heartbeat (cron job), API, UDP, DNS, SSL, and domain expiration monitoring.
Alerts where your team works
Email, SMS, voice call, and Email2SMS alerts are available on every plan, and so is the mobile app for iOS and Android. SMS and voice calls use credits, which you can buy separately. The Free plan also connects to Google Chat, Discord, Pushover, Pushbullet, and Splunk. Slack, Microsoft Teams, Telegram, and Mattermost start on Solo, and webhooks, Zapier, and PagerDuty on Team.
Status pages
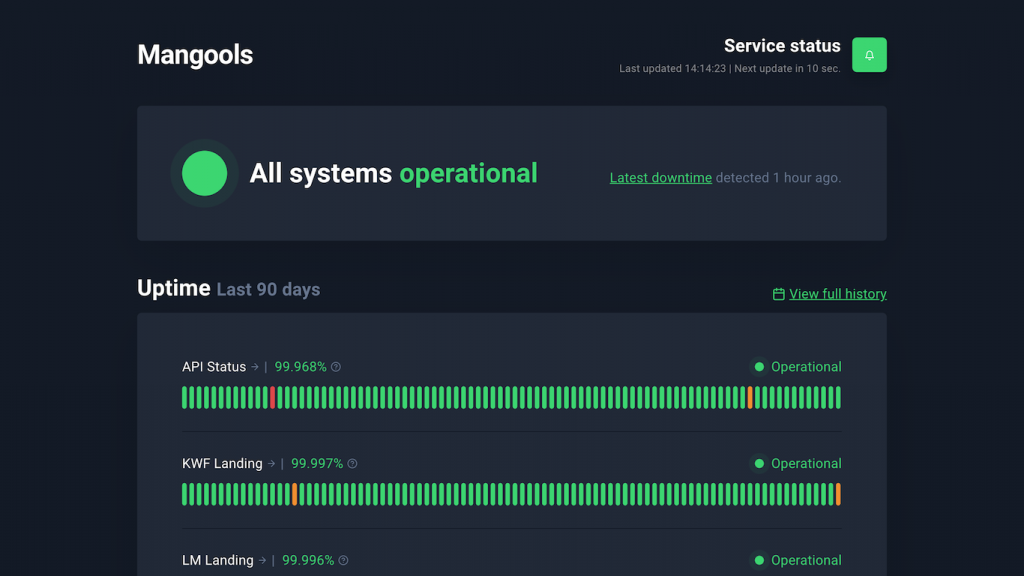
Every plan includes status pages: 1 on Free, 3 on Solo, 100 on Team, and unlimited on Scale. Custom design and your own domain start on Solo, and white-label status pages on Team.
Free plan with 50 monitors
The Free plan includes 50 monitors with 5-minute checks for personal and commercial projects. No credit card required.
Pricing
UptimeRobot has a free plan with 50 monitors and 5-minute checks. The paid plans, Solo, Team, Scale, and Enterprise, add faster checks, more monitor types, and more status pages. See current plans and prices on the pricing page.
Create a free account and get 50 monitors.
2. Statuscake
Statuscake offers a user-friendly, straightforward port monitoring service. It covers essential aspects like website uptime, server health, and SSL certificate status, sending alerts for any issues.

Its simplicity and reliability make it ideal for both individuals and businesses seeking hassle-free port monitoring without advanced customization options.
Key features
StatusCake offers a variety of monitoring services aimed at helping you keep tabs on the health and performance of your websites, servers, and APIs. Its feature set includes uptime monitoring, page speed analysis, and server monitoring, among others.
- Uptime monitoring
- Page speed analysis
- Server monitoring
- SSL certificate monitoring
- Domain monitoring
- Virus scanning
- Public reporting
- Alerting and notifications
Pricing
All of Statuscake’s plans come with several types of monitoring, some more than others. They include uptime, page speed, domain, SSL, and server monitoring, along with alerts and team tools.
The free plan offers only 10 monitors with very limited options.
For more features and scalability, they have the Superior plan for €16.66 / per month (billed annually).
| Pros | Cons |
| ✅User-friendly and straightforward | ❌Limited advanced port monitoring options |
| ✅Covers essential monitoring aspects | ❌May not satisfy those seeking extensive capabilities |
3. Dotcom-monitor
Dotcom-monitor offers a multitude of features and customization options for port monitoring, including real-time alerts and comprehensive diagnostics.
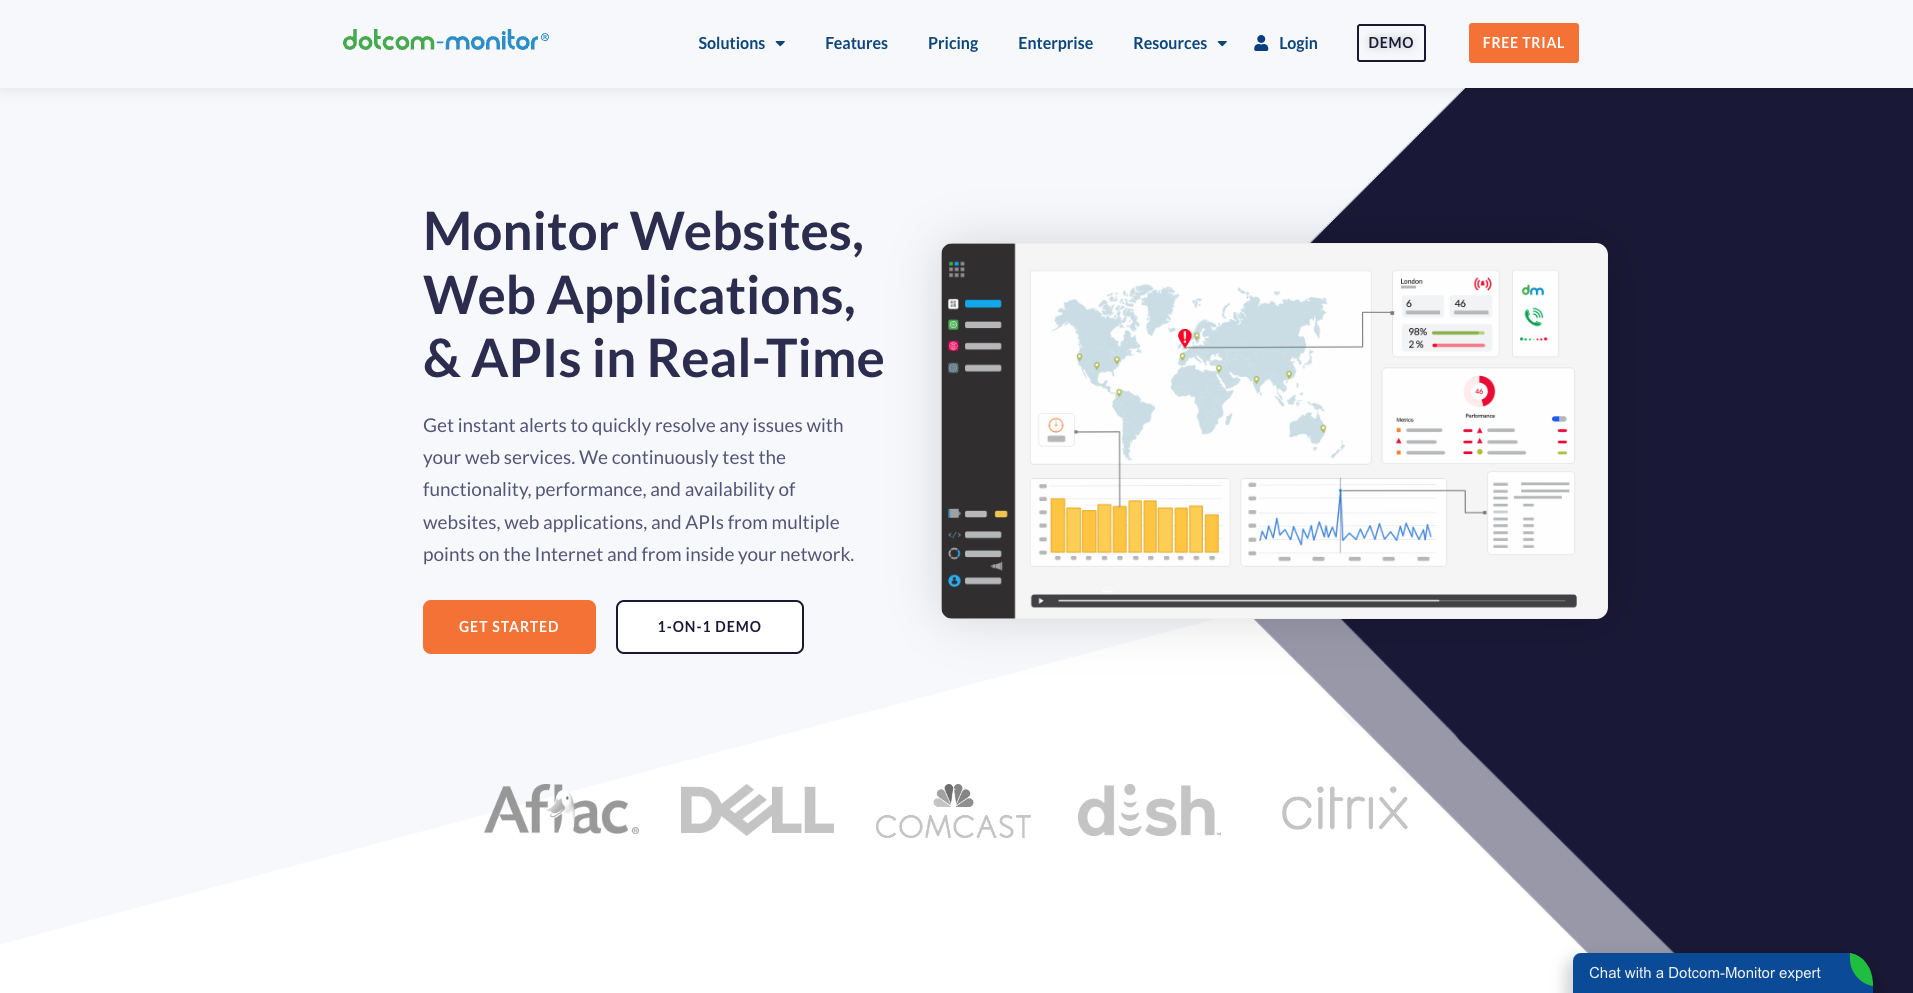
While its complexity may pose a challenge for beginners, it’s ideal for those needing precise control over system functionality.
Key features
Dotcom-Monitor offers a range of options to help you maintain a well maintained network infrastructure. While it is commonly used for monitoring from multiple locations, the user interface might feel a bit dated to some users.
Within its Web Services Monitoring package, Dotcom-Monitor features port monitoring along with other functionalities that are particularly useful.
- TCP, SOAP, and GET/POST monitoring
- SSL certificate monitoring
- Instant alerting
- WebSocket monitoring
- 25 monitoring locations worldwide
- Web API
Pricing
Paid plans start at $19.99 per month for the Web Services package (10 targets, 5-minute checks), with a 30-day free trial. A forever free plan covers up to 25 targets.
Dotcom-Monitor also indicates that discounts may be available for bulk subscriptions.
| Pros | Cons |
| ✅Advanced functionalities and customization options | ❌May be difficult for less experienced users |
| ✅Versatile and can suit any need or requirement | ❌Some users report errors or inaccuracies |
4. BetterStack
BetterStack is a go-to for developers seeking comprehensive observability tools.

It excels in port monitoring and offers real-time alerts, automated incident resolution, and in-depth analytics. BetterStack also has many popular integration options, making it a versatile and powerful choice for monitoring your infrastructure.
Key features
BetterStack provides a comprehensive uptime monitoring package as well as log packages. Their uptime monitoring option is feature-rich and serves as an excellent choice for those seeking an all-in-one toolset.
- Unlimited voice call alerting
- Port, IMAP, POP3, SMTP monitoring
- Incident audit timelines
- 30 second multi-location checks
Pricing
BetterStack’s free plan includes 3-minute checks, 10 monitors and heartbeats, 1 status page, and Slack and email alerts.
Paid plans start with a responder license at $29 per month billed annually, which includes 10 monitors and checks down to 30 seconds. Each extra pack of 50 monitors costs $21 per month, also billed annually.
| Pros | Cons |
| ✅Comprehensive features | ❌Challenging learning curve for beginners |
| ✅Seamless integrations | ❌Some report problems with receiving notifications |
| ✅Suitable for those experienced in port monitoring |
5. Uptime Kuma
Uptime Kuma is an open source, self-hosted monitoring solution, but it does come with the responsibility of managing your own server upkeep.
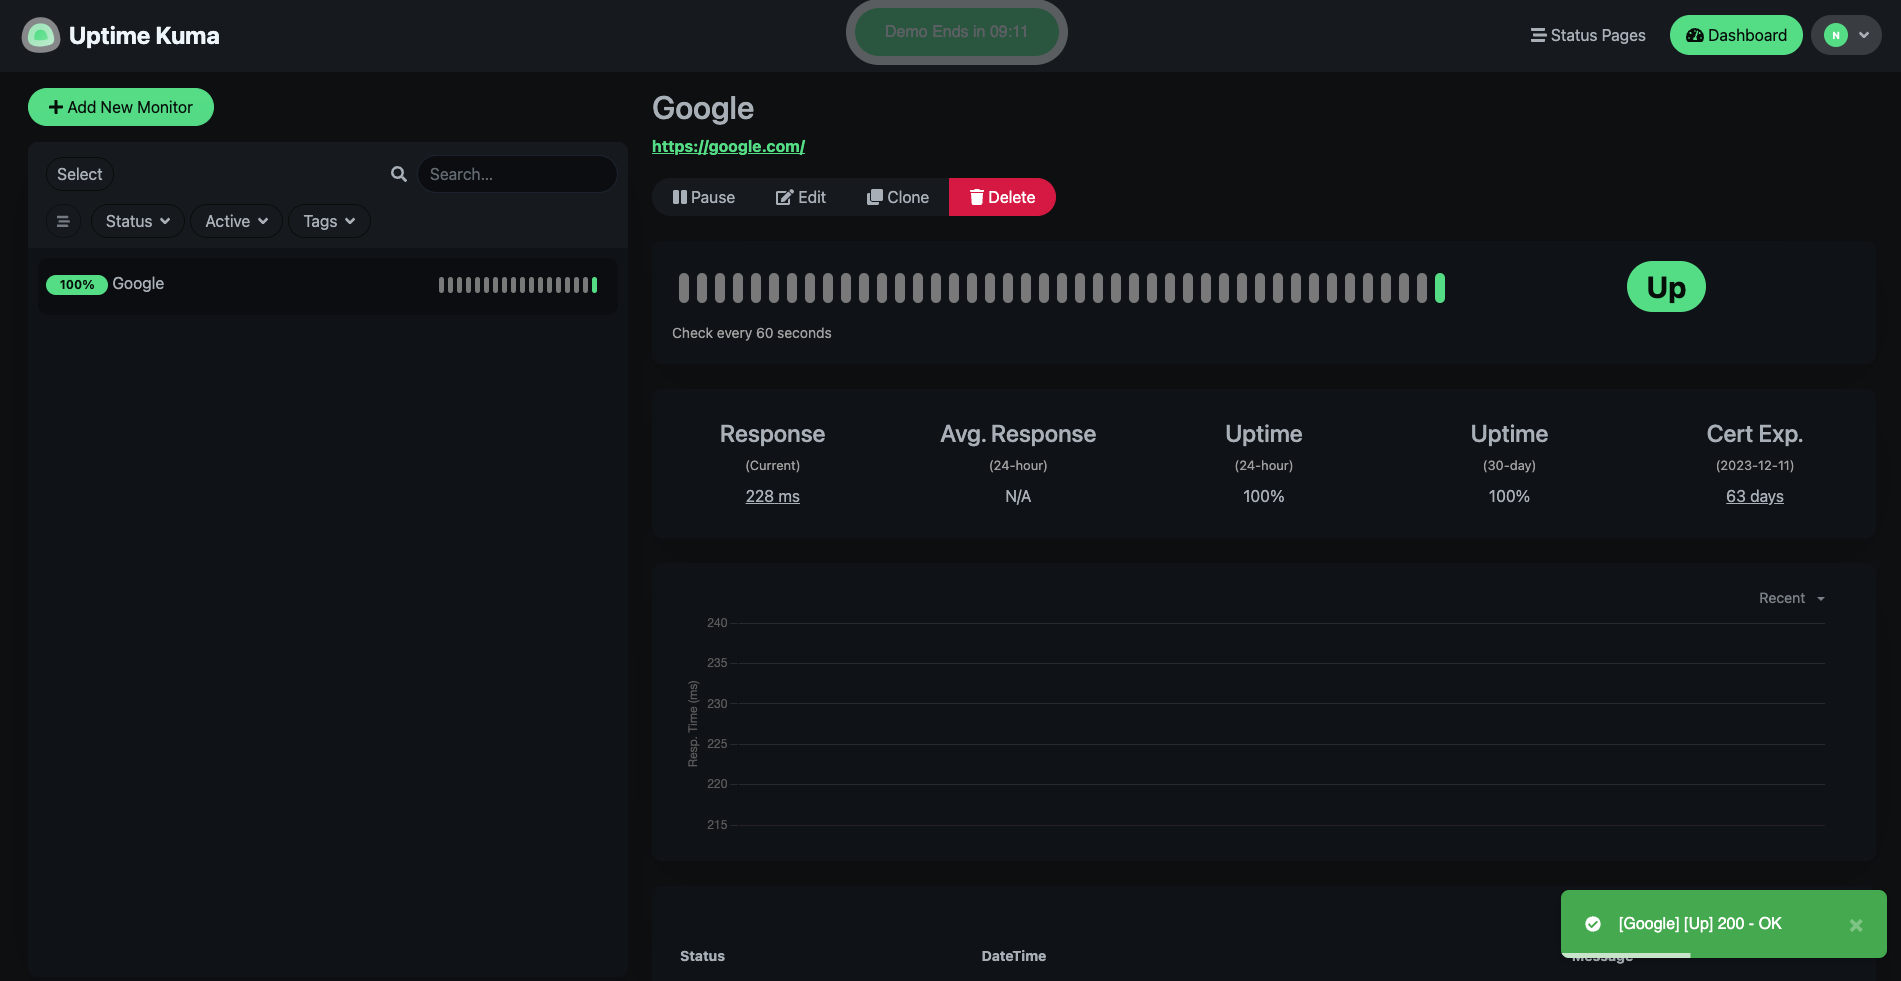
While the tool itself is free, you’ll bear the expense of your own servers and be in control of your own server maintenance monitoring.
Key features
Uptime Kuma offers a straightforward, no-nonsense approach to monitoring, making it an ideal pick for those who already have a server setup and are looking for basic, budget-friendly monitoring features.
- HTTP/S, TCP, DNS uptime monitoring
- Monitoring history summaries
- Database optimization
- Over 90 notification integrations
- Customizable interface
Pricing
As mentioned earlier, Uptime Kuma is entirely free to use. However, you’ll need to cover any costs associated with maintaining and operating your own servers.
| Pros | Cons |
| ✅Open source | ❌Requires technical expertise |
| ✅Monitoring options | ❌Self-hosted |
| ✅Integrations | ❌Limited community support |
6. Dynatrace
Dynatrace offers AI-driven real-time application performance monitoring and proactive issue detection.
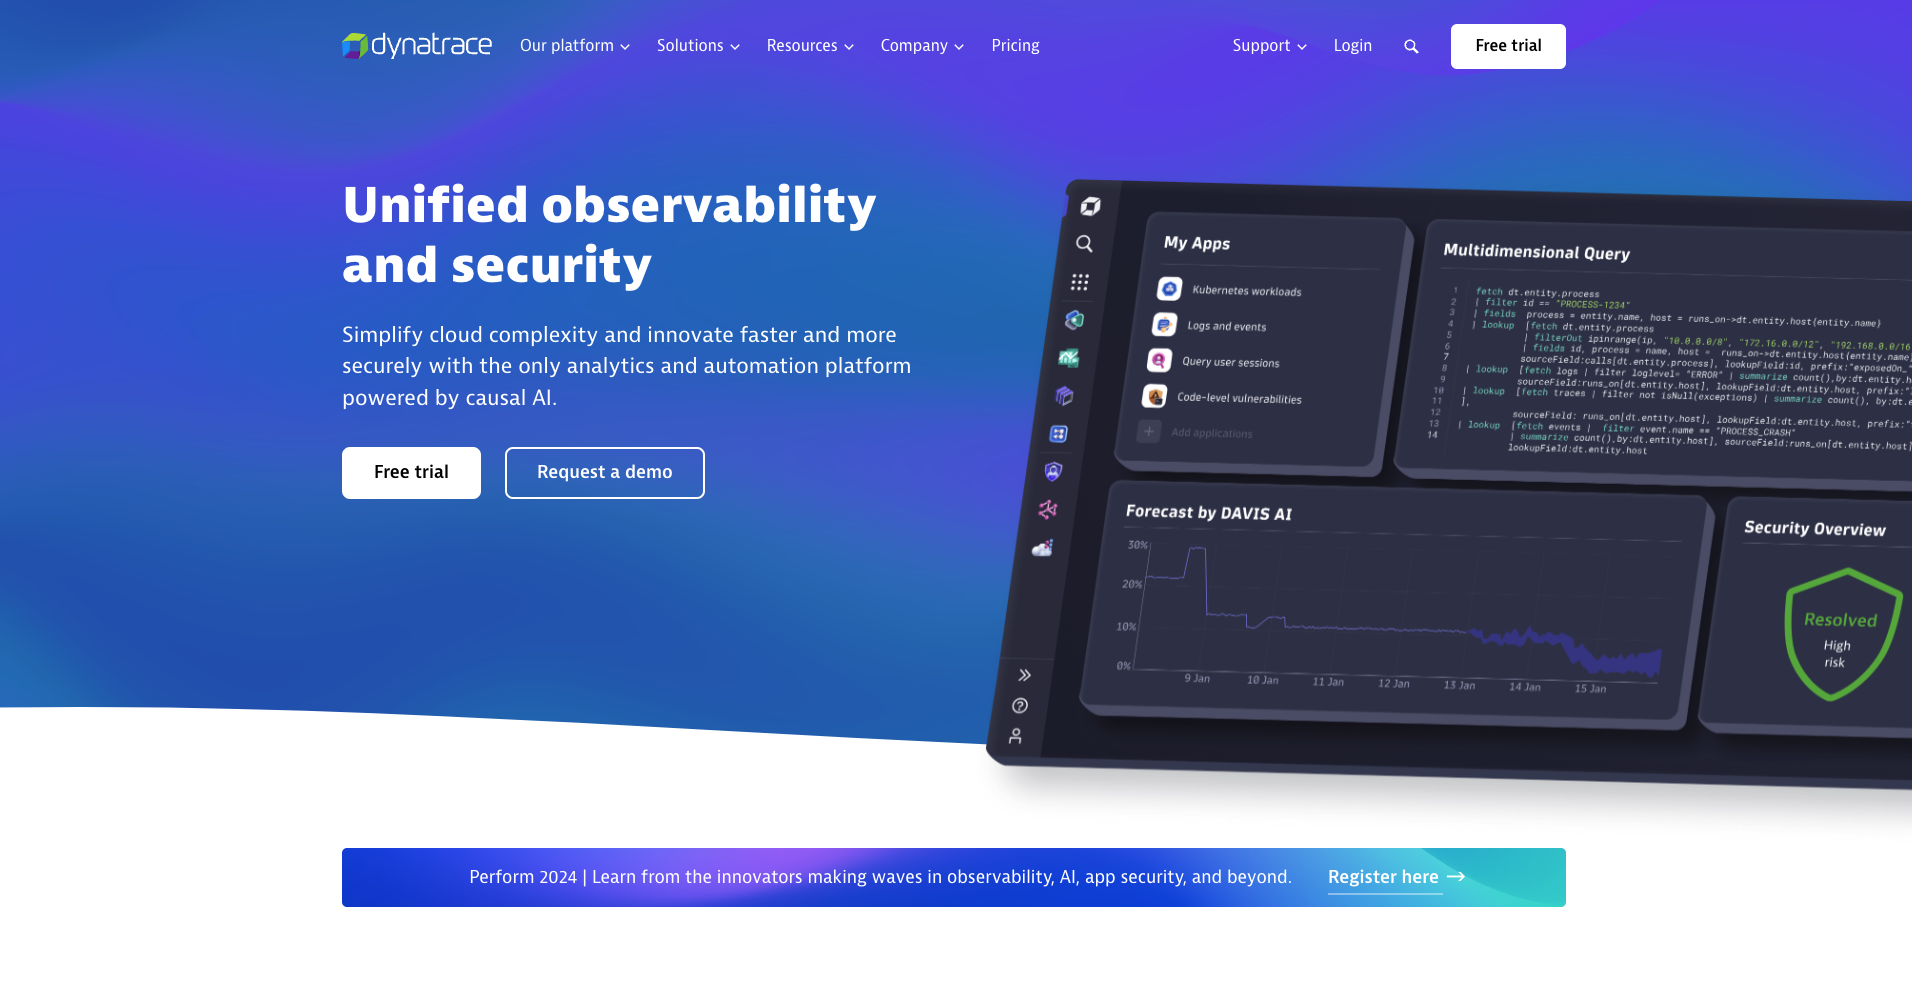
While its complexity and pricing may be hurdles for some, it remains a strong choice for high-quality port monitoring.
Key features
Dynatrace is an advanced platform offering analytics, automation, and AI-driven insights for unified observability and security. It aims to break down team barriers and proactively address issues, facilitating innovation and efficiency in modern cloud environments.
- Analytics
- Performance management
- Infrastructure observability
- Application security
- Discovery and digital experience management
Pricing
Dynatrace has several packages on offer. You can find port monitoring in their Synthetic Monitoring package, which costs $0.001 per synthetic request. There is a 15 day free trial to take advantage of as well.
| Pros | Cons |
| ✅AI-powered for swift problem detection and resolution | ❌Complex interface and usability |
| ✅Beneficial for quick issue identification | ❌Higher cost based on multiple factors |
7. SolarWinds Pingdom
Pingdom offers a user-friendly and reliable port monitoring solution, covering website uptime, page speed, and more.
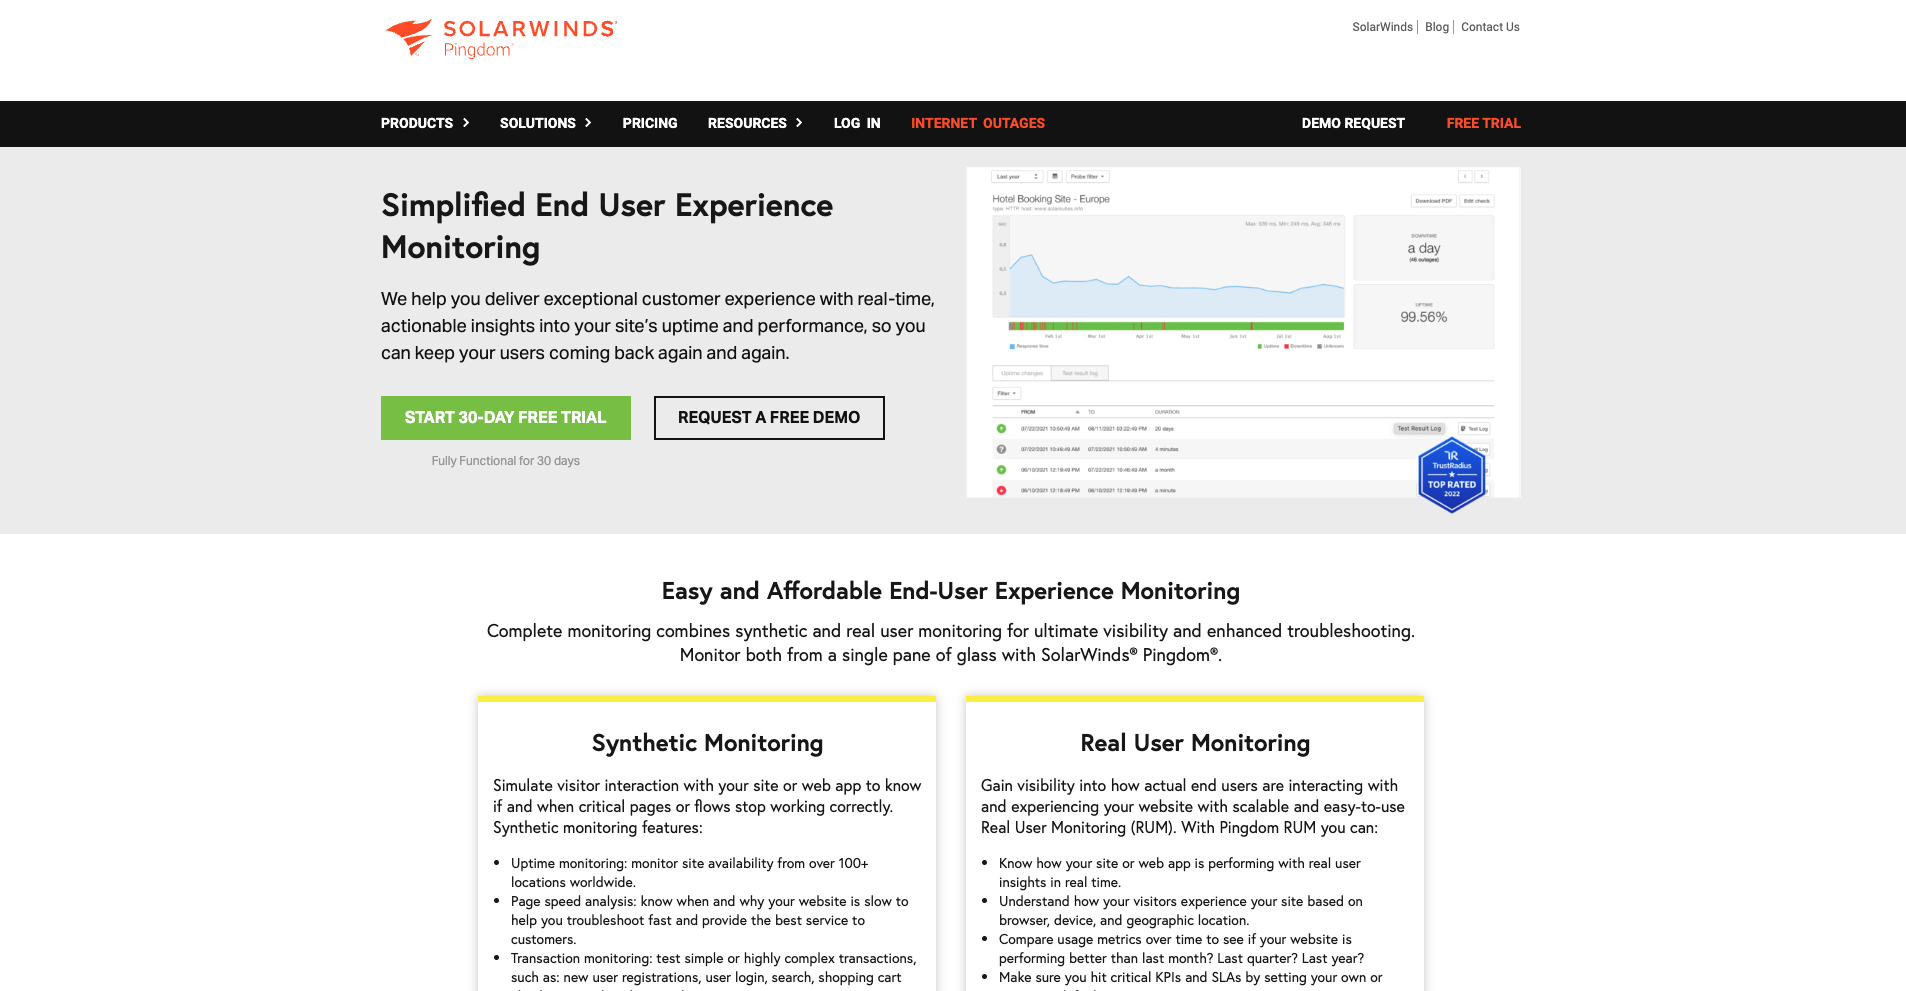
While it may lack some advanced features for port-specific monitoring, its simplicity and reliability make it a popular choice.
Want a more detailed breakdown of UptimeRobot and Pingdom? Check out our full comparison of UptimeRobot as an alternative to Pingdom.
Key features
SolarWinds Pingdom has been a player in the monitoring field for a while, offering a wide range of features across various platforms.
This tool is just one part of a larger suite of services, but you can test it out, along with some other monitoring tools, during a free trial.
SolarWinds offers a comprehensive monitoring solution. For basic uptime and port monitoring, you’ll find these under the Network category within Synthetics monitoring, which includes:
- TCP Port monitoring
- Ping monitoring
- DNS monitoring
- UDP monitoring
- Domain/IP monitoring
For more advanced needs, SolarWinds also offers the Engineer’s Toolset, a comprehensive package with 60 tools designed for in-depth network management. These include:
- Diagnostic tools
- Real-time alerting and monitoring
- Network stress testing
- Automated network discovery
- IP address and DHCP scope monitoring
Pricing
Pingdom has a wide range of pricing options, given their extensive array of services.
Their basic uptime and port monitoring is notably more expensive compared to UptimeRobot, for instance, 100 uptime checks cost $110 per month billed annually, while UptimeRobot’s Team plan includes 100 monitors with 30-second checks. See current UptimeRobot prices on the pricing page.
For the Engineer’s Toolset alone, there’s a 14-day free trial available, and you can request a quote on the SolarWinds site.
If you’re interested in adding other toolsets, you can include them in your quote to create a customized bundle.
| Pros | Cons |
| ✅Straightforward and dependable | ❌Lacks in-depth port monitoring functions |
| ✅Popular choice for basic needs | ❌May not suit those needing extensive tracking |
8. Site24x7
Site24x7 offers a feature-rich port monitoring solution with real-time notifications and integrations like Slack.
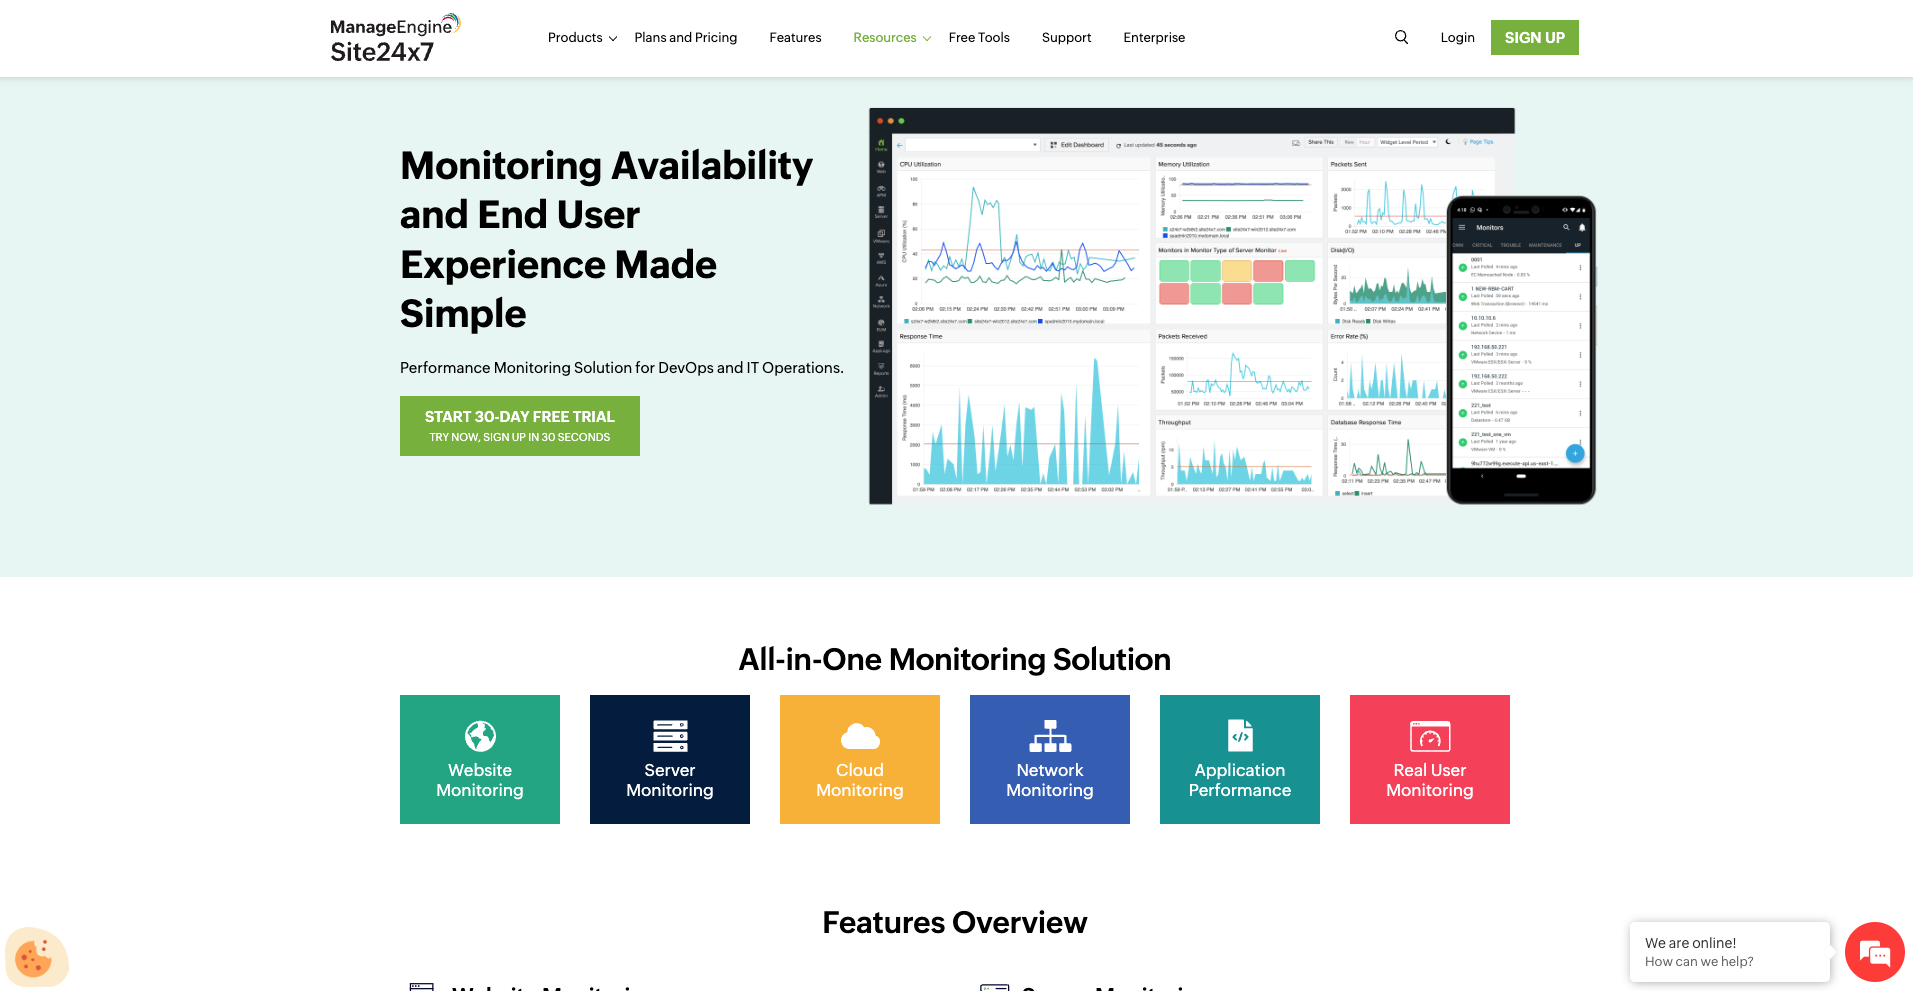
While its complexity and cost may not suit everyone, its versatility makes it a strong option for those in need of the complete suite of monitoring services.
Not sure about UptimeRobot vs. Site24x7? Get all the info on our comparison page.
Key features
In addition to port monitoring, Site24x7 provides a variety of other monitoring options, making it a versatile choice for maintaining network health.
However, Site24x7 does fall short in some areas compared to UptimeRobot. Its free plan doesn’t include a status page.
The broad range of services in their portfolio includes:
- Website monitoring
- Server monitoring
- Cloud monitoring
- Network monitoring
- Real user monitoring
- Application performance
Pricing
While the pricing structure for Site24x7 might initially seem complex, you can try out the service with a 30-day free trial to see if it meets your needs.
They also have a forever free plan that monitors up to 50 resources with email alerts.
The Web Uptime plan starts at $9 per month billed annually and includes 25 websites, 1-minute checks, and 1 monitoring location.
| Pros | Cons |
| ✅Comprehensive features and integrations | ❌Complex interface |
| ✅Suited for a broad range of monitoring tasks | ❌Higher cost |
9. Paessler PRTG Network Monitoring
Paessler’s PRTG Network Monitoring provides a thorough port tracking solution that offers visibility into IT infrastructure, traffic flow, and performance metrics.

Its feature set helps identify bottlenecks and ensures reliable uptime across various components.
Key features
PRTG offers a comprehensive network monitoring solution that goes beyond simple monitoring. When you enroll with PRTG, you’ll also gain insights into the well-being and efficiency of:
- Network devices (like servers, switches, and routers)
- Virtual platforms
- Services and websites
- Operating systems and data centers
- Network traffic
- Resource usage
Pricing
PRTG is sold as an annual subscription, and the license size depends on how many sensors you need. The downside is that it’s not cheap.
The entry-level PRTG 500 license costs $200 per month billed annually, and PRTG 10000 costs $1,642 per month billed annually.
After a 30-day free trial, your account will automatically switch to the freeware version.
| Pros | Cons |
| ✅Extensive monitoring and alert customization options | ❌Sensor-based pricing model |
| ✅Ideal for businesses with diverse port monitoring needs | ❌Requires time investment to learn all features |
| ✅Essential for safety and efficiency |
10. ManageEngine OpManager
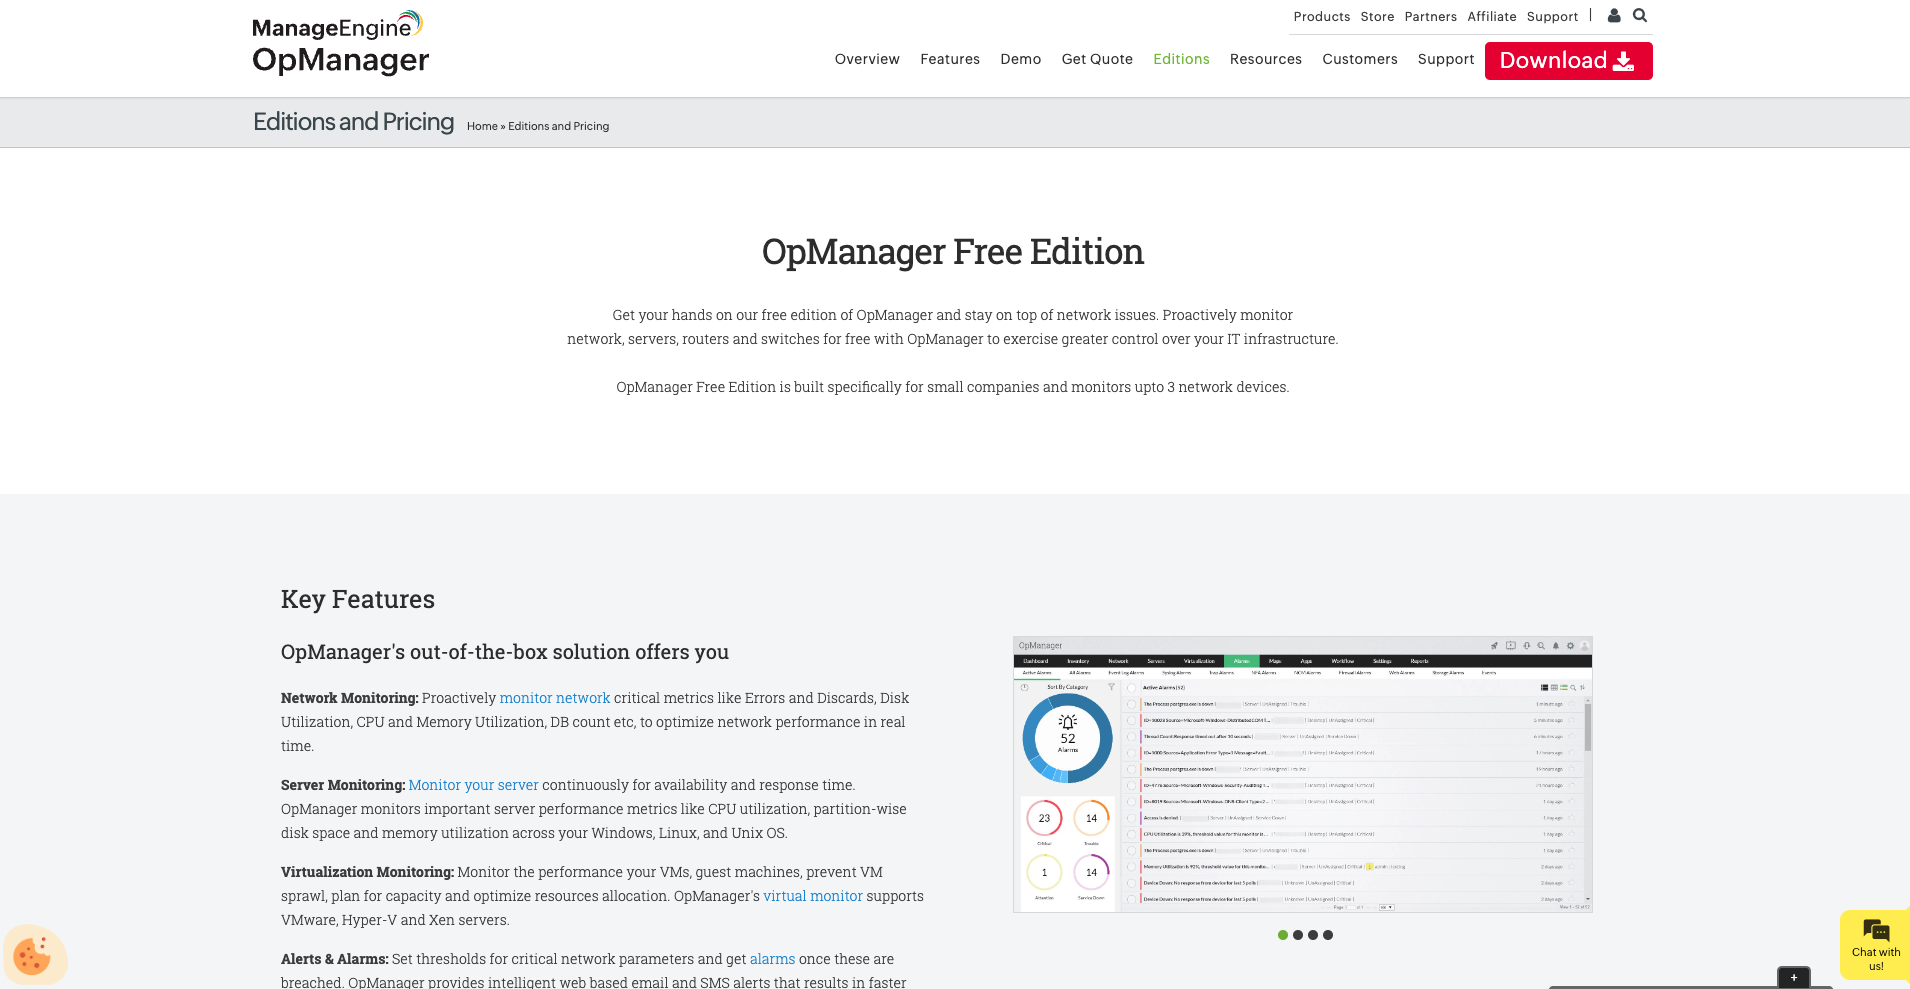
ManageEngine OpManager offers a robust port monitoring solution, emphasizing network device performance and bandwidth analysis. Its ease of use and comprehensive feature set make it ideal for businesses seeking detailed insights into their network’s health.
Key features
With this tool you’ll get a wide array of functionalities focused on optimizing network performance and ensuring uptime. Its comprehensive dashboard allows for easy monitoring and management of network devices, bandwidth usage, and port activities.
- Network device performance monitoring
- Bandwidth analysis and traffic pattern tracking
- Customizable dashboards and reporting
- Real-time alerts and notifications
- Port mapping and switch port management
- Automated network configuration management
Pricing
OpManager follows a flexible pricing model, catering to different organizational sizes and needs. They offer a free version for up to 3 devices, ideal for small businesses or trial purposes.
You can buy the Standard and Professional editions as an annual subscription or a perpetual license. Both are priced by the number of devices, with more features in the Professional edition.
| Pros | Cons |
| ✅Comprehensive and customizable features | ❌Can be overwhelming for beginners |
| ✅Effective for large-scale network monitoring | ❌Pricing might be steep for small businesses |
How to choose a port monitoring tool
Armed with the knowledge of our top 10 port monitoring tool picks, how will you choose the right one? Here are some steps you can take before taking the plunge and committing:
- Consider factors like network size, budget, and the features you need the most.
- Find a solution that aligns with the specific needs of your devices and network without going over your budget.
- Each tool has its own set of capabilities! Take the time to assess them based on your most important requirements.
- Aim for a tool that is user-friendly and matches your network’s prerequisites for optimal effectiveness.
Port monitoring tools: A complete comparison
| Free Plan | Price for 100 Monitors | Mobile App | |
| UptimeRobot | ✅Lifetime – 50 monitors | ✅€35 / month | ✅Included for free |
| Statuscake | ✅Available | $20.41 / month | ✅Included for free |
| Dotcom-monitor | ✅Up to 25 targets | 👍Available | |
| BetterStack | ✅Available | ❌$71 / month for 110 monitors (billed annually) | 😐Only for push notifications |
| PRTG | Freeware | Free up to 100 for trial | ✅Included for free |
| Uptime Kuma | 👍Open source | 👍Free | ❌Not available |
| Dynatrace | ❌Not available | ✅Included for free | |
| Pingdom | ❌Not available | ❌$110 / month (billed annually) | ❌Not available |
| Site24x7 | ✅Up to 50 resources | ❌$45 / month for 125 monitors | ✅Available |
| ManageEngine OpManager | 👍For three devices | ❌Priced by device count | 👍Yes |
Most important metrics in port monitoring
Understanding the nuances of port monitoring is essential in network management, as it sheds light on the overall health and efficiency of the network. Focusing on certain key metrics allows network administrators to effectively evaluate and enhance the network’s efficiency, security, and reliability. Below are some pivotal metrics to consider:
- Bandwidth usage: Measures the amount of data transmitted over a network port within a specified period. High bandwidth usage can indicate heavy traffic or potential bottlenecks, affecting network performance.
- Error rates: Refers to the number of error packets versus total packets over a network port. A high error rate can signify hardware issues, misconfigurations, or network congestion.
- Packet loss: Tracks the percentage of packets that fail to reach their destination. Packet loss can severely impact network efficiency and is often an indicator of network congestion or hardware failures.
- Latency: measures the time taken for a packet to travel from its source to its destination. High latency can lead to slow network response times and can be caused by a variety of factors including distance, network congestion, or poor routing.
- Port status (up/down): indicates whether a port is active (up) or inactive (down). Monitoring port status is essential for identifying disconnected devices or failed ports.
- Utilization trends: Analyzes the usage pattern of network ports over time. Understanding utilization trends helps in capacity planning and ensures that the network can handle future demands.
- Traffic type and volume: identifies the types of data (e.g., HTTP, FTP) and the volume of traffic passing through network ports. This metric is crucial for network security and optimizing traffic management.
How port monitoring tools reveal failures other checks miss
Port monitoring looks simple, but it catches an entire class of failures that uptime and ping checks overlook. A server can be reachable and still unusable if the right ports are closed, blocked, or misrouted.
At its core, port monitoring answers a precise question: is a specific service accepting connections on the expected port? That matters because many outages are service-level, not host-level. A web server might be running, but HTTPS is down. A database might be up, but refusing connections. Ping and basic uptime stay green while users fail.
This makes port monitoring especially useful for layered systems. Load balancers, proxies, and firewalls can break independently of the application. A misapplied firewall rule or security update can silently block traffic. Port checks surface these issues immediately.
Protocol context adds value. Good port monitoring tools do more than check “open” or “closed.” They confirm the service responds correctly during the connection attempt. A port that accepts connections but drops them instantly still represents failure from the client’s perspective.
Port monitoring also helps with change detection. Infrastructure changes often move services between ports, switch from HTTP to HTTPS, or introduce new listeners. Monitoring the expected ports confirms that deploys and config changes landed as intended.
False confidence is the main risk. An open port does not guarantee the service behind it works correctly. Applications can accept connections and still return errors. That is why port monitoring works best as a middle layer, paired with higher-level checks like HTTP responses or application health endpoints.
Alert tuning matters here too. Short network blips happen. Alerting on a single failed connection creates noise. Reliable tools retry and require consecutive failures before paging. This keeps port monitoring actionable instead of chatty.
Another key advantage is independence. External port checks still fire when internal monitoring agents or the host itself are unreachable. That outside view often catches problems first, especially during network or firewall incidents.
Port monitoring is not about watching every port. It is about watching the ports that define whether a service is usable. When those go dark, users feel it immediately.
Conclusion
Port monitoring software is absolutely necessary for maintaining peak performance and security in your network. Taking the time to carefully evaluate our list of top 10 port monitors can guide you toward the ideal solution that fits both your resources and specific needs.
This due diligence is the first step to an investment in long-term efficiency and security for all your digital operations.
Finding the right tool tailored to your unique requirements can be a game-changer. Thank you for journeying with us through this in-depth look at the best port monitoring software available today, and happy monitoring!
Disclaimer: The information provided on this page is for informational purposes only. Our rankings and reviews are based on our own research and analysis, aimed at providing unbiased, objective, and reliable information to our readers. Despite our affiliation, we strive to maintain objectivity and factual accuracy in our content.
However, we cannot guarantee that all information presented is up-to-date or entirely accurate. We encourage you to conduct your own research and consult with professionals before making any decisions based on the information found on this page. If you detect any inaccuracies, please do not hesitate to inform us.
Frequently asked questions
What is port monitoring used for?
Port monitoring checks whether a specific TCP or UDP port on a host is open and accepting connections. It helps verify that a service is reachable at the network level. This is commonly used for databases, mail servers, and custom applications.
How is port monitoring different from ping monitoring?
Ping only checks basic network reachability using ICMP. Port monitoring confirms that a specific service is listening on a specific port. A host can respond to ping while the service on its port is down.
Which services are commonly monitored with port checks?
Common examples include HTTP (80), HTTPS (443), SMTP (25/465/587), SSH (22), databases like MySQL (3306), and custom app ports. You should monitor the same port your application actually uses. Monitoring the wrong port gives false confidence.
What causes a port monitoring check to fail?
Failures usually come from the service being stopped, firewall rules blocking the port, or network issues between the checker and host. Configuration changes and deployments are frequent triggers. Expired certificates can also affect encrypted ports.
Can port monitoring detect application-level issues?
No. Port monitoring only confirms that a connection can be established. It doesn’t validate responses, content, or business logic. For application health, pair port checks with protocol-specific monitoring.