TL;DR (QUICK ANSWER)
Python’s logging module gives you a consistent way to record what your app is doing without relying on print(). In production, the goal is simple: log the right events at the right severity level, in a format that’s easy to search, and ship those logs somewhere reliable.
Use module-level named loggers, configure handlers and formatters once at startup (often with dictConfig), and reserve DEBUG for targeted troubleshooting. If you’re running multiple services or need better filtering and correlation, move to structured logs (often JSON) with fields like request_id and user_id.
Finally, keep logging safe and fast by avoiding sensitive data, rotating files, and using queue-based patterns when log I/O starts slowing your app down.
Logging is how Python apps explain themselves when something goes wrong in production. The logging module gives you log levels, consistent formatting, and flexible output (console, files, or log platforms) without rewriting your code every time requirements change.
This guide walks through the logging pipeline (logger, handler, formatter), shows correct configuration for multi-module projects, and covers production patterns like JSON logs, rotation, and performance-safe logging.

Key takeaways
- Use named, module-level loggers (logging.getLogger(__name__)) and configure output centrally at app startup.
- Treat level choice as an ops contract: DEBUG for diagnosis, INFO for normal milestones, WARNING for abnormal but recoverable states, ERROR for failed operations, CRITICAL for service-threatening failures.
- basicConfig() is fine for scripts, but production setups should use handlers + formatters (often via dictConfig) so you can route logs to console, files with rotation, and external collectors cleanly.
- Use structured fields (often JSON) when logs will be searched, aggregated, or correlated with metrics and traces.
- Protect performance by avoiding noisy logs in hot paths, using lazy formatting (logger.debug(“x=%s”, x)), and considering queue-based logging when I/O becomes a bottleneck.
- Never log secrets or PII. Add masking early so you do not “fix it later” after sensitive data is already stored.
What is Python logging?
Logging in Python is the practice of recording information about a program’s execution. Unlike temporary print statements used for quick debugging, logging provides a structured, persistent, and configurable way to track events, errors, and system behavior over time.
Python logging levels
Python provides five built-in logging levels to classify log messages by severity: DEBUG, INFO, WARNING, ERROR, and CRITICAL.
Although custom levels can be defined, these five are sufficient for almost all logging needs.
Why logging matters
Logging is how you understand production behaviour without guessing.
It helps you:
- Debug real failures: identify what broke, where it broke, and what triggered it.
- Alert on issues early: levels make it possible to spot warning patterns and page on real errors.
- Add context to metrics and traces: logs explain why latency or errors are happening.
- Keep an audit trail: record key actions for security, compliance, and investigations.
Logging vs. debugging tools
Logging and debugging solve different problems.
Debuggers let you pause execution and inspect state during development. Logging records what happened during execution, especially in production, where you cannot pause or replay real traffic.
Use debugging tools to investigate issues locally. Use logging to understand failures after they occur in live systems.
How does the Python logging module work?
The Python logging module is built around a few core components that work together to collect, process, and output log messages.
Logger → Handler → Formatter → Output
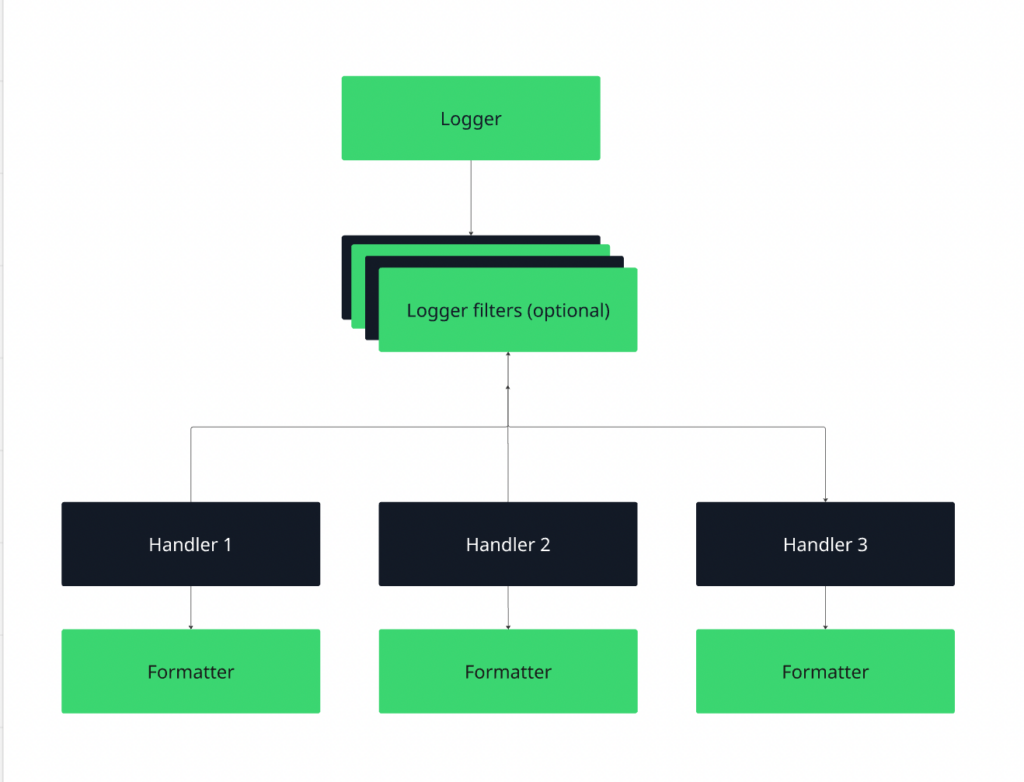
Figure 1: Python logging workflow
- The logger creates the log record.
- The handler decides where it goes (console, file, external system).
- The formatter defines its structure (plain text, JSON, timestamped, etc.).
When you call logger.info(…), the record flows through this pipeline and is written to one or more configured handlers.
Loggers are hierarchical. A logger named app.database inherits configuration from app, which inherits from the root logger. By default, messages propagate upward, allowing centralized configuration with optional overrides for specific modules.
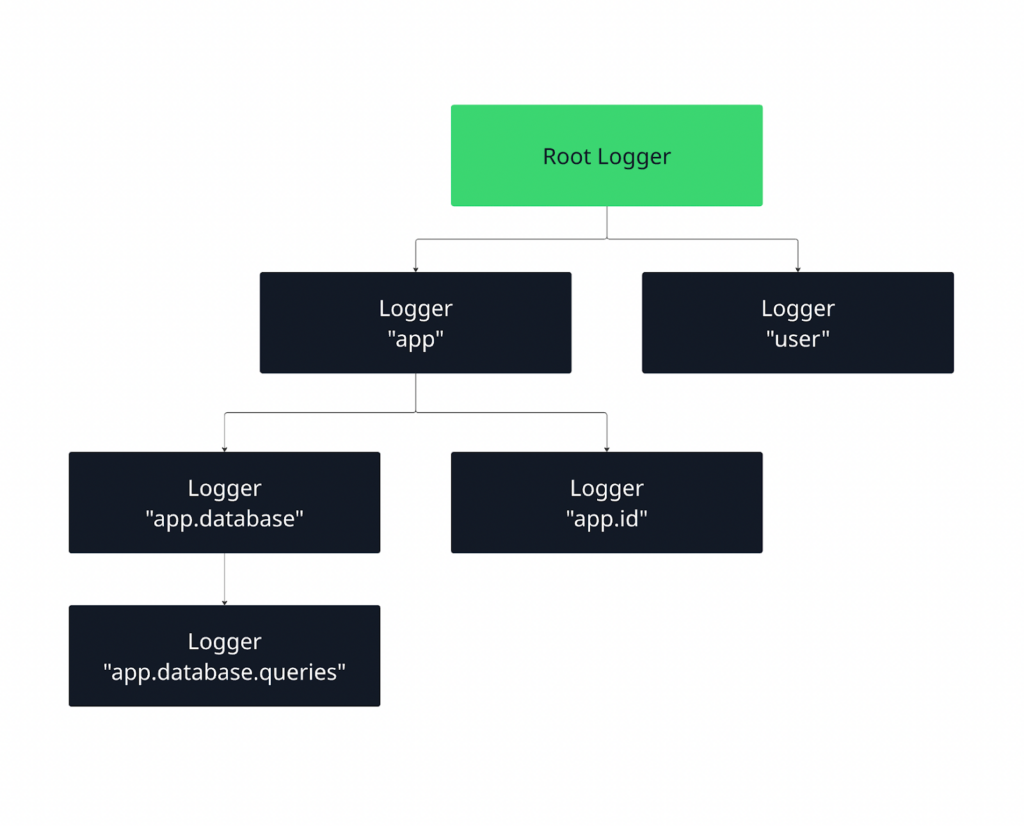
Figure 2: Python logging hierarchy
When a log message is emitted, it is first handled by its own logger and then, by default, propagated upward to parent loggers. This allows you to define behavior at a higher level (like the root logger) while still having fine-grained control over specific parts of your application.
Let us learn more about all three components.
Loggers
Loggers are the main interface your code interacts with. You call methods like debug(), info(), or error() on a logger to record events. Each logger has a name and a severity level, which determines which messages it will process.
Loggers don’t decide where messages go; they simply create log records and pass them up the hierarchy.
Root vs. named logger
The root logger exists by default and sits at the top of the logging hierarchy. When you call functions like logging.info(…), you are using the root logger. This is fine for small scripts, but in larger applications it limits control over levels, handlers, and formatting.
Named loggers, created with logging.getLogger(“name”), give you that control. They let you configure different parts of your application independently, which is why production systems rely on named loggers instead of the root logger.
What is a module-level logging pattern?
The recommended pattern in Python is to create one logger per module using the module’s name:
import logging
logger = logging.getLogger(__name__)
This automatically places the logger in the hierarchy based on your module structure.
For example, app.auth and app.payments become separate loggers that can be configured independently if needed, while still inheriting shared behavior from their parent loggers.
This pattern keeps logging consistent, scalable, and easy to manage, especially in multi-module and production-grade applications.
Handlers
Handlers control where log messages are sent. A single logger can have multiple handlers attached, which means the same log message can be written to different destinations at the same time, such as the console and a file. Choosing the right handler depends on how and where you want to consume your logs.
- Console handler (StreamHandler)
Sends logs to standard output (stdout or stderr). This is ideal during local development, debugging, and containerized environments (like Docker or Kubernetes), where logs are typically collected from stdout by the platform. - File handler (FileHandler)
Writes logs to a file on disk. This is useful when you need persistent logs for later inspection, auditing, or offline analysis. File handlers are common in traditional server deployments but require careful management to avoid disk space issues. - Rotating file handler (RotatingFileHandler, TimedRotatingFileHandler)
Automatically rotates log files based on size or time intervals. Use this in production systems to prevent log files from growing indefinitely.
Size-based rotation works well for high-volume logs, while time-based rotation is ideal for daily or hourly log analysis and compliance requirements.
- HTTP handler (HTTPHandler)
Sends log records to a remote HTTP endpoint. This is useful when integrating directly with centralized logging or observability systems that accept logs over HTTP. It’s typically used in distributed systems where logs need to be collected and processed centrally.
Formatters
Formatters define how a log message looks. While loggers decide what to log and handlers decide where logs go, formatters control the structure and content of each log entry.
At a basic level, a formatter specifies which pieces of information are included in a log message and in what order. Common elements include the timestamp, log level, logger name, and the actual message.
For example, a formatter might produce output like:
2026-02-23 10:15:42,123 - app.auth - INFO - User login successful- Timestamps help you understand when an event occurred and are critical for debugging, auditing, and correlating logs across systems.
- Log levels (DEBUG, INFO, WARNING, ERROR, CRITICAL) indicate the severity of the event and are essential for filtering and alerting.
- Metadata such as the logger name, module, function, or request ID provides context about where and why the log was generated.
In production systems, formatters often go beyond plain text and use structured formats like JSON, making logs easier for machines to parse, search, and analyze in centralized logging and observability tools.
Logging levels explained with real examples
Below are the standard Python logging levels, explained with practical, real-world examples to show when and why you should use each one.
DEBUG
DEBUG is used to capture detailed, low-level information about the application’s behavior. These logs are mainly for developers to understand the flow of execution and inspect internal state during development or troubleshooting.
Example:
logger.debug("User payload received: %s", payload)In this example, the logger records the exact data (payload) received from a user request. This allows developers to see the raw input the system received and trace how it flows through the application.
For instance, if a bug occurs later in processing, you can refer back to the DEBUG log to check whether the input data was malformed or unexpected.
When to use:
- Inspecting variable values
- Tracing execution flow
- Diagnosing hard-to-reproduce bugs
Tip: DEBUG logs are often too verbose for production. They’re best enabled temporarily when troubleshooting.
INFO
INFO logs are used to confirm that the application is working as expected. They provide higher-level, meaningful messages about normal operations, without the detail that DEBUG logs capture.
Example:
import logging

logging.basicConfig(level=logging.INFO)
logging.info("User 123 successfully logged in")
Here, the logger records that the user with ID 123 has successfully logged in. INFO logs give you a clear view of system activity and confirm that key operations are completing as intended. It can help you track successful logins, completed transactions, or the startup of services.
When to use:
- Confirming normal operations
- Tracking key business or system events
- Providing insight into routine workflows
WARNING
WARNING logs indicate that something unexpected happened or may happen in the future. The application can still run, but the log signals that attention may be needed to prevent a potential problem from escalating.
Example:
import logging

logging.basicConfig(level=logging.WARNING)
logging.warning("Disk usage at 85% capacity")
In this example, the logger warns that disk usage is approaching a critical threshold. The system is still functioning normally, but the warning signals that action may be needed soon, such as cleaning up files or increasing storage.
WARNING logs help you catch issues early, before they turn into errors or critical failures.
When to use:
- Deprecation notices
- Approaching resource limits (disk, memory, CPU)
- Retryable or recoverable issues
ERROR
ERROR logs indicate that a serious problem has occurred that prevented a specific operation from completing. The application may still continue running, but something went wrong that requires investigation.
Example:
import logging

logging.basicConfig(level=logging.ERROR)
logging.error("Failed to process payment for order 456")
Here, the logger reports that the payment processing for order 456 failed. This is a clear signal that an operation did not succeed, and corrective action may be required.
ERROR logs help developers and operators identify failed operations that impact functionality, such as failed database queries, API errors, or exceptions that were caught but need attention.
When to use:
- Exceptions that prevent a request or operation from completing
- Failed critical transactions
- Recoverable but significant issues
CRITICAL
CRITICAL logs indicate severe errors that may stop the application or system from running. These logs require immediate attention and often trigger alerts to on-call engineers.
Example:
import logging

logging.basicConfig(level=logging.CRITICAL)
logging.critical("Database unavailable. Shutting down service.")
In this example, the logger signals that the database is unavailable, which may prevent the service from functioning at all. CRITICAL logs represent unrecoverable or high-impact failures that could halt the system. They are essential for alerting and fast response to prevent downtime or data loss.
When to use:
- Application startup or initialization failures
- Corrupted configuration or critical system resources unavailable
- Unrecoverable system errors
How to pick the right logging level
Refer to this table to easily pick the right level depending on severity, impact, and context.
| Level | Purpose | When to use | Production tip |
| DEBUG | Detailed diagnostic info | Inspect variables, trace execution, diagnose bugs | Usually disabled in production; verbose |
| INFO | Confirm normal operations | Record routine events, startup, and completed tasks | Safe to keep; monitors system health |
| WARNING | Signals potential issues | Unusual conditions that don’t break the app | Monitor; may indicate future problems |
| ERROR | Operation failed, but app continues | Failed transactions, exceptions, recoverable failures | Should be monitored; requires investigation |
| CRITICAL | Severe failure may stop the application | Unrecoverable errors, system crashes | Triggers alerts; immediate action needed |
Basic Python logging example
Let’s understand Python logging with a simple example using default settings:
import logging

logging.debug("This is a DEBUG message")
logging.info("This is an INFO message")
logging.warning("This is a WARNING message")
logging.error("This is an ERROR message")
logging.critical("This is a CRITICAL message")
What happens when you run this code:
- The DEBUG and INFO messages do not appear.
- The WARNING, ERROR and CRITICAL messages do.
Why?
By default, the logging module is set to show messages at the WARNING level or higher. This means that less severe messages, like DEBUG and INFO, are ignored unless you explicitly change the logging level.
To see all messages, you can configure the logging module using basicConfig(). For example:
import logging

logging.basicConfig(level=logging.DEBUG, format='%(levelname)s: %(message)s')

logging.debug("This is a DEBUG message")
logging.info("This is an INFO message")
logging.warning("This is a WARNING message")
logging.error("This is an ERROR message")
logging.critical("This is a CRITICAL message")
In this configuration,
- level=logging.DEBUG tells Python to display all messages at DEBUG level and above (DEBUG, INFO, WARNING, ERROR, CRITICAL).
- format=’%(levelname)s: %(message)s’ customizes how the messages appear. Here, it displays the severity level first, followed by the actual message.
Now, when you run the code:
- All five messages, DEBUG, INFO, WARNING, ERROR, and CRITICAL, are printed to the console.
- This shows how logging level and formatting control what messages you see and how they are presented.
Why is basicConfig limited?
While level.basicConfig() is convenient for small scripts, it has several limitations in larger applications:
- Single configuration only
basicConfig can only be called once per Python process. If you try to call it again, it has no effect unless you reset the logging system. This limits flexibility when different modules need different logging setups.
- Limited to one handler
By default, basicConfig creates only a single StreamHandler (console output). If you want logs to go to a file, network, or multiple destinations, you need to manually create and attach additional handlers.
- Global scope
basicConfig configures the root logger globally. In large applications, you often want module-level loggers with different levels or outputs. basicConfig cannot provide that granularity.
- Limited formatter options
While you can specify a simple format string, more advanced formatting, like different formats for different handlers, requires creating Formatter objects manually.
In short, basicConfig is perfect for quick testing or small scripts, but production-ready applications benefit from creating named loggers, handlers, and formatters, which provide full control over log levels, outputs, and formats.
Configuring logging the right way
Python gives you multiple ways to configure logging, and understanding them will help you build maintainable, scalable, and consistent logging across your project.
Configuration using code
The simplest approach is to configure logging directly in your Python code using basicConfig or by creating loggers, handlers, and formatters manually.
import logging

logging.basicConfig(
    level=logging.INFO,
    format="%(asctime)s - %(name)s - %(levelname)s - %(message)s"
)
logger = logging.getLogger(__name__)
logger.info("Application started")
This is quick and easy for small projects or scripts, but as your app grows, it can become messy to maintain.
Configuration using dictConfig
For larger applications, using a dictionary-based configuration (dictConfig) gives you full control over loggers, handlers, and formatters in a structured way.
from logging.config import dictConfig

LOGGING_CONFIG = {
    "version": 1,
    "formatters": {
        "detailed": {
            "format": "%(asctime)s - %(name)s - %(levelname)s - %(message)s"
        }
    },
    "handlers": {
        "console": {
            "class": "logging.StreamHandler",
            "formatter": "detailed",
        }
    },
    "root": {
        "handlers": ["console"],
        "level": "INFO"
    },
}

dictConfig(LOGGING_CONFIG)
logger = logging.getLogger(__name__)
logger.info("Structured configuration applied")
This pattern makes it easy to update settings, switch handlers, or apply structured logging without changing your application code.
Configuration using config files
Python also supports loading logging configuration from INI-style config files using fileConfig, which is handy for deployment environments where you want logging settings separated from code.
# logging.ini
[loggers]
keys=root

[handlers]
keys=consoleHandler

[formatters]
keys=defaultFormatter

[logger_root]
level=INFO
handlers=consoleHandler

[handler_consoleHandler]
class=StreamHandler
level=INFO
formatter=defaultFormatter
args=(sys.stdout,)

[formatter_defaultFormatter]
format=%(asctime)s - %(name)s - %(levelname)s - %(message)s
You can load this in Python:
import logging
import logging.config

logging.config.fileConfig("logging.ini")
logger = logging.getLogger(__name__)
logger.info("Logging configured via file")
Logging configuration for multi-module projects
In multi-module projects, it’s important to avoid duplicate logs. Each module should:
- Use a module-level logger (logger = logging.getLogger(__name__)).
- Avoid calling basicConfig() multiple times.
- Let the root logger or a centralized configuration handle handlers.
A good pattern is to have a centralized logging configuration module that sets up all loggers and handlers at application startup, and then each module just gets its logger:
# module_a.py
import logging
logger = logging.getLogger(__name__)
logger.info("Module A initialized")

# module_b.py
import logging
logger = logging.getLogger(__name__)
logger.info("Module B initialized")
This way, you avoid duplicate logs and maintain consistent formatting across the project.
Python logging best practices
Follow these best practices to maintain clean, reliable, and secure logging in both development and production environments.
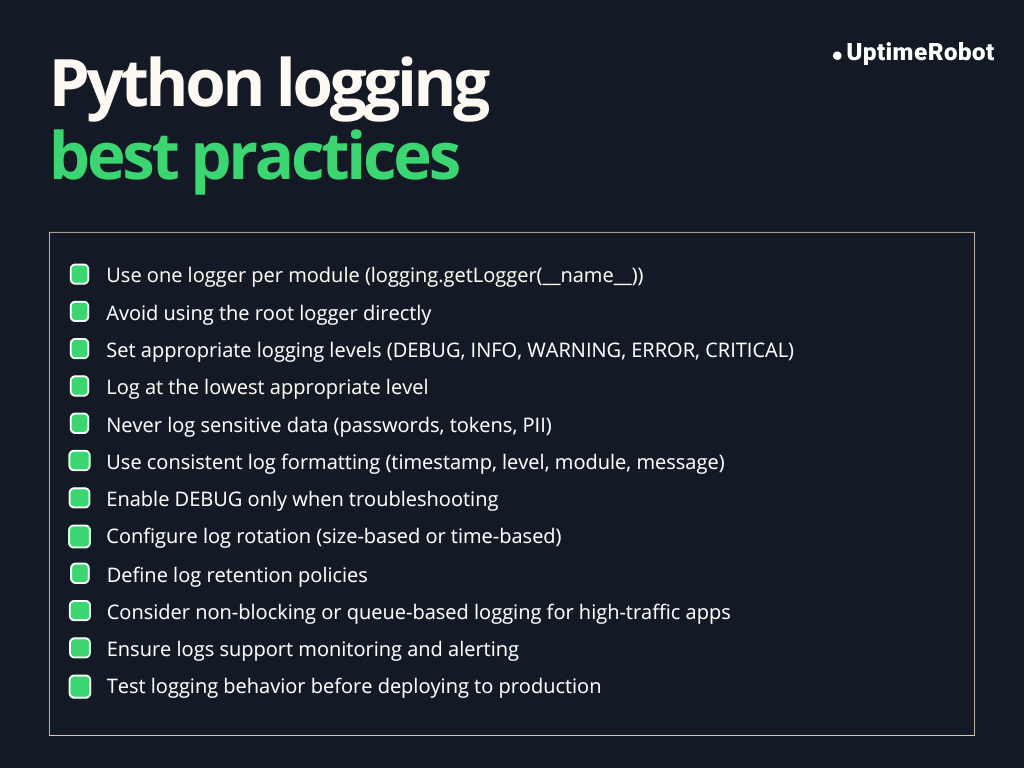
Figure 3: Python logging best practices
One logger per module
Creating a separate logger for each module ensures that logs are organized and easy to trace. Each logger inherits settings from the root logger unless overridden, making it easy to control logging behavior for specific modules.
import logging

logger = logging.getLogger(__name__)
logger.info("Module-level logging example")
Using __name__ automatically names the logger after the module, which helps identify where a log originated.
Never use the root logger directly
The root logger is global. Using it directly (logging.info(), logging.error()) can make it harder to manage logging levels and handlers in larger applications. Module-level loggers provide better control and prevent unintended side effects.
Do not log sensitive data
Logs are often stored or sent to external systems. Logging passwords, personal information, or API keys can create security and privacy risks. Always filter or mask sensitive data before logging.
Example:
user_password = "secret123"
logger.info("User logged in with password: %s", "******")  # Masked password
Use consistent formats
Consistent log formats make logs easier to read, parse, and analyze. Include at least:
- Timestamp (%(asctime)s)
- Log level (%(levelname)s)
- Logger name (%(name)s)
- Message (%(message)s)
Example format:
formatter = logging.Formatter('%(asctime)s - %(name)s - %(levelname)s - %(message)s')Avoid excessive DEBUG logging in production
DEBUG messages are extremely verbose and can:
- Flood logs
- Expose internal state
- Impact performance
Common Python logging mistakes and anti-patterns
Misusing logging can lead to noisy, inefficient, or even insecure logs. Understanding these common pitfalls helps you maintain clean, effective logging.
Using print instead of logging
Print() outputs go directly to the console and cannot be filtered by severity or redirected easily to files, monitoring systems, or external log aggregators. It does not integrate with Python’s logging configuration, resulting in inconsistent and difficult-to-manage logs.
Better approach
import logging

logger = logging.getLogger(__name__)
logger.info("Application started")  # Use logging instead of print
Logging inside tight loops
Logging repeatedly inside a loop can flood the logs and hurt performance, especially for DEBUG-level messages. It can make important logs hard to find among thousands of repetitive entries.
Better approach
Log once per significant event rather than every iteration. Aggregate information if necessary.
Over-logging exceptions
Logging every caught exception without context can create duplicate or noisy logs, especially if exceptions propagate up the stack. It can make it harder to identify the root cause.
Better approach
Log exceptions once, with meaningful context. Use logger.exception() when inside an except block to automatically include the traceback:
try:
    risky_operation()
except Exception as e:
    logger.exception("Failed during risky_operation")  # Includes stack trace
Hardcoding log levels
Using fixed log levels everywhere reduces flexibility. For example, setting all logs to DEBUG in production can flood logs, while setting all logs to ERROR may hide useful information.
Better approach:
Configure log levels centrally using basicConfig or handlers, and use appropriate levels per message: DEBUG for development, INFO for normal operations, WARNING for potential problems, ERROR for failures, and CRITICAL for severe issues.
Common logging mistakes and their correct alternatives:
| Mistakes | Correct approach |
| Using print() instead of logging | Use the logging module with appropriate levels (DEBUG, INFO, WARNING, ERROR, CRITICAL) |
| Logging inside tight loops repeatedly | Log once per significant event or aggregate information; avoid excessive per-iteration logging |
| Over-logging exceptions or duplicate logs | Use logger.exception() inside except blocks and log once with context; include stack trace if needed |
| Hardcoding log levels everywhere | Configure log levels centrally via basicConfig or handlers, and use appropriate levels for each message |
| Logging sensitive data (passwords, API keys) | Mask or avoid logging sensitive information to prevent security risks |
| Inconsistent log formats across modules | Use consistent formatters (timestamps, log levels, logger name, message) for all loggers |
Structured logging in Python
So far, we’ve discussed logging in a custom plain-text format that is easy for humans to read. However, in modern applications, logs are rarely read directly; they are usually processed by log aggregation and monitoring tools to extract insights quickly.
Plain-text logs are difficult for these tools to parse automatically and often require complex regular expressions to extract meaningful data.
Structured logging solves this problem by recording messages in a machine-readable format, typically as key-value pairs or JSON objects, rather than free-form text.
This makes logs easily parsable, filterable, and analyzable by logging systems, monitoring dashboards, or automated pipelines, enabling faster debugging, alerting, and operational insights.
Example (plain text vs. structured):
Plain text:
ERROR: User login failed for user_id=123Structured (JSON):
{"level": "ERROR", "event": "login_failed", "user_id": 123}Why JSON logs matter
JSON is the most common format for structured logging because:
- It is machine-readable and can be parsed by log aggregators.
- Supports nested fields and metadata.
- Makes it easier to search, filter, and correlate events in monitoring systems.
- Enables contextual logging (e.g., user IDs, request IDs) without losing structure.
When does structured logging become necessary?
Structured logging is most useful when:
- You run distributed systems or microservices, where logs need to be correlated across services.
- You use log aggregators or monitoring tools like ELK Stack, Splunk, or Datadog.
- You need to include metadata or context for debugging or auditing.
- You want logs to be consistently parsable for alerts, metrics, or analytics.
In small scripts or local development, plain-text logs may be sufficient. Structured logging excels in production environments.
JSON logging example
Here’s a clear example showing structured JSON logging in Python, including custom fields, request IDs, and user context:
import logging
import json

# Custom JSON formatter
class JsonFormatter(logging.Formatter):
    def format(self, record):
        log_record = {
            "level": record.levelname,
            "logger": record.name,
            "message": record.getMessage(),
        }
        # Include extra fields if available
        for key, value in record.__dict__.items():
            if key not in ["levelname", "name", "msg", "args", "levelno", "exc_info", "stack_info"]:
                log_record[key] = value
        return json.dumps(log_record)

# Create logger
logger = logging.getLogger("structured_logger")
logger.setLevel(logging.DEBUG)

# Add console handler with JSON formatter
handler = logging.StreamHandler()
handler.setFormatter(JsonFormatter())
logger.addHandler(handler)

# Example: logging with structured fields
logger.info(
    "User login successful",
    extra={"user_id": 123, "username": "alice", "request_id": "req-001"}
)

# Another example: logging an action with request context
def process_request(user_id, request_id):
    logger.info(
        "Processing user request",
        extra={"user_id": user_id, "request_id": request_id, "action": "data_fetch"}
    )

process_request(user_id=123, request_id="req-001")
In this code,
JsonFormatter:
- Converts the log record into a JSON object.
- Includes standard fields like level, logger, and message.
- Automatically adds any extra fields passed via extra={}.
Structured fields:
You can include metadata like user_id, username, action, or any other custom fields.
Request IDs and user context:
- request_id allows logs from a single request to be correlated across services.
- user_id helps trace actions by specific users.
Example output:
{"level": "INFO", "logger": "structured_logger", "message": "User login successful", "user_id": 123, "username": "alice", "request_id": "req-001"}
{"level": "INFO", "logger": "structured_logger", "message": "Processing user request", "user_id": 123, "request_id": "req-001", "action": "data_fetch"}
This setup allows logs to be machine-readable, filterable, and easily correlated, which is essential for monitoring, alerting, and debugging in production systems.
Efficient logging for high-performance applications
If logging isn’t managed properly, it can slow down your application and overwhelm your monitoring systems.
File I/O bottlenecks
Writing logs to files involves disk I/O, which can become a performance bottleneck in high-throughput applications. Every call to logger.info() or logger.error() may involve a write to disk, which blocks the executing thread until the operation completes.
For example, consider a web API handling thousands of requests per second. Synchronous file writes on every request could slow down response times.
Blocking vs. non-blocking logging
When Python logs a message, it can either block the application or log asynchronously.
Blocking logging
By default, Python’s logging is blocking. This means:
- When your code calls logger.info() or logger.error(), the program pauses until the message is fully written to its destination (a file or console).
- For small scripts or low-traffic applications, this pause is negligible.
import logging

logging.basicConfig(filename="app.log", level=logging.INFO)
for i in range(1000):
    logging.info(f"Processing item {i}")
In this loop, the program waits for each log to be written to the file before continuing. If the log file is on a slow disk or there are thousands of messages, this can noticeably slow your application.
Non-blocking logging
Non-blocking logging allows your program to continue running without waiting for the log message to be written. The log messages are handled asynchronously, often using a queue or an external logging service.
Common approaches:
- Queue-based logging: Log messages are added to a queue. A separate thread or process reads from the queue and writes logs in the background. This decouples the main application from the I/O work.
- External logging services or sockets: Log messages are sent over the network to centralized logging systems. The application doesn’t wait for the remote system to acknowledge each log, keeping performance high.
Why it matters:
- Blocking logging can create performance bottlenecks in high-throughput applications.
- Non-blocking logging ensures your application stays responsive while still recording all messages reliably.
Log rotation and retention
If you’ve ever looked at your application logs after a few months, you know how fast they can grow. Left unchecked, logs can fill up disk space, slow down searching, and even impact backups.
Thankfully, Python provides built-in handlers to help manage log rotation and retention, keeping your logs both useful and under control.
RotatingFileHandler
This handler rotates your logs based on file size. Once a log file reaches a certain limit, it’s archived, and a new file is started. Here’s an example:
from logging.handlers import RotatingFileHandler

handler = RotatingFileHandler(
    "app.log", maxBytes=5*1024*1024, backupCount=3
)
logger.addHandler(handler)- maxBytes defines the file size limit
- backupCount keeps the last N rotated files
This setup ensures that older logs are preserved while preventing disk usage from growing indefinitely.
Timed rotation
Sometimes, you might want to rotate logs based on time intervals rather than file size. That’s where TimedRotatingFileHandler comes in.
For example, you can rotate logs every day at midnight:
from logging.handlers import TimedRotatingFileHandler

handler = TimedRotatingFileHandler(
    "app.log", when="midnight", backupCount=7
)
logger.addHandler(handler)- when=”midnight” rotates every day at midnight
- backupCount=7 keeps the last 7 days of logs
Timed rotation is perfect for daily log analysis or meeting regulatory compliance requirements.
Retention strategies
How long you keep logs depends on your application and compliance needs:
- Short-term (a few days to a week): Useful for debugging and operational monitoring.
- Medium-term (30–90 days): Helps with incident investigation and trend analysis.
- Long-term (months or years): Required for auditing, legal, or compliance purposes.
By combining rotation with thoughtful retention policies, you can keep logs manageable, searchable, and under control, without ever worrying about running out of disk space.
Python logging in production environments
Logging in production is very different from logging in development. In live systems, logs are critical for monitoring, debugging, and auditing, and you need to consider factors like performance, concurrency, and reliability.
Let’s break this down by common production scenarios.
Logging in web apps
In web apps, multiple requests are handled simultaneously, often across threads or processes. Key considerations:
- Thread safety: Python’s logging module is thread-safe, so multiple threads can safely write logs to the same logger or handler.
- Request context: Include request IDs, user IDs, and session info in logs to correlate events across requests.
- Centralized logging: Use log aggregation tools (ELK, Datadog, Splunk) for easier analysis of traffic patterns, errors, and performance issues.
Logging in background workers
Background jobs or task queues (e.g., Celery, RQ) have their own logging considerations:
- Process safety: When using multiple worker processes, each process should write logs independently or via a centralized queue to avoid conflicts.
- File rotation: Use RotatingFileHandler or TimedRotatingFileHandler to prevent log files from growing indefinitely.
- Structured logging: Include task IDs, job parameters, and execution results to trace failures or performance bottlenecks.
Logging in async and event-driven systems
In async applications (e.g., asyncio) or event-driven systems:
- Avoid blocking logging calls in the event loop; they can slow down the system.
- Prefer queue-based or asynchronous logging handlers to write logs in the background.
- Maintain context propagation using async-local storage or libraries like contextvars for tracking request or event IDs.
Key points for production logging
Consider these points when logging in production environments.
- Process safety: Use handlers that support multiple processes safely, or route logs through a queue for async writing.
- Thread safety: Careful design ensures high concurrency doesn’t flood logs or slow the application.
- Deployment considerations:
- Use rotating logs to avoid disk bloat.
- Configure logging per environment: DEBUG logs in staging, INFO/WARNING/ERROR in production.
- Consider centralized logging and monitoring to aggregate logs from multiple instances or services.
Integrating Python logs with observability tools
To really see what’s happening in your applications, it’s important to integrate Python logs with observability systems. This lets you monitor activity, correlate logs with metrics and traces, and set up alerts that actually help you respond faster.
Centralized logging systems
Instead of keeping logs on individual servers, production apps typically send them to centralized logging platforms like ELK Stack (Elasticsearch, Logstash, Kibana), Datadog, or Splunk. Centralization makes it easy to:
- Aggregate logs from multiple services or instances.
- Search, filter, and visualize logs efficiently.
- Reduce reliance on manually checking log files across servers.
Correlating logs with metrics and traces
Observability helps connect events to system behavior. Modern monitoring relies on three pillars:
- Logs: Provide detailed events (errors, warnings, debug info).
- Metrics: Track numeric data like request latency, error rates, and CPU usage.
- Traces: Show the flow of requests across services.
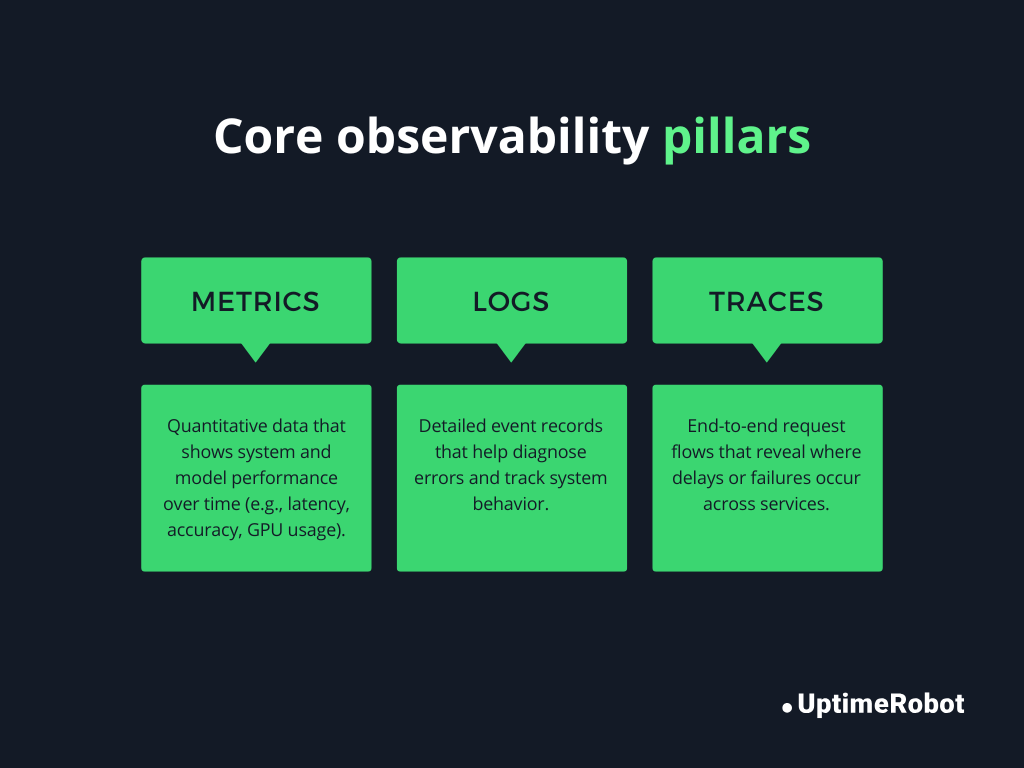
Figure 4: Core observability pillars
By adding structured fields like request_id or user_id in logs, you can correlate events across logs, metrics, and traces. This makes it much easier to trace a high-level issue down to the exact request or code path that caused it.
Example:
logger.info(
    "Payment processing failed",
    extra={"request_id": "req-123", "user_id": 456, "payment_id": "pay-789"}
)
Here, the request_id allows you to follow this request across different services in your tracing system, like OpenTelemetry.
Alerting based on logs
With logs centralized and structured, you can trigger alerts automatically. For example:
- Multiple ERROR logs in a short timeframe could trigger a page to the on-call engineer.
- A CRITICAL log in a payment service might immediately generate an alert in Slack or PagerDuty.
Tips for effective log-based alerting:
- Use structured logging to make filtering and triggering alerts precise.
- Avoid alerting on noisy logs (e.g., DEBUG messages).
- Include contextual metadata to make alerts actionable (which request, user, or service failed).
Security and compliance considerations
Production logs can include sensitive data, so it’s essential to handle them carefully. Failing to do so can expose your system to data breaches, regulatory penalties, or legal consequences.
Avoid logging credentials and PII
Never log passwords, API keys, social security numbers, or other personally identifiable information (PII). Even seemingly harmless data can be sensitive in aggregate. Only log non-sensitive identifiers or mask sensitive data.
Masking sensitive fields
When you need to log information that contains sensitive fields, mask or redact them before logging. Masking ensures operational visibility without exposing credentials.
For structured logging (JSON), you can implement a custom formatter that automatically masks sensitive fields.
GDPR and data retention implications
Compliance regulations like GDPR impose rules on how long user data can be stored. Logging PII improperly can lead to legal penalties. Best practices include:
- Avoid storing unnecessary personal data in logs.
- Implement retention policies to automatically delete or archive old logs.
- Anonymize or hash data where possible before logging.
Python logging vs. print statements
When building Python applications, you might be tempted to use print() to see what’s happening in your code. While print can work for quick debugging, there are significant differences between print and the logging module, especially in production systems.
| Feature | print() | logging |
| Severity levels | None | DEBUG, INFO, WARNING, ERROR, CRITICAL |
| Output control | Always prints to stdout | Can write to console, files, or external systems; configurable via handlers |
| Filtering | None | Can filter messages by severity or source |
| Formatting | Manual | Supports structured, timestamped, or JSON formats |
| Performance | Can block execution if stdout is slow | Can use asynchronous or queue-based handlers to avoid blocking |
| Integration with monitoring | No | Easily integrates with observability tools, metrics, and alerting systems |
Use print() for:
- Quick ad-hoc debugging during local development.
- Learning Python or writing small scripts with no production concerns
Why logging is mandatory for production
While print() is fine for simple debugging, logging is essential in production to ensure performance, reliability, observability, and security.
- Severity levels: Logging allows filtering important events, like errors, without cluttering logs with debug info.
- Flexible destinations: You can write logs to files, remote servers, or monitoring systems.
- Structured & searchable logs: Logs can include metadata, timestamps, and context for tracing issues.
- Alerting & observability: Logs can trigger alerts automatically, correlate with metrics, and integrate with tracing.
- Performance & scalability: Logging can be asynchronous and non-blocking, unlike print, which can slow down production systems.
Conclusion
Python’s logging module gives you structured, configurable control over how your application records events. Used correctly, it supports debugging, alerting, auditing, and production monitoring.
Start with module-level named loggers and consistent levels. Configure handlers centrally, enable rotation, and avoid logging sensitive data. As your system grows, move toward structured logs and centralized aggregation.
Treat logging as infrastructure, not an afterthought. Good logs make production systems easier to operate and safer to scale.
-
Use DEBUG for detailed internal information that helps diagnose problems during development or troubleshooting. For example, logging variable values or execution flow. These messages are usually too verbose for production.
Use INFO for high-level operational messages that confirm the system is working as expected, such as “User login successful” or “Background job completed.” INFO messages are suitable for production monitoring. -
During tests, logging can clutter output. You can temporarily disable it using:
import logging
logging.disable(logging.CRITICAL) # Disables all logs at CRITICAL and below
This ensures no logs appear while tests run. You can re-enable logging with logging.disable(logging.NOTSET) if needed. -
When catching exceptions, use logger.exception() inside an except block to automatically include the stack trace:
try:
risky_operation()
except Exception:
logger.exception(“An error occurred during risky_operation”)
This logs the message along with full traceback information. Avoid logging exceptions multiple times to prevent duplicate log entries. -
You can include extra context using the extra parameter. This is useful for adding request IDs, user IDs, or other metadata:
logger.info(
“Processing user request”,
extra={“user_id”: 123, “request_id”: “req-001”}
)
Make sure your formatter can handle extra fields, especially if you’re doing structured or JSON logging. -
Yes, Python’s built-in logging module is thread-safe. Multiple threads can safely log messages to the same logger without causing corruption. Handlers like StreamHandler and FileHandler use internal locks to prevent race conditions. However, asynchronous logging or heavy multi-threaded applications may benefit from queue-based logging for better performance.