TL;DR (QUICK ANSWER)
Pingdom is a solid monitoring tool, but it’s not always the best fit as needs change.
Datadog, New Relic, Dynatrace: best for full observability and complex systems
UptimeRobot and Hyperping: best for simple, affordable uptime monitoring
Uptime.com: better for SLA tracking and transaction monitoring
Cronitor: best for cron jobs and background tasks
Uptime Kuma: best self-hosted option
Pingdom is one of the most well-known tools for uptime and performance monitoring. It’s often the starting point for teams that want to track website availability, page speed, and user experience.
However, it’s not always the right long-term fit.
Some teams outgrow it as their monitoring needs become more complex. Others find that pricing scales faster than expected, especially as they add more checks or need advanced features. And in some cases, Pingdom simply offers more (or less) than what’s actually needed.
In this guide, we’ll compare the most practical Pingdom alternatives across different use cases, so you can find a tool that fits your workflow without overcomplicating things.

Key takeaways
- UptimeRobot is the easiest Pingdom alternative for most teams that want simple, reliable uptime monitoring
- Hyperping works well for startups and smaller teams that want fast setup and clean workflows
- Uptime.com is a better fit if you need transaction monitoring, SLA tracking, and more advanced uptime checks
- Cronitor is the best option for monitoring cron jobs and background tasks
- Uptime Kuma is a strong choice if you want a self-hosted, open-source solution
- Datadog, New Relic, and Dynatrace are better suited for large teams that need full observability across systems
Why look for a Pingdom alternative?
Pingdom works well for basic uptime monitoring, but it starts to fall short as your needs grow.
Here are the most common reasons teams look for alternatives:
Pricing becomes harder to scale
Pingdom’s pricing increases quickly as you add more monitors or users. If you’re managing multiple websites, APIs, or environments, costs can rise fast without a clear link to actual usage.
Many alternatives offer more flexible pricing, including generous free plans or pay-as-you-grow models.
Limited flexibility for modern workflows
Pingdom focuses on uptime and page speed, but many teams need more than that.
It does not cover areas like:
- API monitoring with custom requests
- Cron job or background task monitoring
- Advanced alert routing or escalation
This often forces teams to rely on multiple tools to cover gaps.
Missing features like RUM and advanced alerting
Pingdom doesn’t include built-in real user monitoring, and some features like public status pages or advanced alerting are limited to higher-tier plans.
For SaaS teams, this makes it harder to:
- Track real user performance
- Communicate incidents clearly
- Manage alerts across teams
When Pingdom is still a good fit & when it’s not
Pingdom is still a solid choice if:
- You only need basic uptime and performance checks
- Your monitoring setup is simple
- You don’t need deep integrations or advanced workflows
You will likely need an alternative if:
- You’re scaling across multiple services or environments
- You need API, cron, or infrastructure-level monitoring
- Your team relies on tools like Slack, PagerDuty, or custom workflows
- You want built-in status pages or real user monitoring
Here’s a quick overview of Pingdom’s strengths and limitations:
| Area | Pingdom strengths | Pingdom limitations |
| Uptime monitoring | Reliable uptime checks and alerts | Limited monitoring types beyond basic checks |
| Ease of use | Simple setup and user-friendly interface | Less flexible for complex workflows |
| Performance monitoring | Includes page speed monitoring | No built-in real user monitoring (RUM) |
| Alerting | Basic email and SMS alerts | Limited alert routing and escalation options |
| Status pages | Available on higher-tier plans | Not included in all plans |
| Integrations | Supports some integrations | Fewer integrations compared to modern tools |
| Pricing | Well-known and established product | Costs increase quickly as monitors and users scale |
For simple monitoring needs, Pingdom still works well. As requirements grow, these limitations become more noticeable.
How to choose the right Pingdom alternative
The right tool should match your infrastructure, alerting needs, and team workflow.
Match monitoring types to your infrastructure
Start by mapping your infrastructure to the monitoring types you need. Pingdom focuses heavily on uptime and basic performance checks, but many alternatives offer broader coverage:
- Website and HTTP(s) monitoring: Essential for public-facing services. Make sure the tool supports custom headers, authentication, and redirects if your endpoints require them.
- API and endpoint monitoring: If your product relies on APIs, you’ll want to simulate real requests with custom payloads and headers. UptimeRobot, for example, lets you monitor API health with keyword checks in the response body.
- Port and ping monitoring: Useful for internal services, VPNs, or custom apps. Not all tools offer this, so check support for TCP, UDP, or ICMP protocols.
- Cron job and scheduled task monitoring: If background jobs are part of your stack, look for tools that can alert you when a scheduled task doesn’t run. This is something Pingdom doesn’t support, but UptimeRobot and Cronitor do.
The more complex your stack, the more flexible your monitoring tool needs to be.
Evaluate alerting and notification flexibility
Pingdom supports email and SMS, but alternatives often go further:
- Multi-channel notifications: Look for tools that support Slack, Microsoft Teams, Discord, or mobile push notifications. UptimeRobot supports 20+ integrations, including PagerDuty and Telegram.
- Alert routing and escalation: If your team has on-call rotations or different owners for different services, choose a tool with alert routing logic. Better Stack and Splunk On-Call offer advanced alert workflows.
- Quiet hours and alert suppression: Useful for avoiding alert fatigue during maintenance windows or known downtimes.
Test how granular the alert settings are. Can you set thresholds, delays, or retries? If not, you’ll likely end up with noise.
Consider dashboard usability and status page needs
Monitoring tools vary widely in how they present data. Some focus on raw logs or graphs, others on clean summaries:
- Dashboard clarity: Can you see all monitors at a glance? Are incidents easy to triage? UptimeRobot’s dashboard is simple and fast to navigate, even with dozens of monitors.
- Public status pages: If you need to communicate outages to customers, check if the tool includes customizable status pages. UptimeRobot includes this even on free plans, while Pingdom charges extra.
Also consider whether you can embed status widgets or share private dashboards internally.
Compare pricing based on monitor count and check frequency
Pingdom’s pricing scales quickly with monitor count and check intervals. When comparing alternatives, look at:
- Included monitors per plan: UptimeRobot’s Free plan includes 50 monitors with 5-minute checks. Pingdom’s free tier is far more limited.
- Check frequency: Some tools offer 1-minute checks only on higher tiers. If you need faster detection, make sure that’s not locked behind enterprise pricing.
- Add-on costs: SMS alerts, extra users, or public status pages can inflate costs. Review what’s included vs. what’s billed separately.
Don’t just compare monthly prices. Calculate based on your actual usage.
Check integration support for your stack
If your team already uses tools like Zapier, Datadog, or Webhooks, make sure the monitoring platform can plug in easily. For example:
- UptimeRobot integrates with Slack, Discord, Microsoft Teams, and more.
- Better Stack offers GitHub integration for incident tracking.
- Cronitor supports custom webhooks and Prometheus exporters.
The fewer workarounds you need, the faster your team can respond to issues.
The right Pingdom alternative depends on your monitoring scope, alerting needs, and team workflow. Once those are clear, it becomes much easier to narrow down your options, which we’ll do next by breaking them down by use case.
Best Pingdom alternatives by use case
Not every team needs the same type of monitoring. It’s easier to narrow things down based on how you actually work.
Best overall alternative for most teams
If you want something close to Pingdom without the same pricing pressure or limitations, these are the most practical options.
UptimeRobot is the easiest switch for most teams. It covers core uptime monitoring, alerts, and status pages without adding complexity. Setup is quick, and pricing is predictable as you scale.
Other strong options in this category:
- Hyperping: Clean interface, fast alerts, and built-in status pages
- Uptime.com: More advanced uptime and transaction monitoring with reporting features
Starting price: Free plans available across most tools
Best for startups and simple uptime monitoring
If you don’t need a full monitoring stack, keep it simple. Fast setup, clear alerts, and minimal maintenance matter more here than deep features.
Hyperping works well for smaller teams that want something modern and easy to manage without spending time on configuration.
You can also consider:
- UptimeRobot: Generous free plan and straightforward setup
Starting price: Free plans available, with paid plans starting around $20/month
Best for cron and job monitoring
Some teams need more than uptime checks. If you rely on scheduled jobs, background tasks, or scripts, missed runs can be just as critical as downtime.
Cronitor focuses specifically on this. It tracks cron jobs, background processes, and scheduled tasks, and alerts you when something doesn’t run as expected.
Starting price: Free tier available, paid plans scale with usage
Best open-source or self-hosted alternatives
If you want full control over your monitoring setup, self-hosted tools are worth considering. They take more effort to maintain but remove licensing costs and give you flexibility.
Uptime Kuma is one of the most popular options for lightweight uptime monitoring. It’s easy to run, has a clean interface, and covers most core needs.
You can also look at:
- Prometheus: More advanced and better suited for infrastructure and metrics
Starting price: Free (self-hosted)
Best enterprise and observability platforms
If uptime checks alone aren’t enough, you’ll need something that goes deeper. These tools cover logs, metrics, tracing, and system performance across complex environments.
Datadog is one of the most widely used options for full observability. It’s built for teams that need visibility across infrastructure, applications, and services.
Other strong options include:
- New Relic: Strong APM and telemetry analysis
- Dynatrace: Advanced automation and AI-driven monitoring
Starting price: Usage-based, typically starting around $15 per host or scaling with data volume
Best for advanced uptime and transaction monitoring
If you still want something closer to Pingdom but with more flexibility around checks, reporting, and SLAs, this category fits best.
Uptime.com offers advanced uptime monitoring, synthetic transactions, and detailed reporting. It’s a good fit for teams that need more control without moving into full observability tools.
Starting price: From around $7/month, depending on features and usage
Best Pingdom alternatives in-depth
The tools above cover different use cases, but the differences become clearer when you look at how each one is set up and what it actually offers day to day.
Here’s a closer look at the main Pingdom alternatives and how they compare in practice.
UptimeRobot
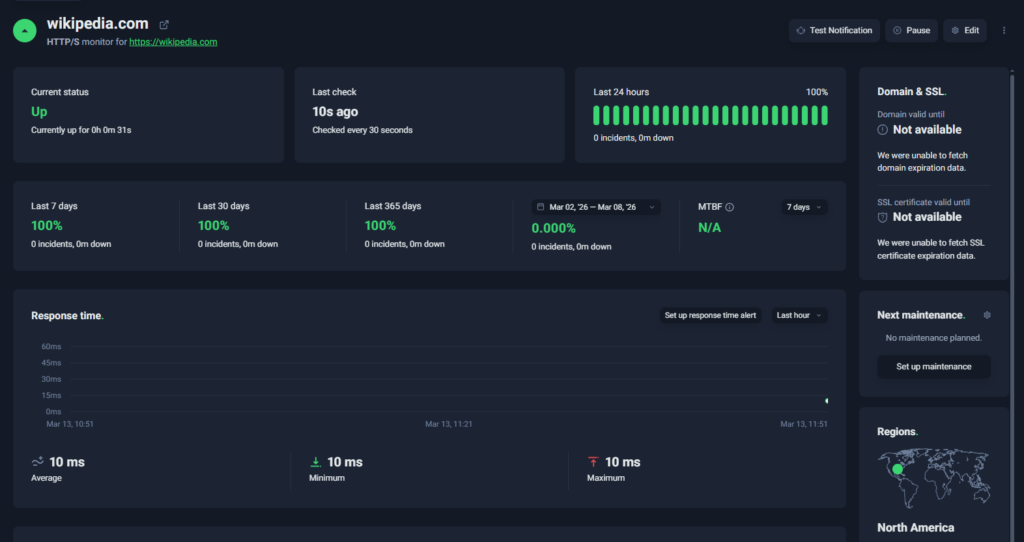
UptimeRobot dashboard
UptimeRobot is built around one thing: tracking uptime and alerting you when something goes down.
While Pingdom leans more into performance monitoring and user experience data, UptimeRobot sticks to availability checks and notifications. Having a narrower scope makes it easier to run and quicker to set up, especially if you don’t need detailed performance insights.
It’s a good fit for teams that want straightforward monitoring without dealing with extra layers or rising costs tied to features they won’t use.
Key features:
- Monitoring for HTTP(s), ping, port, keyword, and cron jobs
- SSL certificate and domain expiry tracking
- Response time and DNS monitoring
- Public status pages with custom domains
- Alerts via email, SMS, voice calls, push notifications, and integrations
- Integrations with Slack, Discord, Telegram, webhooks, and more
- Simple dashboard for managing monitors and incidents
UptimeRobot has a large free tier, which makes it accessible even for smaller projects.
- Free plan: 50 monitors with 5-minute intervals
- Solo plan: starts at around $7/month
- Team plan: starts at around $29/month with additional users and monitors
Pricing is mainly tied to how many monitors you run and how frequently they check, so it’s easy to estimate as you scale.
Free tools and resources:
Alongside monitoring, UptimeRobot includes a few standalone tools:
- Subnet calculator
- Website change detection
- MX lookup
- Crontab generator
- Uptime calculator
There’s also a knowledge hub with tutorials, plus a Discord community for support and discussions.
Best fit for:
- Teams that need uptime alerts without extra complexity
- Startups looking for a free or low-cost monitoring option
- Developers who want something quick to deploy and maintain
- SaaS teams tracking APIs or websites
If your main priority is knowing when something goes down and acting on it quickly, UptimeRobot keeps things simple and focused.
| Pros | Cons |
| Quick to set up and easy to manage | No built-in log or metrics tracking |
| Large free plan with generous limits | Not suited for deep observability |
| Clear dashboard with minimal overhead | Fewer advanced incident management features |
| Multiple alerting options and integrations |
Hyperping
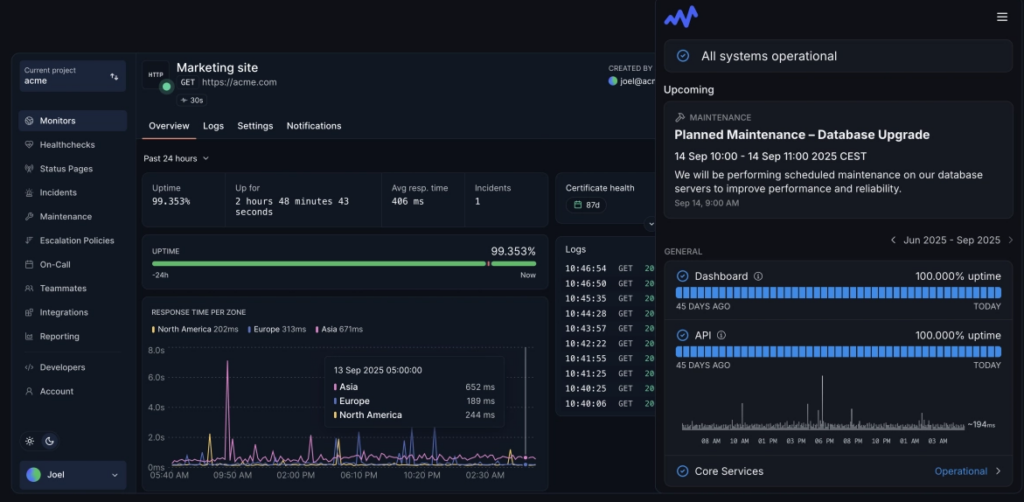
Source: Hyperping dashboard example
Hyperping is an uptime monitoring tool built around fast alerts, simple setup, and clear incident visibility.
With this tool, you’ll find a more focused approach than Pingdom. Instead of mixing uptime monitoring with performance data, Hyperping centres on availability, alerting, and status pages. That makes it easier to manage incidents without adding extra layers or tools.
It’s a good option for teams that want something modern and lightweight, especially if they don’t need deeper performance or observability features.
Key features:
- HTTP(s), ping, and keyword monitoring
- Global check locations
- Public and private status pages
- Alerts via email, Slack, PagerDuty, and webhooks
- Integrations with common developer tools
- Clean dashboard for tracking uptime and incidents
Hyperping includes a free plan, with paid tiers that expand based on usage and features.
- Free plan with limited monitors
- Paid plans start at around $24/month
Pricing scales with monitor count and alerting options, so costs increase as your setup grows.
Best fit for:
- Startups that want fast, simple uptime monitoring
- SaaS teams tracking APIs or services
- Developers who prefer a clean, minimal setup
- Teams that want built-in status pages without extra tools
If you’re looking for a straightforward alternative to Pingdom with a more modern interface and faster alerting, Hyperping is an easy option to adopt.
| Pros | Cons |
| Clean interface with quick setup | Smaller feature set than full observability tools |
| Built-in status pages | Limited free plan |
| Strong alerting and integrations | Pricing increases with monitor count |
| Global monitoring locations | Fewer monitoring types than some competitors |
Uptime.com
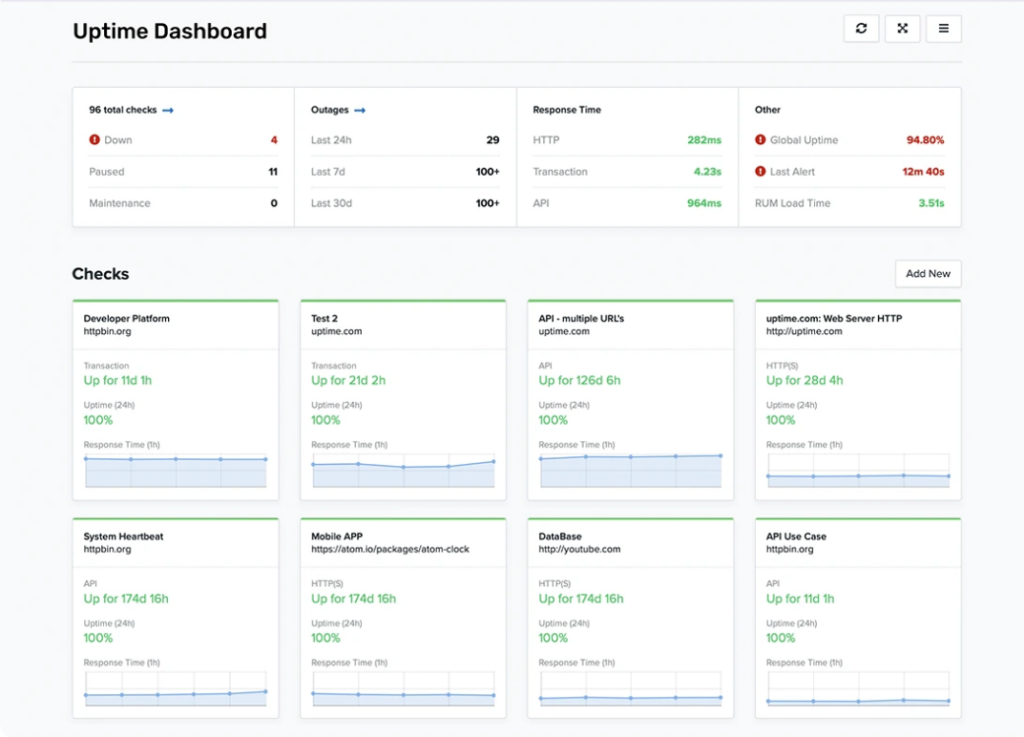
Source: Uptime.com dashboard example
Uptime.com focuses on uptime monitoring, transaction checks, and reliability tracking across websites and services.
Compared to Pingdom, it puts more emphasis on synthetic monitoring and SLA reporting. You can track not just whether a service is up, but whether key user flows and transactions are working as expected.
That makes it a stronger option for teams that need more visibility into reliability and performance from a user journey perspective, without moving into full observability tools.
Key features:
- Uptime monitoring for websites and services
- Transaction monitoring and synthetic testing
- API checks for backend services
- Alerting with escalation workflows
- Public status pages
- Reporting and SLA tracking
Uptime.com uses flexible pricing based on how you monitor and what features you include.
- Plans start at around $7/month for basic monitoring
- Costs increase with transaction checks, monitoring volume, and add-ons
Pricing scales with usage, so it can grow quickly depending on how many checks and features you need.
Best fit for:
- Teams that need transaction and workflow monitoring
- Businesses tracking SLAs and uptime commitments
- Organizations that want more depth than basic uptime tools
- Product teams focused on reliability from a user perspective
If uptime alone isn’t enough and you need to track how services actually behave in real scenarios, Uptime.com offers more control than simpler tools.
| Pros | Cons |
| Strong uptime and transaction monitoring | More expensive than basic uptime tools |
| Detailed reporting and SLA tracking | Limited observability features |
| Reliable alerting and escalation workflows | Interface can feel complex |
| Flexible monitoring options | Can be overkill for simple setups |
Cronitor
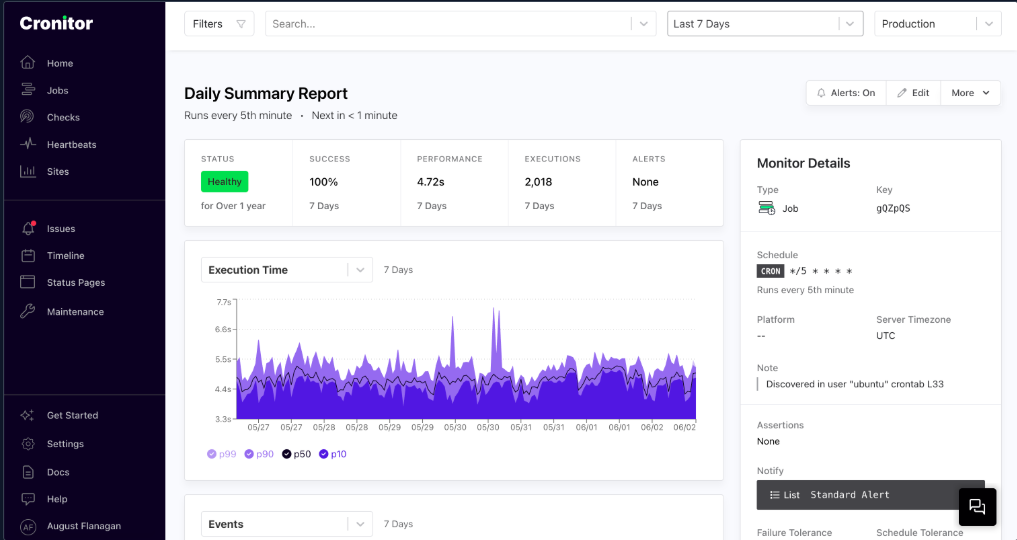
Source: Cronitor dashboard example
Cronitor is built for monitoring scheduled jobs, background workers, and recurring processes.
While Pingdom focuses on uptime and user-facing performance, Cronitor targets the behind-the-scenes tasks that keep systems running. It tracks whether jobs run on time, fail silently, or take longer than expected.
That makes it useful for teams where missed cron jobs can cause real issues, like failed billing runs, broken data pipelines, or incomplete backups.
Key features:
- Cron and heartbeat monitoring for scheduled jobs and background tasks
- Alerts for missed, delayed, or long-running jobs
- Uptime monitoring for websites and APIs
- Status pages with basic customization
- Lightweight setup using ping URLs (no agents required)
- Import support for existing crontabs
Cronitor includes a free tier, with paid plans that scale based on monitor count and features.
- Free plan: limited monitors and 5-minute checks
- Paid plans: start at around $2/month, with per-monitor/user pricing
- Enterprise plans available with advanced features and support
Pricing is tied to the number of monitors, which works well for smaller setups but can add up at scale.
Best fit for:
- Teams relying on cron jobs, background workers, or scheduled tasks
- SaaS companies running billing, ETL, or reporting processes
- Engineering teams that need visibility into silent failures
- Smaller teams without dedicated DevOps resources
If your biggest risk isn’t downtime but jobs failing quietly in the background, Cronitor fills a gap that tools like Pingdom don’t cover.
| Pros | Cons |
| Strong focus on cron and job monitoring | Costs increase with monitor count |
| Catches silent failures and missed jobs | No built-in on-call scheduling |
| Simple setup with no agents required | No voice call alerting |
| Combines cron monitoring with uptime checks | Limited flexibility for complex schedules |
Uptime Kuma
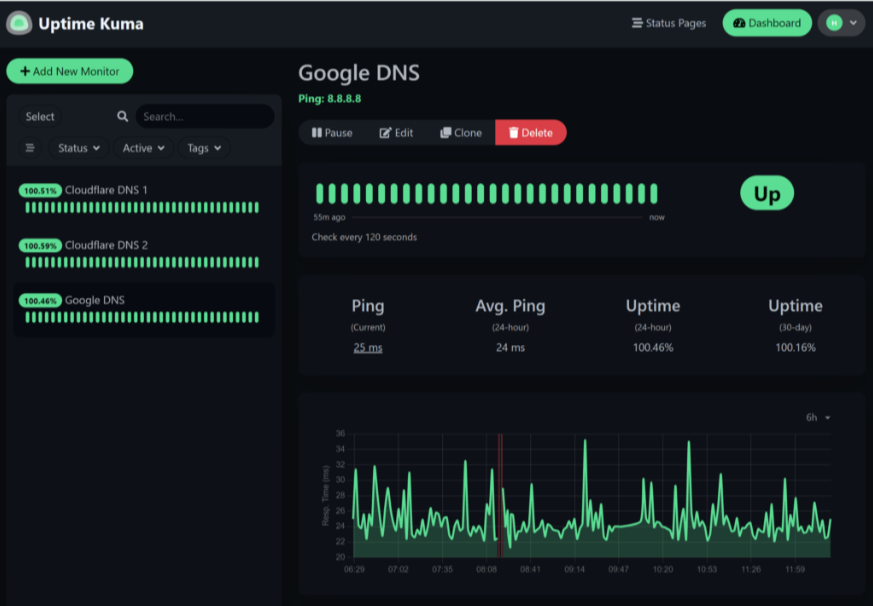
Source: Uptime Kuma dashboard example
Uptime Kuma is a self-hosted uptime monitoring tool that gives you full control over how and where your monitoring runs.
Unlike Pingdom, which is fully managed, Uptime Kuma requires you to run your own monitoring instance. That tradeoff gives you flexibility and zero licensing costs, but also means you’re responsible for setup, uptime, and maintenance.
It’s one of the more approachable open-source options, with a clean interface and support for multiple check types, so you don’t need to build everything from scratch.
Key features:
- Monitoring for HTTP(s), ping, TCP, DNS, and keywords
- Built-in status pages
- Notifications via email, Slack, Discord, and webhooks
- Docker-based deployment for easier setup
- Full control over monitoring data and infrastructure
Uptime Kuma is free to use, with no licensing costs.
- Free and open-source
- Costs depend on the infrastructure you use to host it
Running it yourself means there’s no built-in redundancy. If your monitoring instance goes down, you lose visibility until it’s back online. There’s also no global probe network to confirm outages from different regions.
Best fit for:
- Developers who prefer self-hosted tools
- Teams that want full control over monitoring data
- Projects avoiding SaaS tools for cost or privacy reasons
- Smaller setups where basic uptime checks are enough
If you’re comfortable managing your own infrastructure, Uptime Kuma gives you a flexible and cost-effective alternative to Pingdom.
| Pros | Cons |
| Free and open-source | Requires self-hosted infrastructure |
| Clean interface and easy setup for an open-source tool | No managed hosting or support |
| Flexible monitoring options | No global monitoring network |
| Built-in status pages | You’re responsible for uptime and maintenance |
Better Stack
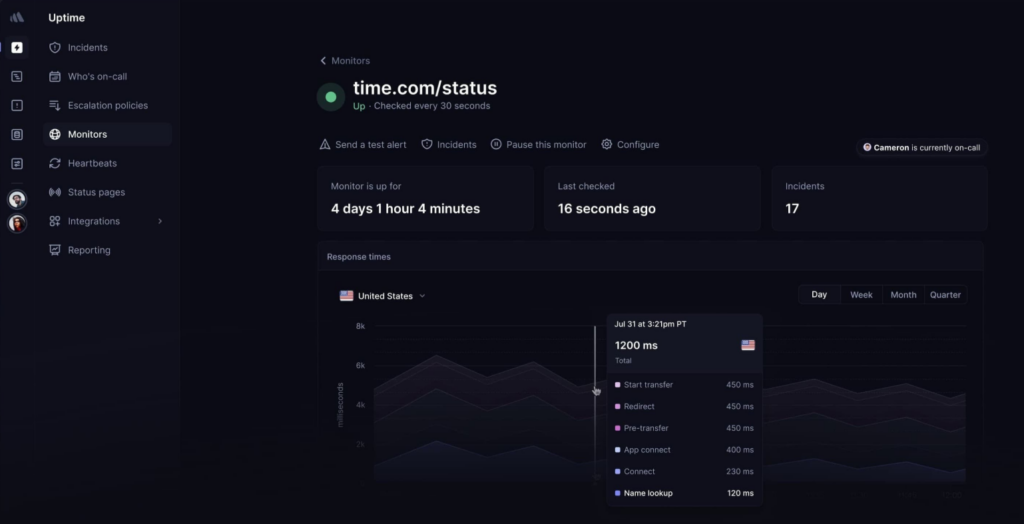
Source: Better Stack dashboard example
Better Stack combines uptime monitoring with incident management and log analysis in a single platform.
Compared to Pingdom, Better Stack goes further into operational workflows. It connects alerts, on-call routing, and logs so teams can move from detection to investigation without switching tools.
A broader scope makes it a better fit for teams that want more context around incidents, not just notifications when something breaks.
Key features:
- Uptime monitoring with fast check intervals (as low as ~30 seconds)
- Built-in incident management and on-call scheduling
- Log aggregation with search and querying
- Status pages with customization options
- Integrations with common DevOps and alerting tools
Better Stack offers a free plan, with paid tiers that expand based on usage and features.
- Free plan available
- Paid plans start at around $24/month
Pricing depends on the combination of monitoring, logs, and incident features you use, so costs can increase as your setup grows.
Best fit for:
- Teams that want monitoring, logs, and incident workflows in one place
- Engineering teams handling production systems
- DevOps teams that need faster debugging and response
- Companies moving beyond basic uptime monitoring
If you want to connect monitoring with incident response and troubleshooting, Better Stack gives you more depth than Pingdom.
| Pros | Cons |
| Combines monitoring, logs, and incident workflows | More complex than uptime-only tools |
| Fast detection intervals | Pricing scales with usage |
| Strong alerting and integrations | Can be more than smaller teams need |
| Built-in incident management features |
Datadog
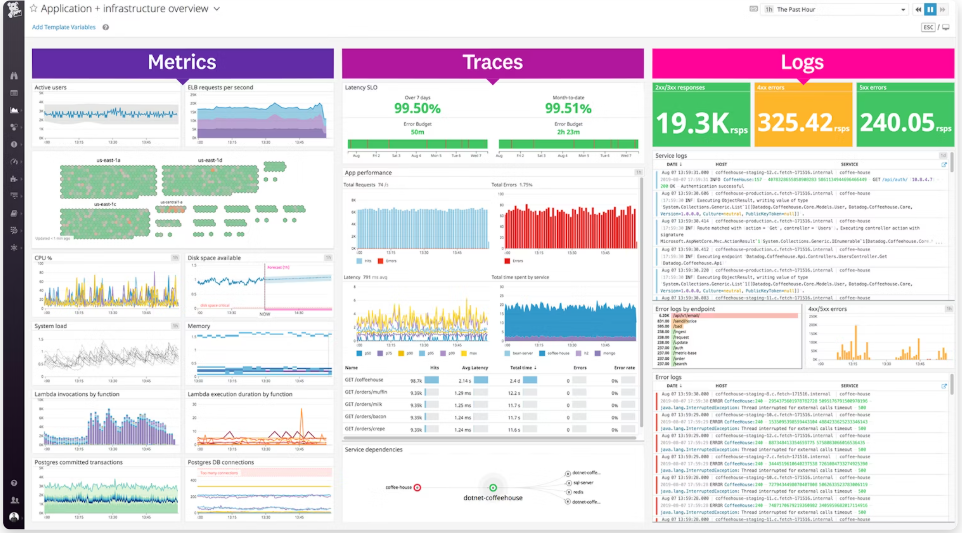
Source: Datadog dashboard example
Datadog is a full cloud observability platform built to monitor infrastructure, applications, logs, and metrics in one place.
Compared to Pingdom, it operates at a completely different level. Instead of focusing on uptime and performance checks, Datadog gives you visibility across entire systems, including services, containers, and cloud environments.
That makes it a better match for teams running complex setups where understanding why something broke matters just as much as knowing that it did.
Key features:
- Infrastructure and application performance monitoring
- Log management and distributed tracing
- Real-time dashboards and analytics
- Advanced alerting and anomaly detection
- Integrations with cloud providers and DevOps tools
Datadog uses usage-based pricing, which scales with infrastructure size and data volume.
- Free plan available for up to 5 hosts
- Infrastructure monitoring starts at around $15 per host/month
- Additional costs for logs, traces, and other services
Costs can grow quickly depending on how much data you collect and how many services you monitor.
Best fit for:
- Engineering teams managing complex systems
- DevOps and SRE teams
- Companies running microservices or cloud infrastructure
- Organizations that need deep visibility across services
If uptime checks alone aren’t enough and you need to troubleshoot issues across multiple systems, Datadog provides a much deeper level of insight than Pingdom.
| Pros | Cons |
| Full observability across logs, metrics, and traces | Can become expensive at scale |
| Large ecosystem of integrations | Steeper learning curve |
| Powerful dashboards and analytics | Complex pricing structure |
| Scales well with growing infrastructure | Requires more setup and configuration |
New Relic
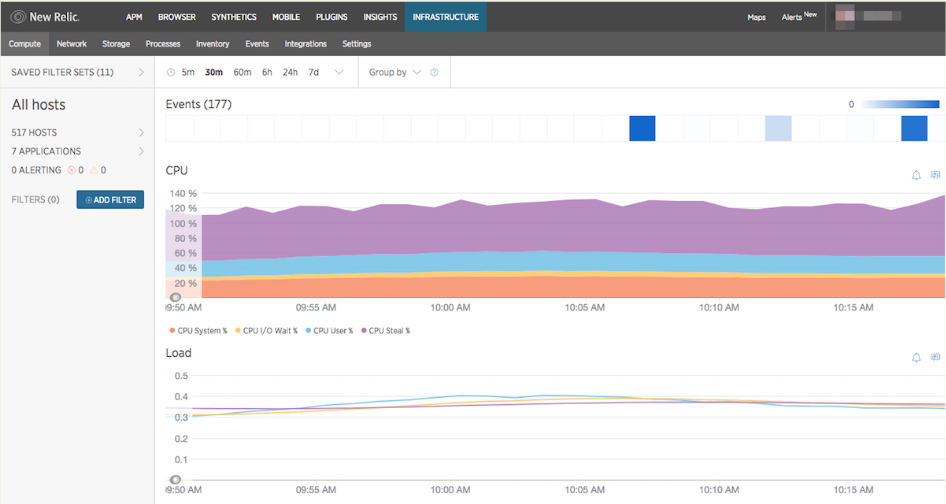
Source: New Relic dashboard example
When uptime checks aren’t enough and you need to understand how your application behaves across services, New Relic becomes a more relevant option.
It focuses heavily on application performance, helping teams trace requests, analyse system behaviour, and spot issues across distributed environments. Instead of just telling you something is down, it helps you figure out where things are slowing down or breaking.
That makes it a better fit for teams working with microservices or complex application stacks where performance and dependencies matter.
Key features:
- Application performance monitoring (APM)
- Infrastructure monitoring and distributed tracing
- Log management and analytics
- Real-time dashboards and custom queries
- Synthetic monitoring and real user monitoring (RUM)
- Alerting, anomaly detection, and incident tracking
New Relic uses a usage-based pricing model based on data ingestion and platform usage.
- Free tier available with limited data usage
- Paid plans scale based on telemetry data and user seats
Costs depend on how much data you collect and how extensively you use the platform.
Best fit for:
- DevOps teams working with distributed systems
- Engineering teams running microservices architectures
- Companies that need detailed application performance insights
- Organizations focused on debugging and performance optimization
If your priority is diagnosing performance issues across multiple services rather than just tracking uptime, New Relic offers a much deeper level of visibility than Pingdom.
| Pros | Cons |
| Strong application performance monitoring | Can become expensive at scale |
| Advanced analytics and custom dashboards | Requires setup and configuration |
| Deep visibility into distributed systems | Steeper learning curve |
| Wide integration ecosystem | Overkill for simple uptime monitoring |
Dynatrace
Source: Dynatrace dashboard example
For teams managing large, distributed systems, Dynatrace is built to handle the complexity that comes with it.
It brings together infrastructure monitoring, application performance, logs, and real user data in one place, with a strong focus on automation. Instead of relying on manual investigation, it uses AI to surface issues, map dependencies, and highlight root causes.
Compared to Pingdom, Dynatrace is designed for environments where problems aren’t always obvious and systems span multiple services, regions, and layers.
Key features:
- Full-stack monitoring across infrastructure, applications, and services
- Real user monitoring (RUM) and synthetic testing
- Distributed tracing and service dependency mapping
- AI-driven anomaly detection and root cause analysis
- Real-time dashboards and performance analytics
- Integrations with cloud platforms and DevOps tools
Dynatrace has pricing based on usage and environment size, with many different plans to choose from.
- No free plan
- Custom pricing based on infrastructure, data volume, and features
Costs tend to be higher than simpler tools, especially at scale.
Best fit for:
- Large engineering teams managing complex systems
- Organizations running microservices or multi-cloud environments
- Companies that need automated insights and root cause analysis
- Teams prioritizing performance, reliability, and system visibility
If you’re dealing with large-scale systems where issues aren’t easy to trace, Dynatrace provides a level of automation and visibility that simpler tools like Pingdom don’t offer.
| Pros | Cons |
| Full observability across infrastructure and applications | Expensive compared to simpler tools |
| AI-driven insights and automated analysis | Complex setup and onboarding |
| Strong dependency mapping and performance tracking | Overkill for small teams |
| Scales well for large environments |
Honorable mention
Some monitoring tools take a different approach or are better suited to specific environments, which makes them worth mentioning even if they’re not direct replacements.
Prometheus
Prometheus is an open-source monitoring system focused on metrics collection and time-series data.
It’s widely used in Kubernetes and cloud-native environments, where teams need detailed visibility into system performance.
Unlike Pingdom, it doesn’t focus on uptime checks or user-facing monitoring. Instead, it collects and stores metrics that can be queried and visualised using tools like Grafana.
It’s powerful, but it requires setup, configuration, and ongoing maintenance, so it’s better suited to engineering teams that are already working with infrastructure monitoring.
Pingdom alternatives comparison table
The main differences between Pingdom alternatives come down to monitoring depth, alerting, and pricing. The table below shows how the top tools compare at a glance.
and pricing. The table below shows how the top tools compare at a glance.
| Tool | Monitoring types | RUM | Synthetic monitoring | Status pages | Alerts | Starting price | Best for |
| UptimeRobot | HTTP(s), ping, port, keyword, cron | ❌ | ⚠️ | ✅ | Email, SMS, voice, integrations | Free | Simple uptime monitoring |
| Better Stack | HTTP(s), API, uptime + logs | ❌ | ⚠️ | ✅ | Advanced alerting, on-call routing | ~$24/month | Monitoring + incident workflows |
| Hyperping | HTTP(s), ping, keyword | ❌ | ❌ | ✅ | Email, Slack, PagerDuty | ~$24/month | Startups and simple monitoring |
| Uptime.com | Uptime, API, transaction | ❌ | ✅ | ✅ | Alerts + escalation workflows | ~$7/month | SLA and transaction monitoring |
| Cronitor | Cron, uptime, API | ❌ | ❌ | ✅ | Email, Slack, webhooks | ~$7/month | Scheduled jobs and background tasks |
| Uptime Kuma | HTTP(s), TCP, DNS, ping | ❌ | ❌ | ✅ | Email, Slack, webhooks | Free | Self-hosted monitoring |
| Datadog | Infra, APM, logs, metrics | ✅ | ✅ | ⚠️ | Advanced alerting + automation | ~$15/host/month | Full observability |
| New Relic | APM, infra, logs, tracing | ✅ | ✅ | ❌ | Advanced alerting | Free + usage-based | Application performance monitoring |
| Dynatrace | Full-stack observability | ✅ | ✅ | ⚠️ | AI-driven alerts | Custom pricing | Enterprise observability |
| Prometheus | Metrics, time-series data | ❌ | ❌ | ❌ | Integrations only | Free | Metrics and infrastructure monitoring |
How monitoring tools impact SEO and user experience
Website monitoring is not just a technical concern. It directly affects how users experience your site and how search engines rank it.
Downtime and crawlability
If your site is unavailable when search engines try to crawl it, pages may not be indexed properly. Repeated downtime can reduce crawl frequency and hurt visibility in search results.
Even short outages can cause issues if they happen during peak crawl times.
Performance and Core Web Vitals
Monitoring tools help you catch slow response times and performance drops early. This matters because metrics like load time and stability are part of Google’s Core Web Vitals.
If performance degrades after a deployment or traffic spike, monitoring gives you the data to identify and fix it quickly.
User trust and bounce rates
Users expect websites to load fast and stay available. If they run into errors or delays, they’re likely to leave immediately.
Monitoring helps reduce this risk by alerting you to issues before they affect a large number of users. Faster response times mean fewer abandoned sessions and better overall engagement.
Why monitoring matters beyond DevOps
Monitoring is not just for engineers. It impacts marketing, SEO, and revenue.
A reliable site:
- Ranks better in search
- Converts more visitors
- Builds long-term trust with users
Without monitoring, issues often go unnoticed until they start affecting traffic or sales.
Final recommendations
The right Pingdom alternative depends on what you actually need to monitor.
If your priority is simple uptime checks and fast alerts, UptimeRobot is the most straightforward option. It’s easy to set up, covers the essentials, and works well for most teams.
For a more modern, lightweight alternative, Hyperping is a good fit, especially for startups or smaller products that want something clean and easy to manage.
If you need more control over reliability, transactions, and SLA tracking, Uptime.com gives you more depth without moving into full observability tools.
If your biggest risk comes from scheduled jobs or background processes, Cronitor solves a different problem that Pingdom doesn’t cover.
For teams that want a self-hosted option, Uptime Kuma gives you full control, but requires more setup and maintenance.
If you’re working with complex systems and need visibility across applications and infrastructure, Datadog and New Relic are better suited. These platforms go beyond uptime checks and help with debugging, performance tracking, and system-wide monitoring.
For large-scale environments where automation and root cause analysis matter, Dynatrace is worth considering, although it comes with more complexity and higher cost.
Start with your use case and keep things as simple as possible. The more complex your system becomes, the more it makes sense to move toward deeper monitoring tools.
-
Pingdom is still a solid option for basic uptime and performance monitoring. It works well for smaller setups or teams that only need simple checks.
However, many teams outgrow it due to pricing and limited flexibility. If you need API monitoring, advanced alerting, or deeper insights, alternatives often provide better value. -
UptimeRobot is the strongest free alternative for most users. It includes 50 monitors with 5-minute checks and supports multiple monitoring types.
Other options like Uptime Kuma or StatusCake can work depending on your setup, but they come with trade-offs such as self-hosting or fewer features. -
It depends on what you care about.
Uptime monitoring tells you if your site is reachable
Real user monitoring shows how your site actually performs for visitors
If performance, SEO, or conversions matter, uptime alone is not enough. Slow pages can still hurt rankings and user experience even if the site is technically “up” -
For most sites, checks every 1 to 5 minutes are enough.
Shorter intervals help you detect issues faster, especially if uptime is tied to revenue or SLAs. Most tools offer 5-minute checks on free plans and faster intervals on paid tiers. -
No, monitoring tools don’t prevent downtime.
What they do is detect issues quickly so you can fix them before they cause serious damage. Faster detection reduces downtime duration, which helps protect traffic, rankings, and user trust.