TL;DR
The internet doesn’t take weekends off, but status pages seem to. Machine-detected failures (failures identified automatically by monitoring) dropped just 7.1% on weekends in the first half of 2026. Provider published incidents dropped 62.4% on weekends. Our first analysis combining UptimeRobot and IsDown data shows just how different the internet can look depending on who is measuring it.
A status page can tell you when a provider says something went wrong. It can’t tell you how much went wrong without an update.
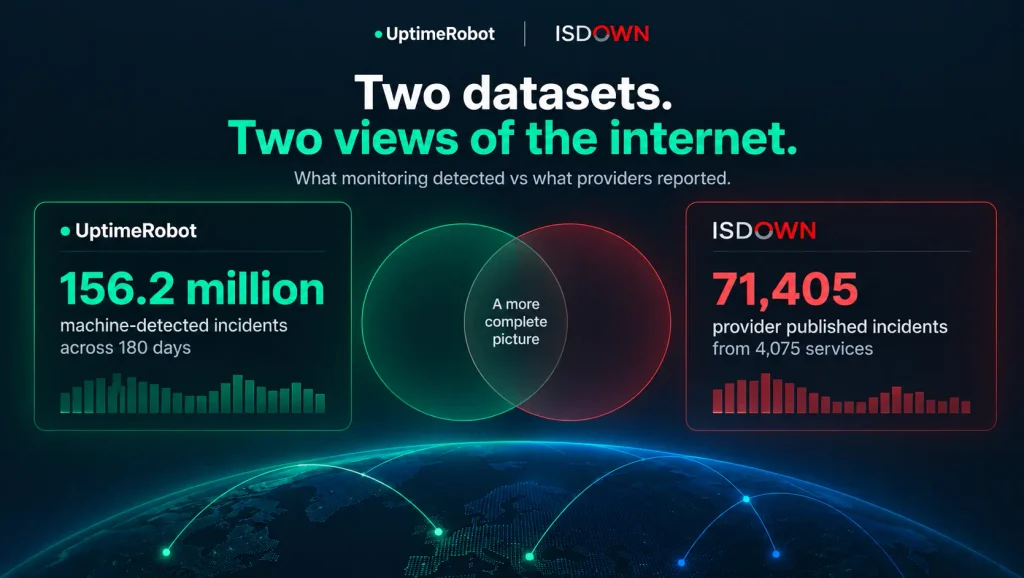
For the first half of 2026, we analyzed two different views of internet incidents using UptimeRobot’s independent monitoring data and incident data from IsDown, recently acquired by UptimeRobot.
That let us see where independent monitoring and public reporting told different stories.
The differences were hard to miss. Provider reporting changed dramatically depending on the day of the week. Major infrastructure failures appeared across dozens of services, sometimes before the provider published its own incident.
And in many cases, the first public signal came from users reporting a problem themselves.
Here’s what we found.
The internet doesn’t take weekends off
If internet infrastructure behaved very differently on weekends, we’d expect monitoring data to show it. It doesn’t.
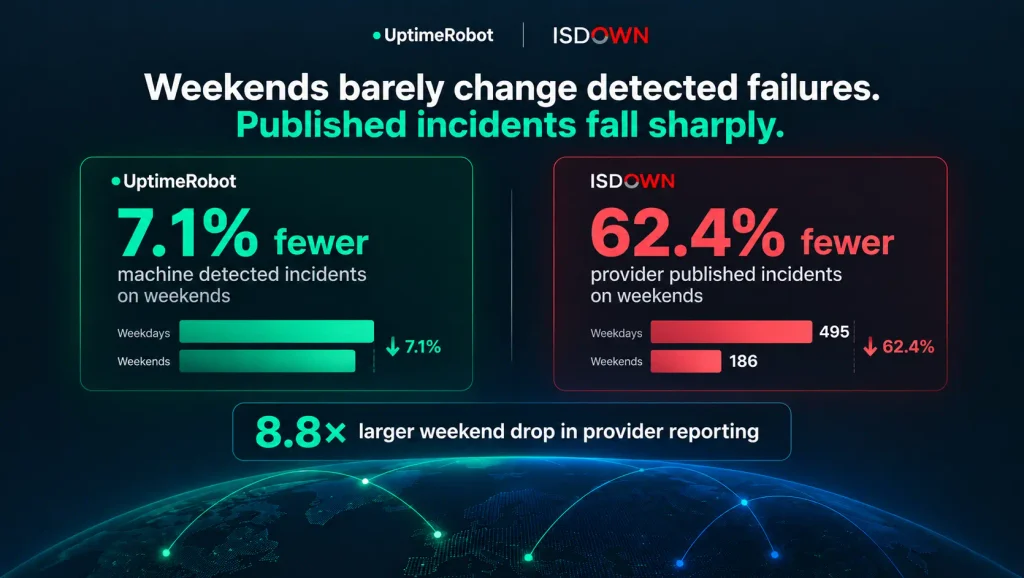
UptimeRobot detected just 7.1% fewer incidents per day on weekends than on weekdays in the first half of 2026. But incidents published on provider status pages fell by 62.4%, from an average of 495 per weekday to 186 per weekend day.
In other words, the weekend effect was nearly nine times stronger in provider reporting than in independent monitoring.
The gap doesn’t tell us that providers are hiding incidents. Traffic patterns, staffing, maintenance schedules and other factors can all affect what happens over a weekend. But it does show that public status pages and independent monitoring behave very differently depending on the day of the week.
The infrastructure doesn’t know it’s Saturday. The people who write status pages do.
When AWS went down, 99 services said so
On May 8, incident reports from 99 different services pointed to problems with AWS.
Redis published its incident at 00:01 UTC. AWS published its own incident 22 minutes later. Other services reporting problems linked to AWS that day included Reddit, Supabase, MongoDB, Confluent, Splunk Cloud, Palo Alto Networks, Marqeta and Dynatrace.
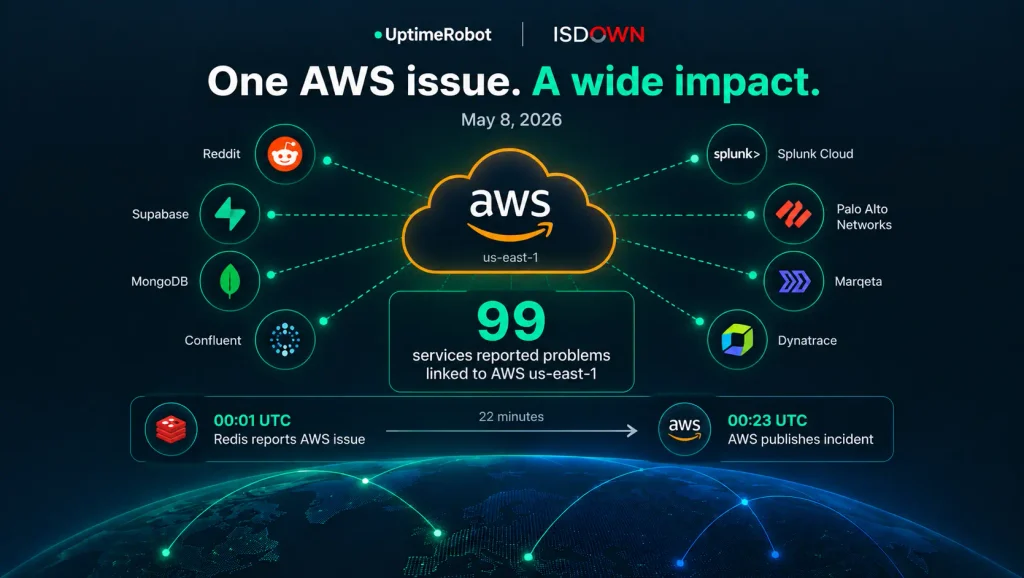
It wasn’t an isolated case. Across the first half of the year, we found multiple days when incidents published by otherwise unrelated services pointed back to the same infrastructure provider.
What looked like separate incidents across dozens of services had the same upstream provider in common. One provider problem can quickly look like dozens of unrelated ones. These were attributions made by services in their own incident reports, not independently verified root causes.
Most crowd reports had no matching official incident
Among crowd reports for services where we track an official status feed, 89.4% had no matching official incident within six hours.
When both crowd reports and an official status feed were available, users reported the problem first in 84% of the matched incidents we analyzed, with a median lead of 128 minutes.
That’s more than two hours between users saying something is wrong and a matching incident appearing on the provider’s status feed.
The 84% figure comes from a much smaller sample, with only 19 matched incidents passing our filters, so we wouldn’t treat it as a universal benchmark. It still shows why a status page shouldn’t be your only signal that something is down.
Did the internet really get 52% less reliable?
UptimeRobot detected 22.6 million incidents in January and 34.2 million in June, an increase of 52%.
That doesn’t mean the internet got less reliable.
The increase wasn’t gradual. Incident volumes stayed relatively flat through the first half of May, then jumped and remained higher for the rest of the period. UptimeRobot’s affected monitors rose by about 30% from January to June, but incident volumes increased faster.
We can’t separate those effects cleanly enough to call the increase a reliability trend. Even with that limitation, the dataset captures the scale of failures detected across UptimeRobot’s network.
Payment processing topped published incident counts
Payment processing recorded the most published incidents in the first half of 2026 with 8,571, followed by identity and authentication with 5,794 and API services with 5,526.
But a high incident count doesn’t necessarily mean a category was less reliable. One provider accounted for 81% of all published identity and authentication incidents, largely because of how frequently it publishes endpoint level updates.
The providers that report the most can also look like the providers that break the most.
Across all published incidents, the median time an incident remained open was 122 minutes. Almost a third closed within an hour, while 12.8% remained open for more than 24 hours.
Those figures measure how long providers kept incidents open on their status pages, not necessarily how long users experienced an outage.
Don’t wait for someone else’s status page
A provider’s status page is useful context, but the findings above show why it shouldn’t be your only signal. Independent monitoring can detect an impact before an incident is published.
Crowd reports can surface problems earlier. And when a payment processor, API provider or shared infrastructure service your product depends on has problems, the effects can reach your users before the full picture is clear.
UptimeRobot’s third party monitoring brings those signals closer together. You can track more than 6,000 cloud and SaaS providers alongside your own monitors, follow the specific components your product depends on and see official incidents and crowd reports without checking individual status pages.
Third party incidents can also trigger the same alert channels you already use for your own monitors.
That gives you both sides of an incident. Your monitors tell you what your systems are experiencing, while third party monitoring gives you context on what’s happening with the services they depend on.
Methodology
These findings come from two datasets covering the first half of 2026. UptimeRobot recorded 156.2 million machine detected incidents across 180 days, along with 333.6 million alerts. IsDown collected 71,405 incidents published by 4,075 services across 91 categories. The two datasets measure different things.
UptimeRobot records failures detected independently from the outside, whether or not the provider publishes an update. IsDown records incidents providers publish through their own status pages.
We analyzed UptimeRobot monitoring data and IsDown incident data from January through June 2026.
The UptimeRobot dataset covers 180 days. We excluded May 13 after a release caused false HTTP/S failures. Incident volumes increased around the same period and remained higher after the issue was fixed, which is one reason we don’t treat the increase in detections as a reliability trend.
We removed placeholder and non production sandbox feeds and merged mirror feeds before analysis. Scheduled maintenance remained in the dataset and accounted for 2.8% of published incidents.
Status page coverage varies by provider. A low incident count can reflect fewer published incidents, limited feed coverage or both, so published incident counts shouldn’t be read as a direct measure of service reliability.
See problems across your own systems and the services they depend on.