TL;DR (QUICK ANSWER)
Uptime is the percentage of time your site is reachable and working, calculated as (total time − downtime) ÷ total time × 100. Business sites should aim for at least 99.9%, which still allows about 43 minutes of downtime a month. SaaS products and APIs usually aim for 99.95% to 99.99%, which cuts that to between 22 minutes and just 4 minutes a month.
A one-off uptime test tells you whether your site is up right now, but continuous monitoring and uptime reporting show you what actually happened, and you can set that up for free in about five minutes.
Every minute your site is down, someone is trying to buy something, sign up, or log in, and they can’t. Most of them won’t wait around. They’ll try a competitor, and some won’t come back.
Uptime is the number that tells you how often that happens. We’ll go over what uptime means, how to calculate it, and what usually causes downtime. Then we’ll show you how to run an uptime test and set up uptime reporting, so you hear about problems before your customers do.
Key takeaways
- Most downtime comes from ordinary causes such as bad deploys, expired certificates or domains, and DNS mistakes. Staging, auto-renewal, and expiry alerts prevent much of it.
- Your uptime is limited by the services you depend on. A host at 99.9%, a DNS provider at 99.95%, and a payment gateway at 99.9% leave you at about 99.75%, or roughly 1 hour and 50 minutes of possible downtime a month.
- Match your check interval to your downtime budget. A short outage can start and end between two 5-minute checks, so stores and SaaS products usually need 1-minute checks or faster.
- Keep your own monitoring records. To claim an SLA credit, you need to prove the breach, and a provider’s internal monitoring can miss problems that still keep visitors out.
- Faster detection is where monitoring helps most. You can’t fix an outage until you know about it.
What is uptime?
Uptime is the percentage of time a website, server, or online service is reachable and working as expected.
If your site was available for 719 of the 720 hours in a 30-day month, its uptime for that month was 99.86%.
It’s measured over a set period, like a day, a month, or a year. Hosting companies quote it in their marketing, SaaS vendors promise it in contracts, and monitoring tools track it for you.
Uptime vs. downtime
Downtime is the flip side. It’s any time your site can’t be reached or doesn’t work properly. Add the two together and you get 100% of the period.
The tricky part is deciding what counts as “down.” A server that’s completely offline, or a page that returns a server error, is obviously down. A site that takes 30 seconds to respond is a grayer area, which we’ll cover below.
Uptime vs. availability vs. reliability
People use these words interchangeably, but they mean slightly different things.
- Uptime is whether the system is running and responding.
- Availability is whether people can actually use it. A site that responds but takes 30 seconds to load is technically up, but nobody would call it available.
- Reliability is how consistently it keeps working over time without failing.
Location matters as well. Your site can be up for visitors in Europe and unreachable from Asia because of a routing or CDN problem. A check from a single location would never notice.
Why 100% uptime isn’t realistic
Everything fails eventually. Servers need patches, data centers lose power, and cloud providers have bad days. Even the biggest platforms in the world publish incident reports every year.
Getting close to 100% uptime means paying for redundancy at every layer, including multiple servers, regions, and providers. For most sites, the smarter goal is to keep downtime short, catch it fast, and recover quickly.
How to calculate uptime
To calculate uptime, subtract downtime from the total time in the period, divide by the total time, and multiply by 100.
Uptime (%) = (Total time − Downtime) ÷ Total time × 100
Say your site was down for 45 minutes last month. An average month has 43,830 minutes (365.25 days divided by 12, times 1,440 minutes a day). So the math is (43,830 − 45) ÷ 43,830 × 100, which comes to 99.897% uptime, just under 99.9%.
That looks great on paper, but it’s 45 minutes during which nobody could access your site.
Here’s how much downtime each uptime percentage actually allows.
| Uptime | Per day | Per week | Per month | Per year |
| 99% | 14m 24s | 1h 40m 48s | 7h 18m 18s | 3d 15h 39m 36s |
| 99.5% | 7m 12s | 50m 24s | 3h 39m 9s | 1d 19h 49m 48s |
| 99.9% | 1m 26s | 10m 5s | 43m 50s | 8h 45m 58s |
| 99.95% | 43s | 5m 2s | 21m 55s | 4h 22m 59s |
| 99.99% | 8.6s | 1m 0s | 4m 23s | 52m 36s |
| 99.999% | 0.9s | 6s | 26s | 5m 16s |
What counts as downtime
This depends on how you (or your provider) define “down.” Most monitoring setups count these as downtime.
- Full outages: The server doesn’t respond at all.
- Server errors: The page returns a 5xx status code, like 500 or 503.
- Timeouts: The server takes too long to respond, so the request gives up.
- Missing content: The page loads, but an expected word or phrase is gone, which usually means something broke.
- Regional outages: The site works from one location but not from another.
- Planned maintenance: Some teams count it, others exclude it. Hosting SLAs almost always exclude it, so read the fine print.
Whatever rules you pick, stick to them. Uptime numbers are only useful if you measure the same way every month.
Composite uptime
Your site depends on a chain of other services, including your host, DNS provider, CDN, and payment gateway. If any one of them goes down, your site is effectively down too.
To estimate composite uptime, multiply the uptime of each dependency. A host at 99.9%, a DNS provider at 99.95%, and a payment gateway at 99.9% give you 0.999 × 0.9995 × 0.999, or about 99.75%.
That’s roughly 1 hour and 50 minutes of possible downtime a month, even though none of your providers broke their promises.
This is why monitoring your third-party services matters as much as monitoring your own site.
What’s a good uptime percentage?
For most business websites, 99.9% is the minimum to aim for. Blogs and portfolios can live with less, while SaaS products and APIs usually aim for 99.95% (about 22 minutes of downtime a month) or even 99.99% (about 4 minutes).
| Site type | Typical target | Monthly downtime allowed |
| Blog or portfolio | 99.5% to 99.9% | 43m 50s to 3h 39m |
| Business site or online store | 99.9% or higher | 43m 50s or less |
| SaaS product or API | 99.95% to 99.99% | 4m 23s to 21m 55s |
Each extra nine cuts your allowed downtime by 90%, and each one is harder and more expensive to reach than the last.
Moving from 99% to 99.9% takes you from about 7 hours of downtime a month to 43 minutes, and better hosting plus someone who responds to alerts is often enough to get there. At 99.99%, you have about 4 minutes a month, which is too little time for anyone to log in and fix a problem by hand.
That level takes redundant servers, automatic failover, careful deploys, and someone on call around the clock.
The right target isn’t the highest number you can find. It’s the point where paying for more uptime would cost more than the downtime it prevents.
What causes website downtime?
Most downtime comes from ordinary problems like server failures, bad deploys, DNS mistakes, and expired certificates, not dramatic attacks. The one people tend to overlook is an outage at a service they depend on, because their site can go down even when nothing is wrong with it.
When Cloudflare went down on November 18, 2025, UptimeRobot recorded about 2.24 million incidents, nearly three times the daily average and the biggest spike in a year of data. Many of those sites were perfectly healthy. They just depended on a service that wasn’t.
Hosting and server failures
Hardware dies, servers run out of memory, and shared hosting gets overloaded by noisy neighbors.
Prevention tip: Pick a host with a published uptime track record and some redundancy, and monitor from outside their network.
Bad deploys, config changes, and human error
A typo in a config file or an untested release can take a site down in seconds. This is one of the most common causes of outages, at every size of company.
Prevention tip: Test changes in a staging environment first and always have a quick way to roll back.
DNS problems
If your DNS records point to the wrong place, or your DNS provider has an outage, visitors can’t find your site even when the server is fine.
Prevention tip: Monitor your key DNS records so you know right away if something changes.
Expired SSL certificates
When a certificate expires, browsers show a big security warning and most visitors leave.
Prevention tip: Turn on auto-renewal and set up expiry alerts as a backup, because auto-renewal fails more often than you’d think.
Expired domain names
If your domain registration lapses, your whole site and your email can disappear overnight.
Prevention tip: Enable auto-renew with your registrar, keep the payment card up to date, and set a domain expiry alert.
Traffic spikes and resource limits
A viral post or a big sale can push your server past its limits. Ironically, your busiest moments are when you’re most likely to go down.
Prevention tip: Use caching and a CDN, and load test before big launches or sales.
Cyberattacks
DDoS attacks flood your server with traffic until it can’t keep up, and hacked sites may be taken offline or defaced.
Prevention tip: Use a CDN or firewall with DDoS protection, keep software updated, and use keyword monitoring to spot defaced pages.
Third-party and cloud provider outages
When a CDN, payment gateway, or cloud region goes down, every site that depends on it can feel it. You can’t fix their outage, but you can know about it fast.
Prevention tip: Monitor the third-party services you depend on as closely as your own site.
Database and plugin failures
A crashed database or a broken plugin update can leave the server running but the site unusable. This is especially common on WordPress.
Prevention tip: Update plugins on staging first, back up before updates, and monitor pages that depend on the database.
Planned maintenance
Sometimes downtime is on purpose. Updates and migrations may need the site offline for a while.
Prevention tip: Schedule maintenance for low-traffic hours, tell users in advance on your status page, and pause monitoring alerts during the window.
Why uptime matters
Downtime costs you money, customer trust, search visibility, and your team’s time. The longer and more often it happens, the more each of those adds up.
Lost revenue
The direct cost is easy to estimate.
Cost of downtime = (Revenue per hour × Hours down) + Recovery costs
Imagine an online store that makes $2,000 an hour. A three-hour outage costs $6,000 in lost sales. Add $1,500 for overtime, refunds, and a developer’s emergency fix, and you’re at $7,500 for one afternoon. And that’s before counting the customers who never come back.
Trust and brand
People don’t remember your uptime percentage. They remember the time they couldn’t check out, log in, or reach support. If outages happen often, customers start to see your product as unreliable, and that reputation is hard to shake.
SEO
Short outages rarely hurt your rankings, but long or repeated ones can.
According to Google Search Central, 5xx errors and network problems make Googlebot slow down its crawling. If pages keep returning server errors over a longer period, Google can eventually drop them from its index. DNS errors and timeouts get treated the same way, and they hit quickly.
So a 10-minute blip on a Tuesday night won’t matter. A site that falls over every few days, or stays down for a whole weekend, is a different story.
Team productivity
Every outage pulls people off their real work. Developers drop what they’re doing to firefight, support gets flooded with tickets, and someone has to write the apology email. The faster you find out about a problem, the less of everyone’s day it eats.
Uptime guarantees and SLAs
An SLA (service level agreement) is a promise from a provider that their service will be available a certain percentage of the time, usually with credits or refunds if they miss it. Hosts, cloud platforms, and SaaS tools all publish them.
A “99.9% uptime guarantee” sounds reassuring, but the details decide whether it’s worth anything. Before you rely on one, check these four things.
- How uptime is measured: Is it measured by the provider’s own systems, from where, and how often?
- What’s excluded: Planned maintenance, DDoS attacks, and problems “outside our network” are often left out, which can cover a lot of real-world downtime.
- What you get if they miss it: Usually it’s a service credit, a percentage of your monthly bill. It rarely comes close to what the outage cost your business.
- How and when to claim: Many SLAs require you to file a claim within a short window, often 30 days, with evidence.
How to prove an SLA breach
You need your own records to prove an SLA breach. A provider’s internal monitoring may only check whether their servers are running, which can miss network or routing problems that still keep your visitors out.
Independent monitoring from multiple outside locations gives you timestamped logs of every incident, including when it started, how long it lasted, and what error came back. Good uptime reporting turns those logs into reports you can hand straight to your provider when you file a claim.
With UptimeRobot’s SLA monitoring, you can set the uptime your provider promised as the target for the monitors on your own site, and at the end of each period you get a report showing your uptime, how much of the downtime budget was used, and which monitors went down.
It works the other way, too. If you offer an SLA of your own, an SLA badge on your site or docs shows customers the uptime you’ve actually delivered against your target, updated every hour.
How uptime monitoring works
An uptime monitor sends a request to your site on a schedule, checks whether the response looks right, re-checks any failure from a different data center in the same region, and then alerts you. It repeats this every few minutes or seconds, all day, every day.
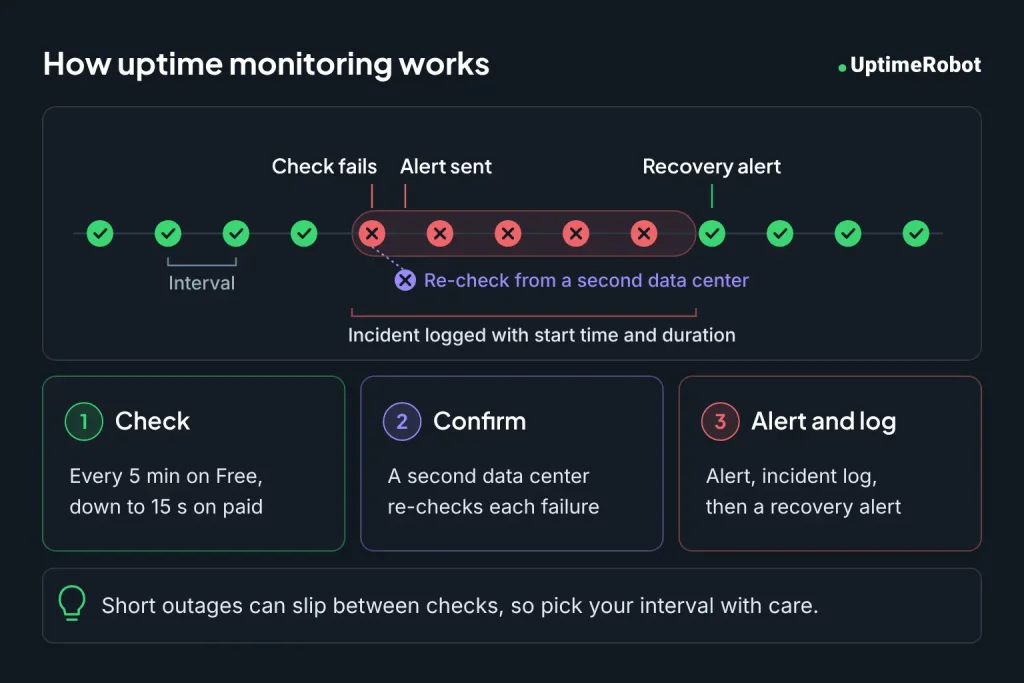
A few details decide how useful those checks are.
Timeouts: If your server doesn’t answer within a set time, the check counts as a failure. A site that technically responds after 30 seconds is down as far as your visitors are concerned.
Retries and confirmation: One failed request doesn’t always mean an outage. A brief network hiccup between the monitoring server and your site can cause a single failed check. That’s why UptimeRobot re-checks a failed check from a different data center in the same region before it alerts you, on every plan, Free included.
False positives: Without confirmation, you’d get woken up at 3 a.m. for problems that fixed themselves in two seconds. Too many false alarms and people start ignoring alerts, which is worse than having none.
How to run an uptime test
An uptime test checks whether a site is reachable right now. You can run a quick one by loading the site from a different network (like your phone on mobile data), or with a free online checker like UptimeRobot’s website checker.
A one-off uptime test is handy when someone says “the site’s down” and you want to know if it’s just them. What it can’t tell you is what happened at 2 a.m. last Tuesday.
For that, you need continuous monitoring, which is basically an uptime test that runs on repeat and keeps a record of every result.
What to monitor
Start with an HTTP(S) monitor on your homepage, then add checks for the things that can break without taking the whole site down. Each monitor type catches a different kind of problem.
| Monitor type | What it catches | Example | UptimeRobot plan |
| HTTP(S) | Site or page not responding, 4xx and 5xx errors | Homepage, checkout, login page | Free and paid |
| Keyword | Expected text missing, or unwanted text showing up | “Add to cart” disappears, or “Database error” appears | Free and paid |
| Response time | Pages getting slower before they fail | Alert when the homepage takes over 3 seconds | Paid (slow response alerts) |
| SSL certificate | Certificate expiring or invalid | Alert weeks before expiry | Paid |
| Domain expiry | Domain registration about to lapse | Alert before renewal date | Paid |
| Ping | Server or device not reachable | VPS, router, office server | Free and paid |
| Port | A specific service not responding | Mail server on port 25, database port | Free and paid |
| DNS | DNS records changed unexpectedly | A record now points to the wrong IP | Paid |
| Cron job / heartbeat | Scheduled jobs that stop running | Nightly backup didn’t check in | Paid |
| API | Endpoint returns wrong data or status | JSON field “status” isn’t “ok” | Paid |
How often should you check?
Check as often as your downtime budget demands. A 5-minute interval is fine for a blog, but a store or SaaS product usually needs 1-minute checks or faster, because a short outage can start and end between two 5-minute checks without anyone noticing.
| Check interval | Worst-case time before the first failed check | What it can miss |
| 5 minutes | Just under 5 minutes | Outages shorter than 5 minutes may never show up |
| 1 minute | Just under 1 minute | Very short blips under a minute |
| 30 seconds | Just under 30 seconds | Almost nothing a visitor would notice |
Add a little time on top for the confirmation check before the alert goes out.
The interval also affects your uptime reporting. With 5-minute checks, a 3-minute outage might never be recorded, so your reports can look better than what your visitors actually experienced.
On UptimeRobot, the Free plan checks every 5 minutes. Paid plans go down to 60 seconds on Solo, 30 seconds on Team, and 15 seconds on Scale.
Metrics beyond uptime (MTTD, MTTR, and MTBF)
Uptime tells you how much downtime you had. MTTD, MTTR, and MTBF tell you where it comes from, by showing how fast you notice problems, how fast you fix them, and how often they happen.
MTTD (mean time to detect) is the average time between a problem starting and your team knowing about it. If your site went down at 2:00 and the alert arrived at 2:02, detection took 2 minutes.
MTTR (mean time to recovery) is the average time from a failure starting to the site working again. If three outages last month took 20, 40, and 30 minutes to fix, your MTTR is 30 minutes.
MTBF (mean time between failures) is the average time your site runs between one outage and the next. Two outages in a 30-day month give you an MTBF of roughly 15 days.
Monitoring has the biggest effect on MTTD. You can’t start fixing something you don’t know is broken.
How to monitor your website uptime with UptimeRobot
You can have basic uptime monitoring running in about five minutes on UptimeRobot’s free plan. Steps 1 to 4, 6, and 8 work on Free. SSL and domain expiry alerts, maintenance windows, and Slack or Microsoft Teams alerts need a paid plan.
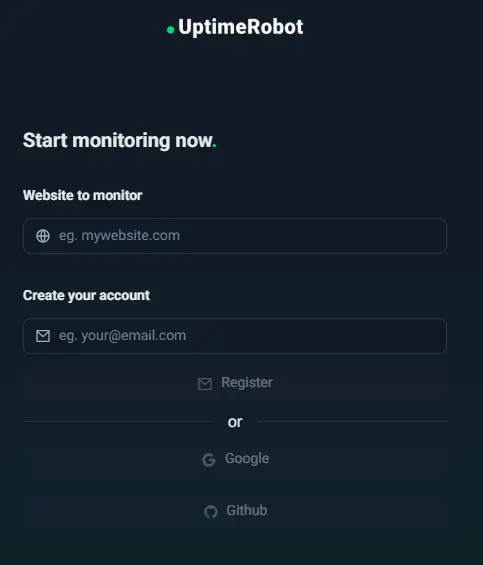
1. Create your account
Sign up with your email, Google, or GitHub account. You don’t need a credit card for the free plan.
2. Add an HTTP(S) monitor and set the interval
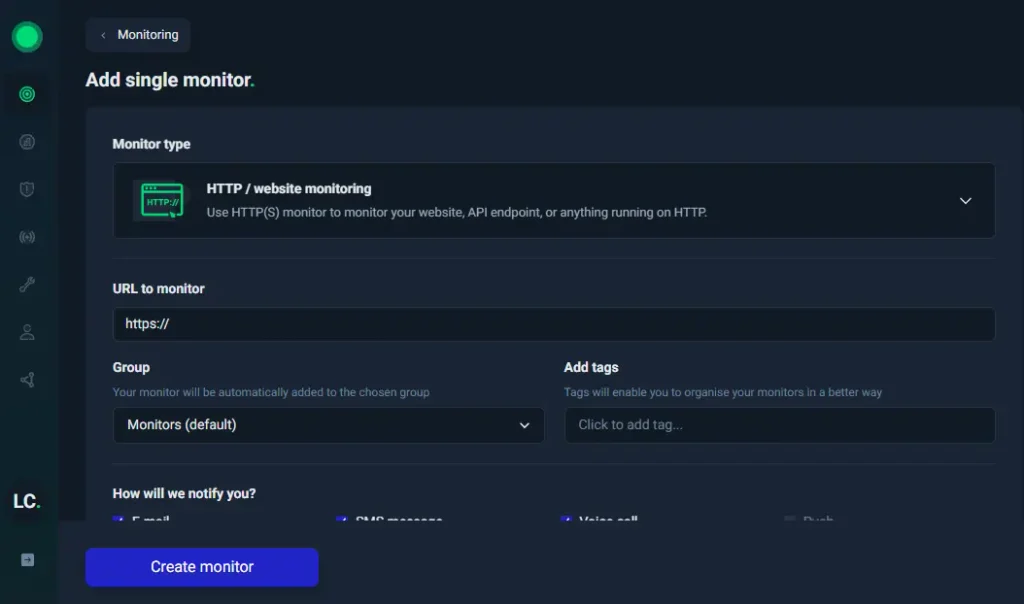
Click Add New Monitor, choose HTTP(S), and paste in your homepage URL. Give it a name you’ll recognize in an alert, then pick your check interval. Free accounts check every 5 minutes, and paid plans can go as low as 15 seconds.
Once the homepage works, add monitors for your other important pages, like checkout, login, and pricing.
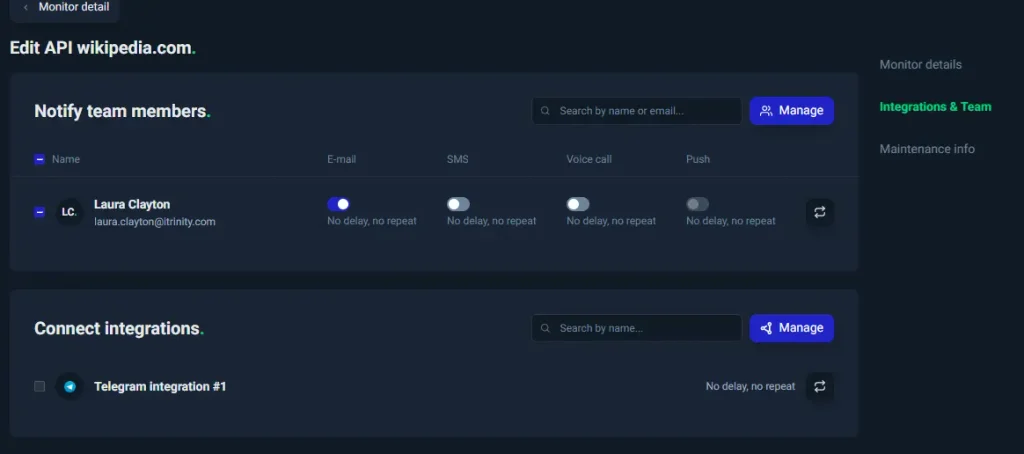
3. Set up alerts and alert contacts
Decide who gets told and how. Email and mobile app push notifications are the usual starting point. You can also send alerts by SMS or voice call (using credits), or to tools like Discord and Google Chat. Slack and Microsoft Teams alerts are available on paid plans.
Add teammates as alert contacts so a 3 a.m. outage doesn’t depend on one person’s phone.
4. Add a keyword monitor for content checks
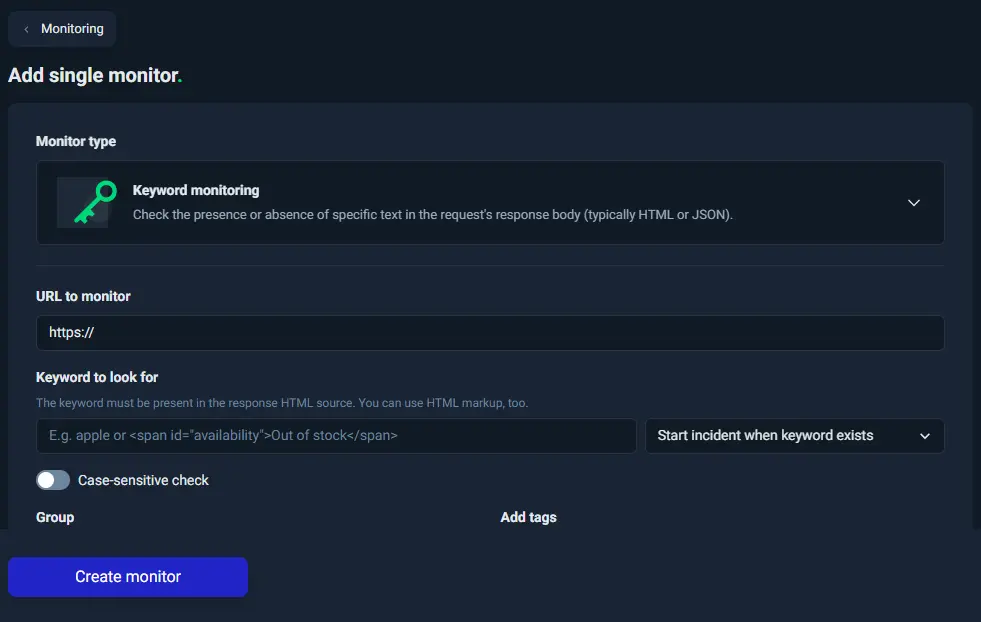
An HTTP check only tells you the page responded. A keyword monitor checks that the page actually shows what it should. Pick a word or phrase that’s always on the page, like your product name or “Add to cart,” and get alerted if it disappears.
Keyword monitoring reads the raw HTML from your server, so text that only appears after JavaScript runs won’t be detected. Check that your keyword shows up in “View page source.”
5. Turn on SSL and domain expiry alerts
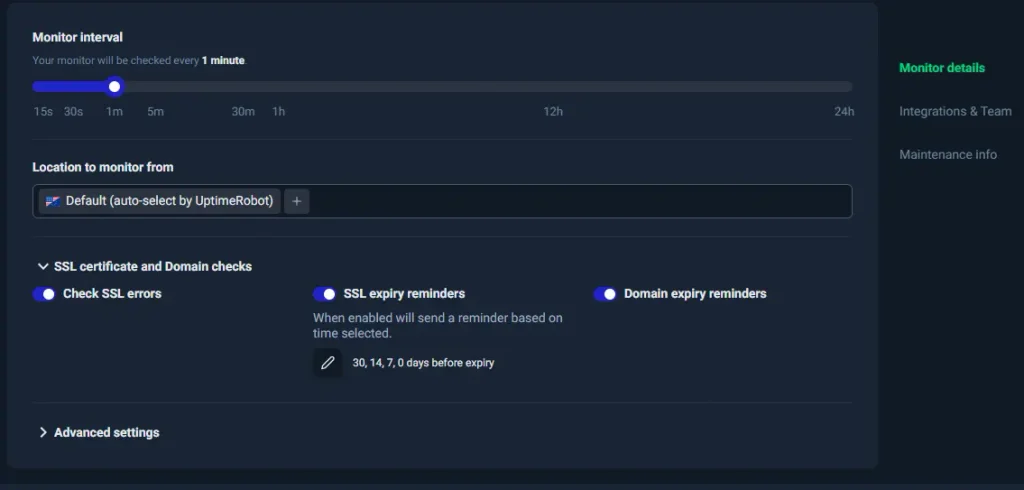
On paid plans, UptimeRobot warns you before your SSL certificate or domain registration expires. SSL alerts go out 30, 14, and 7 days before expiry and on the day it expires by default, which gives you time to fix a failed auto-renewal. For auto-renewed certificates like Let’s Encrypt, the first alert arrives 14 days out, and you can add your own reminder days.
6. Create a status page
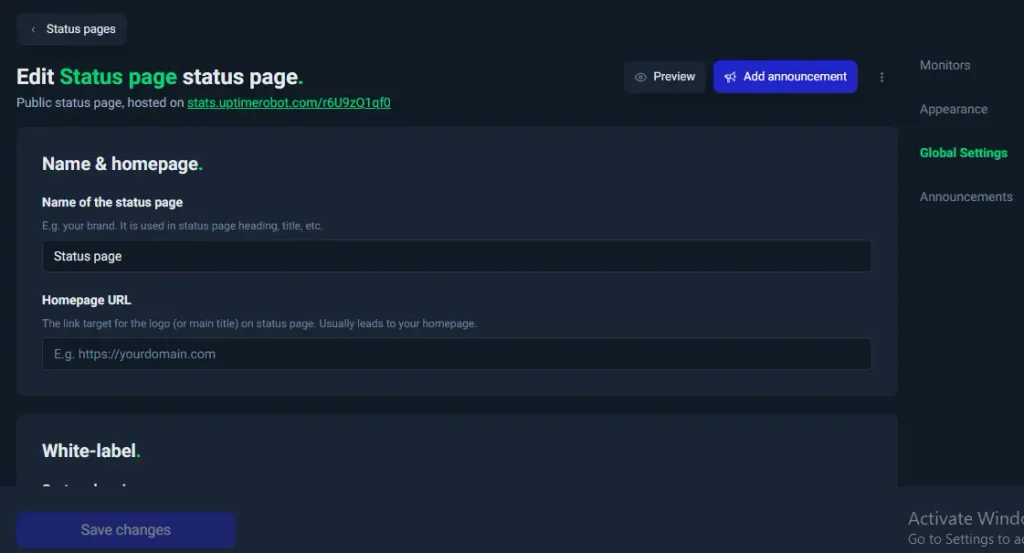
A status page tells your users what’s going on during an outage, so they don’t have to flood your support inbox. The free plan includes one basic status page. Paid plans add custom domains, your own branding, and more pages.
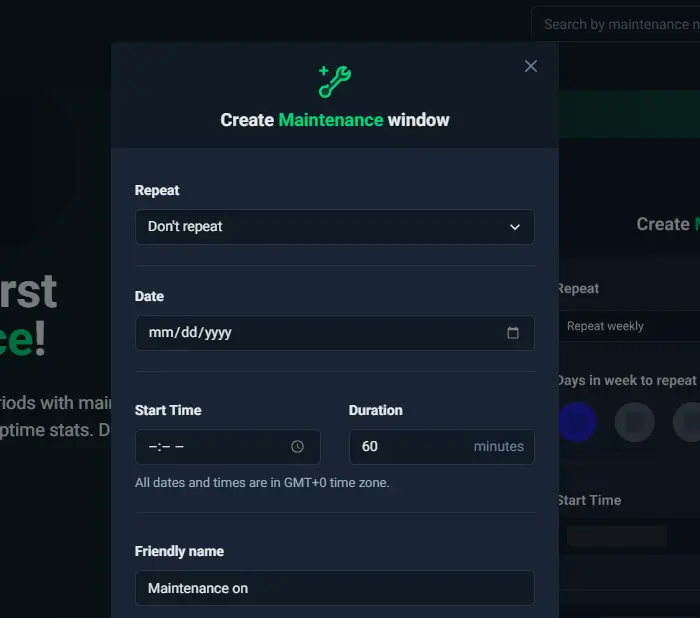
7. Schedule a maintenance window
If you know the site will be down for an update, set a maintenance window on a paid plan. Monitoring pauses for that period, so you won’t get false alerts and the planned downtime is handled separately from real incidents.
8. Read your uptime reports
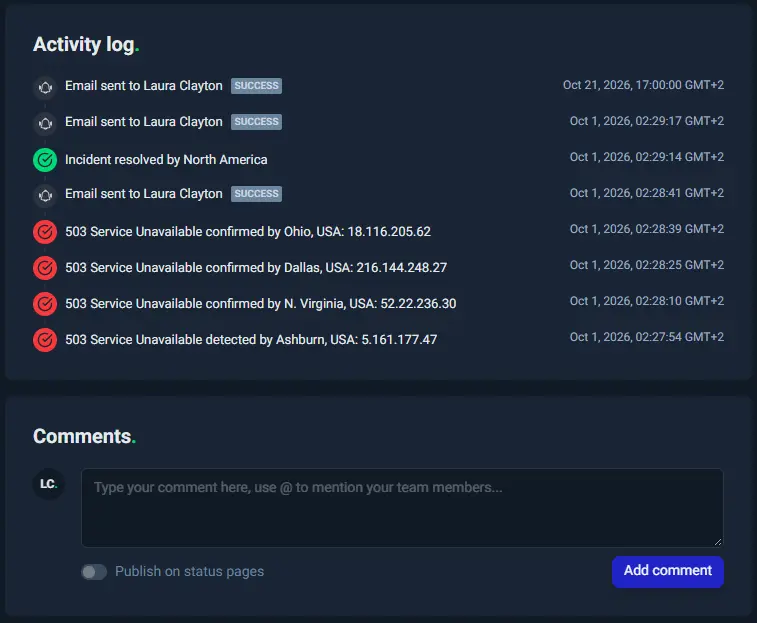
The dashboard shows the current status of every monitor, along with uptime percentages, response times, and recent incidents. Click into a monitor to see its full incident history, including when each outage started, how long it lasted, and what error came back.
That’s the core of uptime reporting. You can see trends over time, spot pages that fail more often than others, and pull together the evidence you need for an SLA claim or a monthly report to your boss or client.
How far back you can look depends on your plan. Free keeps 3 months of data, Solo keeps 12 months, and Team and Scale keep 24 months. Free accounts also get monthly email reports for the first 3 months, while paid plans keep getting them.
What to do when your site goes down
Confirm the outage, find out whether the problem is yours or a provider’s, fix it, and keep your users in the loop. Here’s a checklist to work through.
- Confirm it’s really down. Check from another network or device, or run a quick uptime test from several locations. Sometimes the problem is just your Wi-Fi.
- Check your host’s and dependencies’ status pages. If your host, CDN, or payment provider is having an outage, you’ll know where the problem is right away.
- Look at recent changes. Was there a deploy, a plugin update, or a config change in the last hour? That’s the most likely suspect. Roll it back if you can.
- Check SSL, DNS, and domain. An expired certificate, a changed DNS record, or a lapsed domain can all look like a server outage.
- Contact your host. If you can’t find the cause, open a ticket with your hosting provider and include the error messages and timestamps from your monitoring.
- Update your status page. Tell users you know about the problem and are working on it. Post again when it’s fixed.
- Write a short post-mortem. Once things are stable, note what happened, how long it lasted, what fixed it, and what you’ll change so it doesn’t happen again. Your monitoring logs give you the timeline.
Other uptime monitoring tools
UptimeRobot isn’t the only option. Depending on your setup, one of these might suit you better.
- Better Stack combines uptime monitoring with incident management and logging.
- Pingdom offers uptime checks plus real user monitoring and transaction checks.
- StatusCake covers uptime, page speed, SSL, and domain monitoring.
- Site24x7 monitors websites alongside servers, networks, and cloud infrastructure.
- Uptime Kuma is free, open-source, and self-hosted, which suits teams that want to run monitoring on their own servers.
Best practices to maximize uptime
You can’t prevent every outage, but you can make them rarer and shorter.
- Choose reliable hosting with redundancy. A host with failover and multiple data centers can keep you running when one server dies.
- Use staging and rollbacks for deploys. Test changes before they go live, and make sure you can undo a bad release in minutes.
- Auto-renew SSL certificates and domains. Then set expiry alerts anyway, because renewals fail more often than people expect.
- Add caching and a CDN. They take load off your server and help you survive traffic spikes.
- Keep regular backups. Test restoring them, too. A backup you’ve never restored is a guess.
- Watch your server resources. CPU, memory, and disk space problems usually build up slowly before they cause an outage.
- Monitor your third-party dependencies. Know when your payment gateway, CDN, or cloud provider is having trouble, not just your own server.
- Monitor externally from multiple locations. Checks from outside your network catch the problems your visitors actually see, and checking from more than one region catches outages that only hit part of the world.
Start tracking your uptime
Uptime is a simple number with a lot behind it. It reflects your hosting, your deploys, your dependencies, and how fast your team reacts when something breaks.
You don’t need to chase five nines (99.999%, or about 26 seconds of downtime a month). You do need to know when your site goes down, why it happened, and how often it happens. An occasional uptime test tells you what’s happening right now. Continuous monitoring and regular uptime reporting tell you the whole story.
Set up your first monitor in minutes, and you’ll hear about the next outage before your customers do.
-
An uptime test checks whether a website or server is reachable and responding correctly at a given moment. A one-off test is useful for confirming an outage. Continuous monitoring runs that test automatically every few minutes or seconds and alerts you when it fails.
-
For a quick check, load your site from a different network or use a free online checker. To track uptime over time, set up an uptime monitor that checks your site on a schedule and keeps a record of every outage.
-
Uptime reporting is the record of how available your site or service was over a period, usually shown as a percentage along with a list of incidents and their durations. Teams use uptime reports to track reliability, share results with clients, and prove SLA breaches.
-
It means your site was available 99.9% of the time. That still allows about 43 minutes and 50 seconds of downtime a month, or roughly 8 hours and 46 minutes a year. It’s easy to confuse with 99.99%, which allows only about 4 minutes and 23 seconds a month.
-
Yes. UptimeRobot’s free plan includes 50 monitors with 5-minute checks, covering HTTP(S), keyword, ping, and port monitoring, plus email and mobile app alerts and a basic status page.