A good website response time is a time to first byte (TTFB) of 800 milliseconds or less, according to Google’s web.dev guidance, and PageSpeed Insights rates it at the 75th percentile of real visits.
Anything above 1.8 seconds counts as poor. When it comes to alerts, the right threshold depends on what each monitor usually does, because a fast API and a heavy page need different numbers.
Key takeaways
- Google’s web.dev rates a TTFB of 0.8 seconds or less as good and more than 1.8 seconds as poor, at the 75th percentile of visits
- Lighthouse flags a main document slower than 600 ms. The 200 ms figure is old PageSpeed guidance
- APIs have no official standard. In openstatus’s bands, under 200 ms is fast
- Judge percentiles and regions, not one average
- Set each monitor’s alert threshold from its own usual response time, or let UptimeRobot set it
What’s a good server response time?
Google’s web.dev splits TTFB into three bands. PageSpeed Insights rates them at the 75th percentile, so three out of four page loads should come in at or under the number.
| Rating | TTFB at the 75th percentile |
| Good | 800 ms or less |
| Needs improvement | More than 800 ms, up to 1.8 s |
| Poor | More than 1.8 s |
An API usually needs a faster answer than a full page, so API response time and TTFB each get their own targets below.
Response time, TTFB, and page load time are different numbers
These three get mixed up a lot, and each one answers a different question.
Server response time
How long the server takes to answer a request, measured from wherever the request is sent. Uptime monitoring tools usually report this figure for each check.
Time to first byte (TTFB)
The time until the first byte of the response reaches the browser. web.dev counts redirect time, service worker startup, DNS lookup, connection and TLS negotiation, and the request itself. So TTFB includes network setup that a timer on the server doesn’t see.
Page load time (LCP)
How long the page takes to show its main content. Largest Contentful Paint (LCP) is the Core Web Vitals metric for it: 2.5 seconds or less is good, and more than 4 seconds is poor.
A fast server response doesn’t guarantee a fast LCP, since images, scripts, and fonts still have to load.
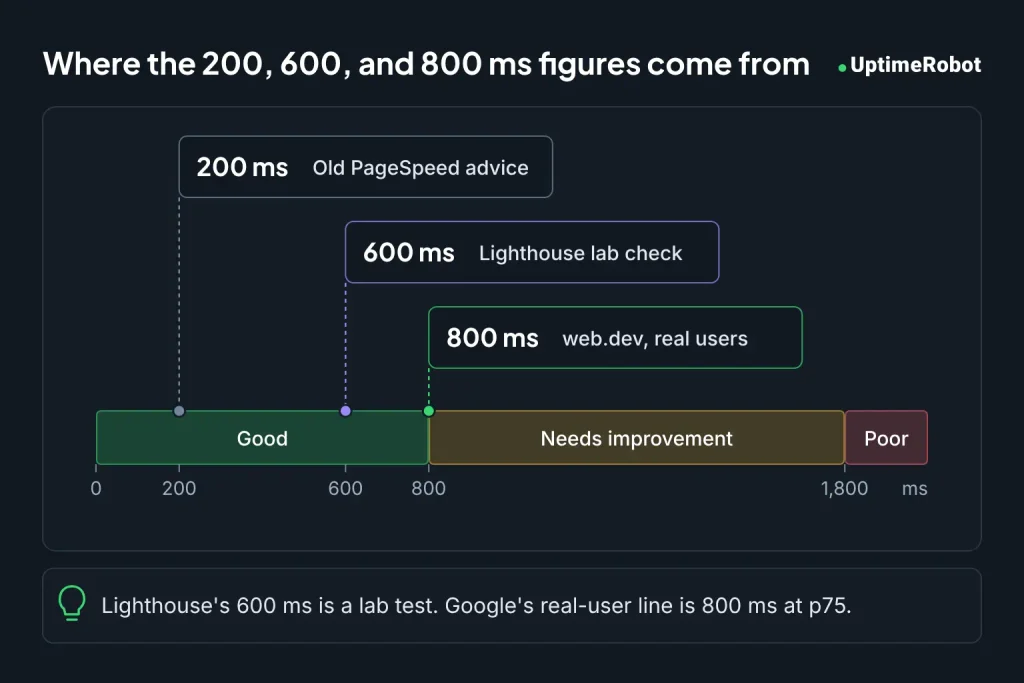
Where the 200 ms, 600 ms, and 800 ms figures come from
Search for a good response time and you’ll find three different numbers. Each one comes from a different Google tool and a different time.
- 200 ms: Google’s PageSpeed Insights guidance for version 4 of its API said “You should reduce your server response time under 200ms.” That page is now marked deprecated, and version 4 was scheduled to shut down in May 2019.
- 600 ms: Lighthouse, the engine behind PageSpeed Insights and the Lighthouse panel in Chrome DevTools, fails its server response time audit “when the browser waits more than 600 ms for the server to respond to the main document request.” In Lighthouse 13, this check moved into the Document request latency insight.
- 800 ms: web.dev‘s current TTFB guidance, which PageSpeed Insights rates at the 75th percentile of real visits.
For a lab test of your main document, 600 ms is the line Lighthouse draws. For real users, 800 ms at the 75th percentile is Google’s current guidance.
200 ms is still a useful goal for a server on its own, but it’s no longer an official threshold.
What’s a good API response time?
There’s no official standard for API response times. Teams set their own targets, and published rules of thumb differ. openstatus, an open-source monitoring tool, uses these bands:
| Response time | openstatus label |
| Under 200 ms | Fast |
| 200 to 500 ms | Acceptable |
| 500 ms to 1 s | Slow |
| Over 1 s | Needs attention |
An API should usually answer faster than a page. A page request often has the server build a whole HTML document, and the browser still has to load and render everything it links to. An API call returns data that another service or app is waiting on, often several calls in a row, so each extra 100 ms adds up.
What’s a good TTFB?
web.dev rates a TTFB of 800 ms or less as good and more than 1.8 seconds as poor, and PageSpeed Insights applies those bands at the 75th percentile.
TTFB covers more than your server. It includes redirects, DNS lookup, connection and TLS setup, and the request itself.
That’s why the total alone can mislead. openstatus gives an example. A server that answers in 40 ms behind a 300 ms connection phase is a fast application a long way from the user. Splitting the total into phases shows whether to work on distance or on your code.
Judge percentiles and regions, not one average
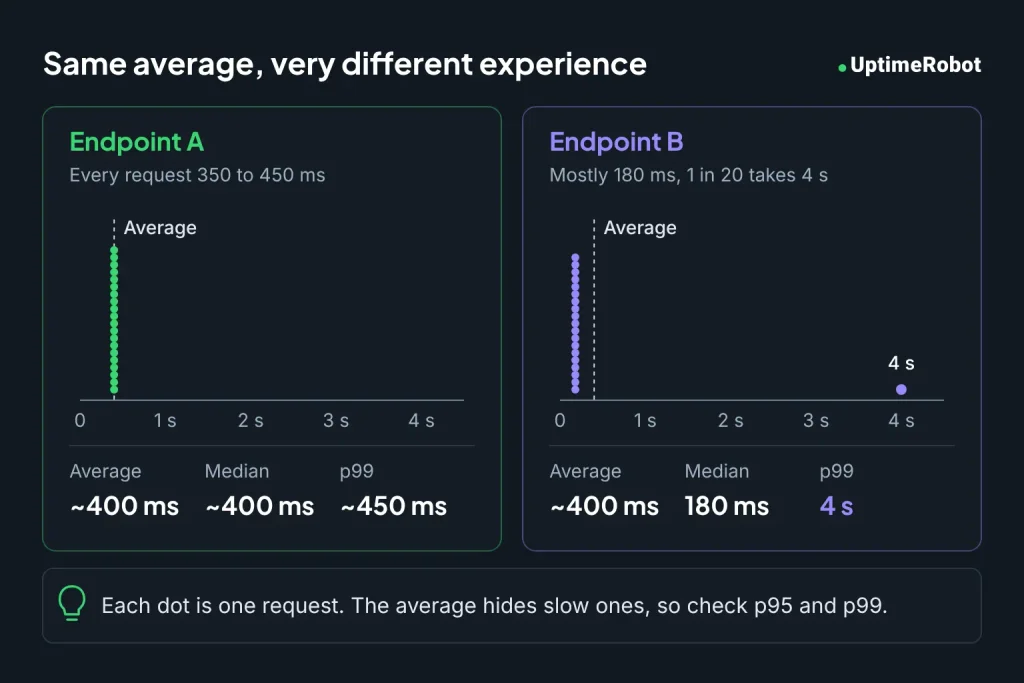
An average hides the slow requests your users remember. openstatus shows it with two endpoints that both average roughly 400 ms. On endpoint A, almost every request lands between 350 and 450 ms. On endpoint B, most requests take 180 ms, and one in twenty takes 4 seconds.
Percentiles show the difference:
- p75: three out of four requests are faster than this. Core Web Vitals use it, so it’s the one to compare with Google’s bands.
- p95: one request in twenty is slower than this. Endpoint B’s slow requests sit right at p95 and show clearly in p99, while its average looks fine.
- p99: one request in a hundred is slower. It shows how slow it gets for your unluckiest users.
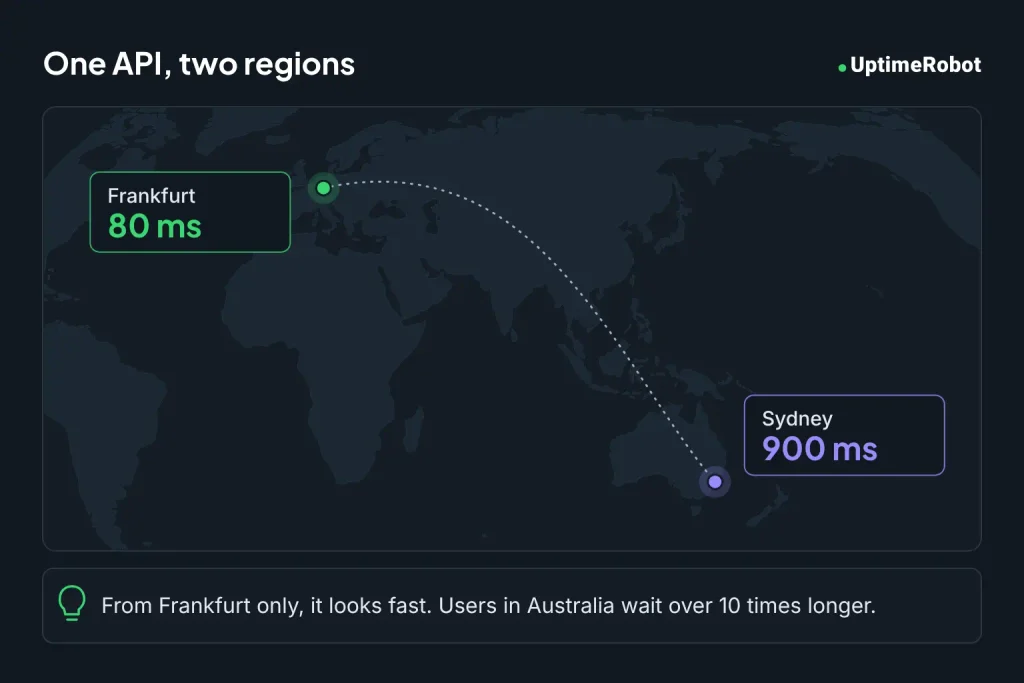
Region matters just as much. openstatus’s example is an API answering in 80 ms from Frankfurt and 900 ms from Sydney. Tested from Frankfurt only, it looks fast, and users in Australia wait more than ten times as long.
How to set a response-time alert threshold
A response-time alert should fire when users would notice a slowdown, and stay quiet the rest of the time. That depends on picking the right number for each monitor, either by setting it yourself or by letting UptimeRobot set it.
Why each monitor needs its own threshold
Take an API that normally answers in 120 ms and a page that normally needs 700 ms. Set both to 1,000 ms, and the API can get eight times slower before you hear about it, while the page alerts every time it has a busy moment.
Regions add the same problem. With the Frankfurt and Sydney example from earlier, a threshold that suits Sydney’s 900 ms lets Frankfurt get ten times slower unnoticed.
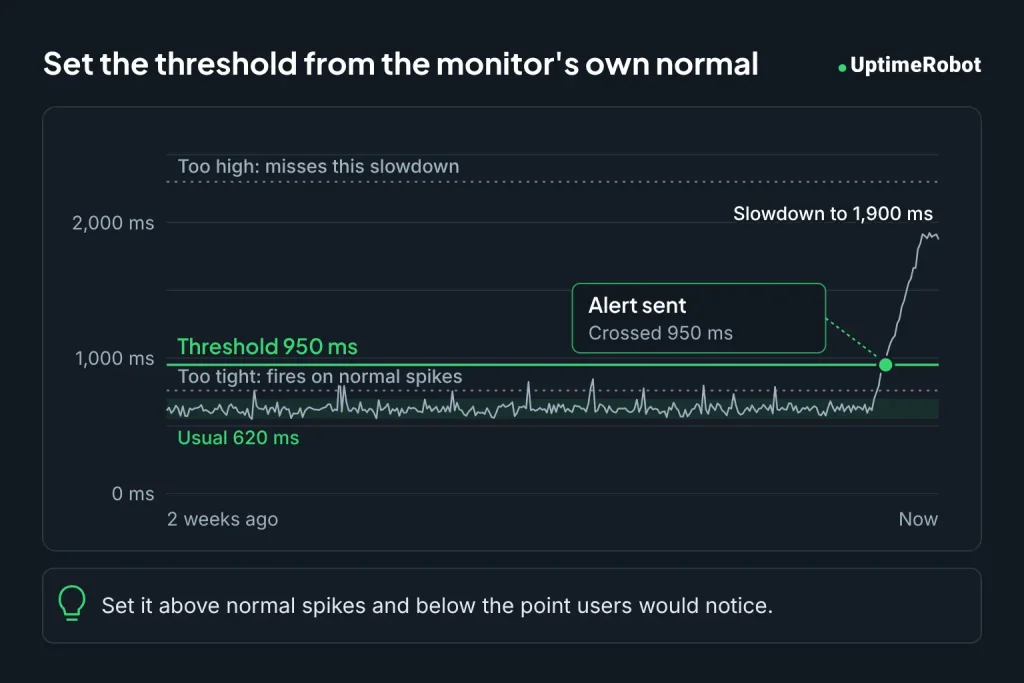
Setting a threshold yourself
Base the number on the monitor’s own usual response time. A generic benchmark doesn’t know your stack.
- Look at a couple of weeks of response time history for the monitor, per region if you check from several.
- Note the usual value and how far normal spikes go above it.
- Set the threshold above those normal spikes and below the point where users would notice.
- Revisit it after big changes, such as a new host, a CDN, or a redesign. A threshold set for a slow site stays too loose once the site gets faster.
If you set it too close to normal, it fires on small spikes nobody notices. Set it too high and it misses real slowdowns until they’re severe.
With UptimeRobot, you can type your own threshold between 50 ms and 5,000 ms for each region.
Letting UptimeRobot set it
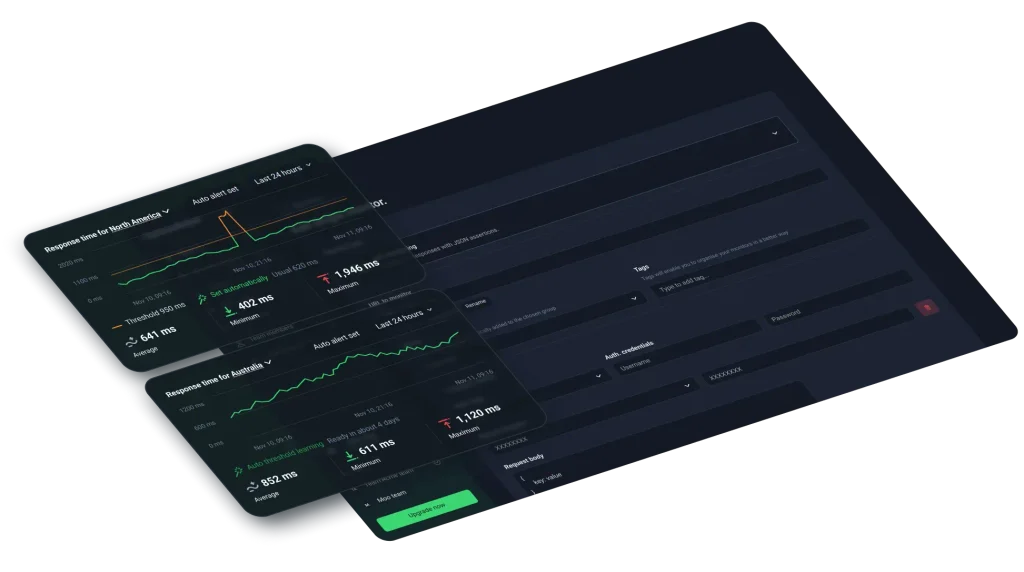
With automatic thresholds, UptimeRobot learns each monitor’s usual response time in each region and sets the threshold from it.
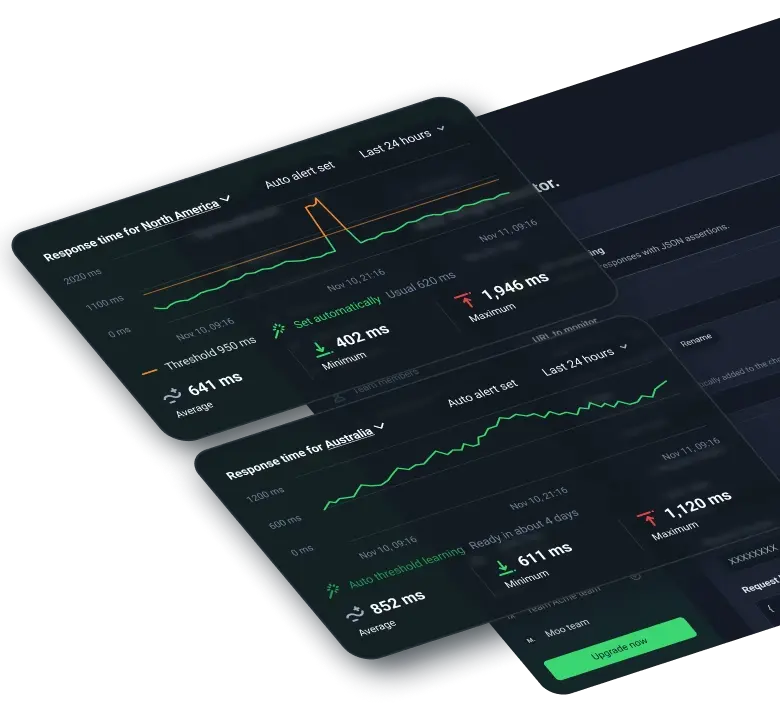
Past outages and slow periods don’t raise the threshold, a gradual slowdown doesn’t drag it up, and when the site gets faster, the threshold follows it down.
When a region gets clearly slower than usual, the alert shows all three numbers:
Response time 1,900 ms in North America. Usual: 620 ms. Threshold: 950 ms.
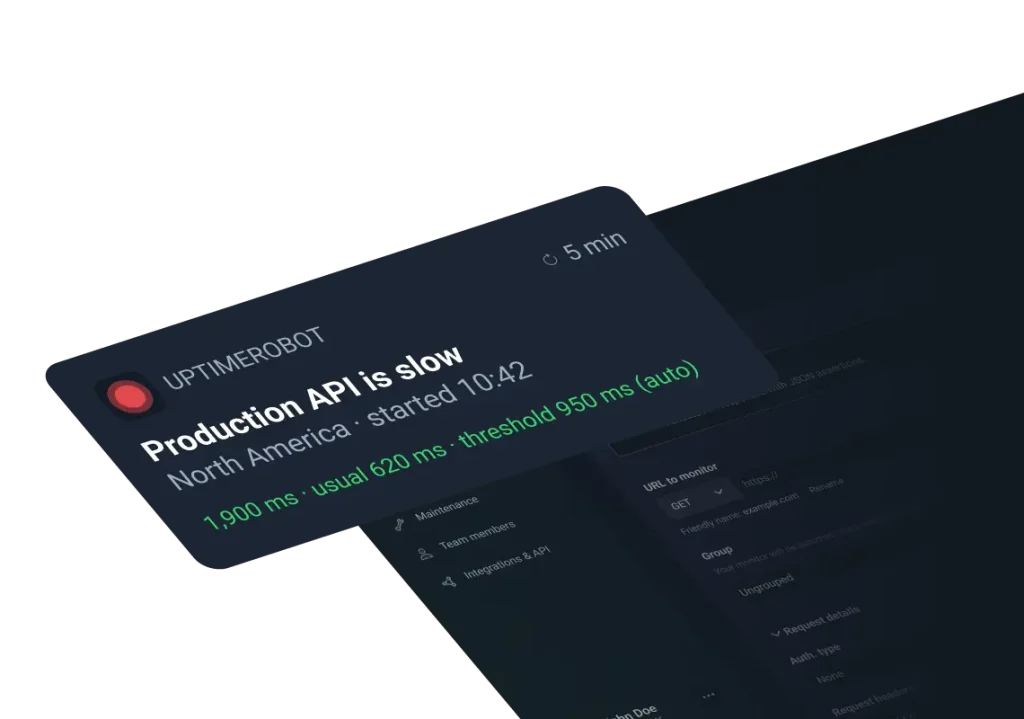
A new monitor learns for a while before it gets a threshold, and it sends no slow response alerts until then. Monitors that already have response time history get one as soon as you switch the setting to Auto. If you type your own number, the monitor switches to Manual.
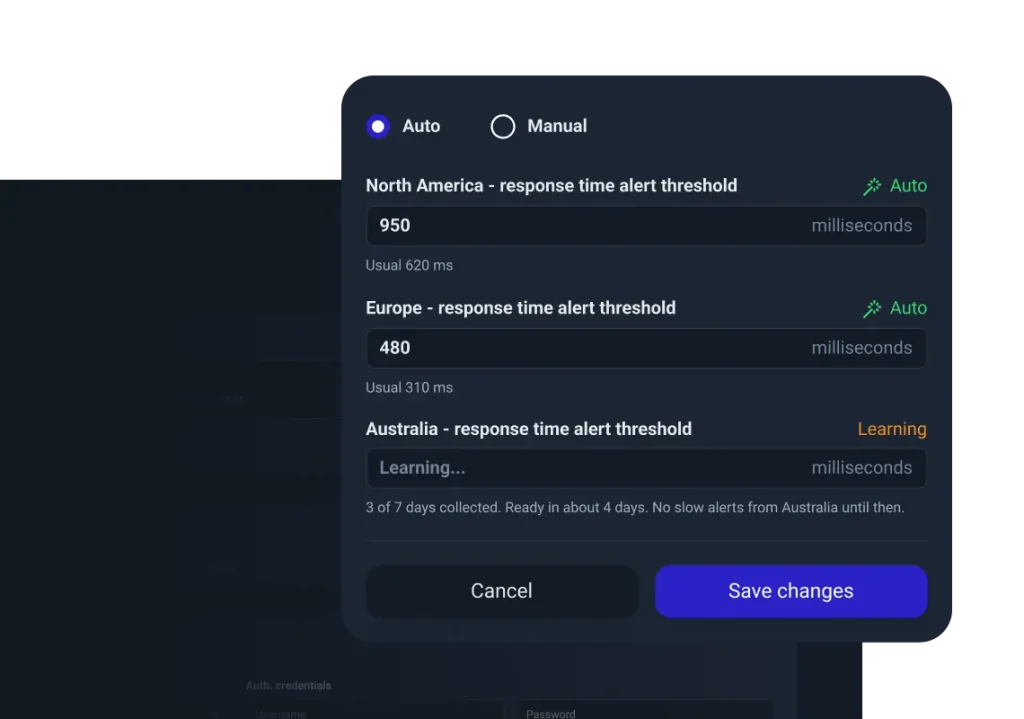
Automatic thresholds are part of slow response alerts on Solo, Team, Scale, and Enterprise plans. They’re opt-in, and bulk actions switch many monitors to them at once.
How to check your response time
For a one-off check, two free tools cover most cases:
- PageSpeed Insights: enter a URL to get Lighthouse’s lab results, plus real-user TTFB and LCP from the Chrome UX Report when your site has enough traffic.
- Chrome DevTools: open the Network panel, reload the page, select the page request, and open the Timing tab. “Waiting for server response” is the wait for the first byte. It covers one network round trip plus the time your server takes to build the response.
For ongoing checks, use a monitoring tool that tests your site at a fixed interval from several regions and keeps the history. A one-off test tells you how fast the site was at that moment. A monitor tells you when it changes.
Get alerted when your site is slower than usual
Turn on slow response alerts in UptimeRobot and let it set the threshold for you. It learns each monitor’s usual response time in each region. Slow response alerts are included on Solo and higher plans.
-
For web pages, Google’s web.dev rates a time to first byte (TTFB) of 800 ms or less as good and more than 1.8 seconds as poor, and PageSpeed Insights checks it at the 75th percentile of visits. Lighthouse flags a main document response slower than 600 ms. APIs have no official standard. In openstatus’s bands, under 200 ms is fast and over 1 second needs attention.
-
A response time clearly above what that monitor usually does. Look at the monitor’s normal response time and its usual spikes, then set the threshold above the spikes and below the point users would notice. If you check from several regions, set one per region. UptimeRobot can do this for you by learning each monitor’s usual response time in each region.
-
Percentiles. An average can hide slow requests. Two endpoints can both average roughly 400 ms while one of them takes 4 seconds on one request in twenty. Use p75 to compare with Google’s TTFB and Core Web Vitals bands, and p95 or p99 to see the slowest responses your users get.
-
You’re probably testing from close to your server, with a warm cache and a fast connection. Users further away add network distance, DNS lookups, and TLS setup to each request, and they may hit pages your cache doesn’t cover. Check response time from the regions your users are in, and compare percentiles instead of one test.
-
No. Response time is how long the server takes to answer a request. Page load time also includes downloading and rendering images, scripts, and fonts. Largest Contentful Paint (LCP), the Core Web Vitals metric for loading, rates 2.5 seconds or less as good. A page can have a fast server response and still load slowly.