Your uptime is probably better than your customers think. But the proof sits in your UptimeRobot dashboard, where only your team can see it.
Starting today, you can put it on your website.
SLA badges let you set an uptime target for your monitors, then embed a live badge that shows the uptime you actually delivered, colored against that target. Add it to your site footer, your docs or your GitHub README, and get the result by email at the end of each period.

What does the badge show?
An SLA badge shows the UptimeRobot logo and your uptime for the current period, up to three decimal places. The color shows how that compares to the target you set:
- Green: you’re at or above your target.
- Yellow: you’re below your target, but above your warning value.
- Red: you’re below your warning value.
The color follows your uptime for the whole period, not what’s happening this minute.
That’s what makes it worth showing: anyone looking at your badge sees your track record, not a snapshot.
Set up your first SLA policy
An SLA policy is the target the badge measures. You create it in two short steps, monitors and then configuration.
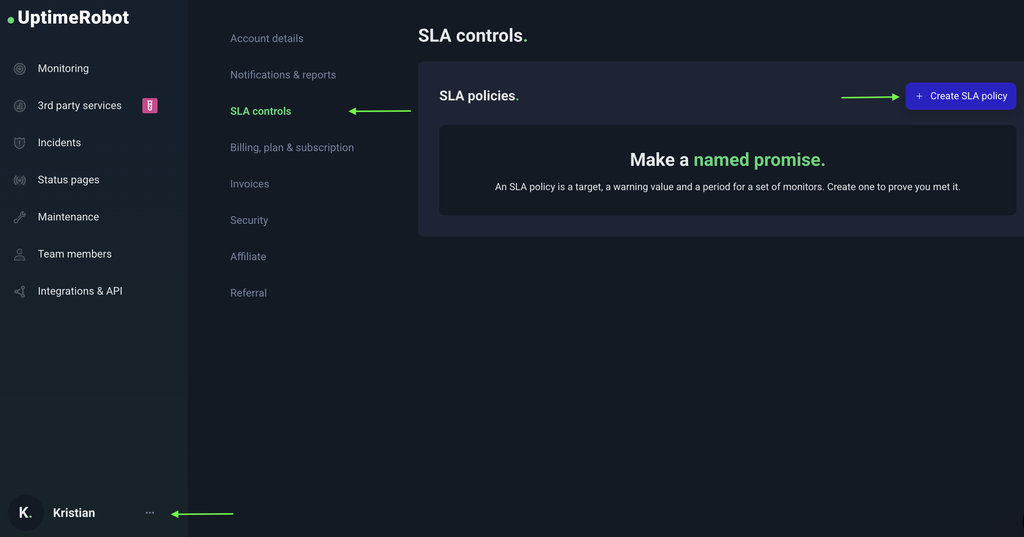
1. Open SLA controls. In your dashboard, click the three dots next to your name in the bottom-left corner and choose Account details. Then open SLA controls in the menu on the left.
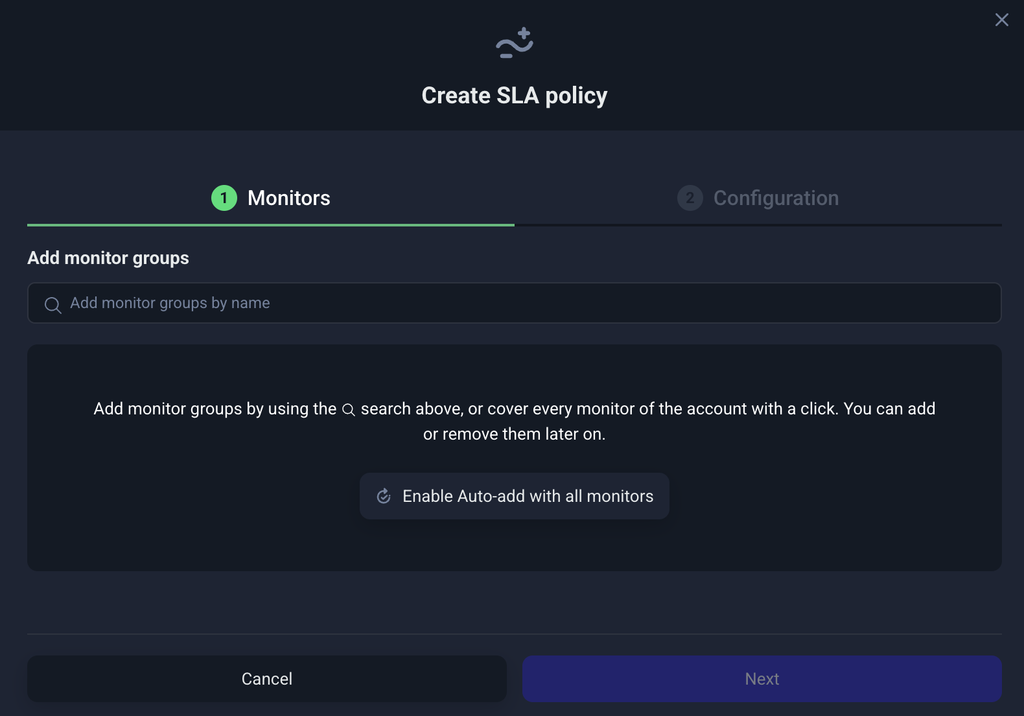
2. Choose your monitors. Click Create SLA policy. In the Monitors step, add the monitor groups the policy should cover by searching for them by name, for example all the monitors behind one client’s website.
Or click Enable Auto-add with all monitors to cover every monitor in your account. Monitors you add to a covered group later join the policy automatically, and you can add or remove groups at any time. Click Next.
3. Set your target. In the Configuration step, name the policy, for example after the client or the service it’s for. Then fill in two numbers. The target value is the uptime you promise, for example 99.99. The warning value is where yellow turns into red, for example 99.9.
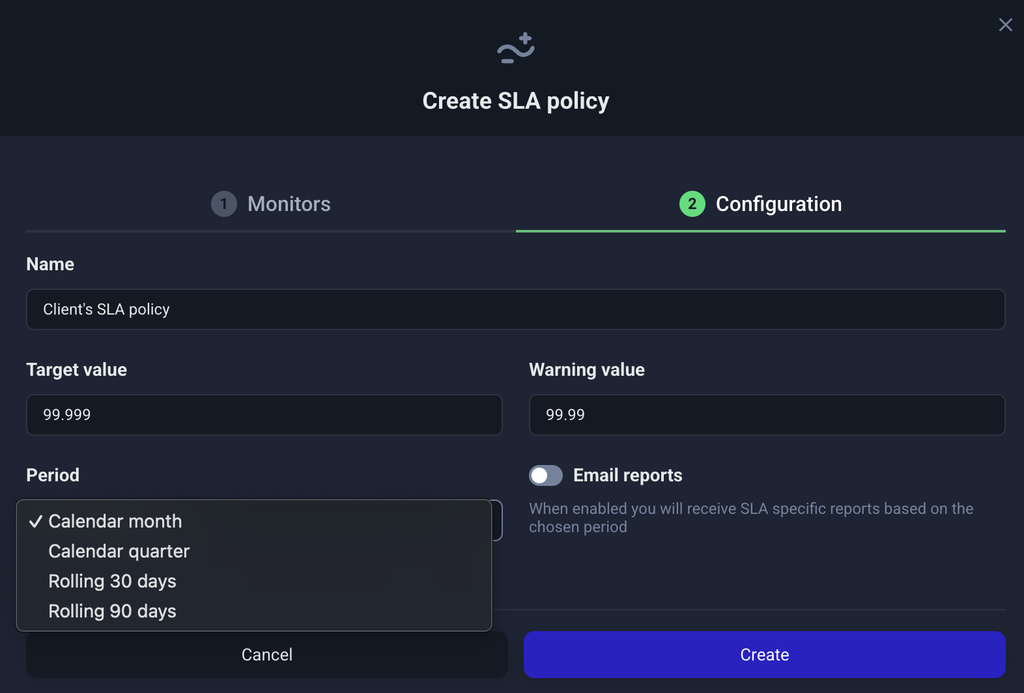
4. Pick a period and reports. Choose the time span your result covers:
- Calendar month or calendar quarter, if your contract settles per month or quarter, for example when service credits are calculated for September.
- Rolling 30 days or rolling 90 days, if you want a number that never resets.
Calendar month and rolling 30 days are available on every plan. Calendar quarter and rolling 90 days come with paid plans. In the same step, turn on Email reports if you want the result emailed to you at the end of each period.
5. Click Create. Your policy appears in SLA controls with its target, warning value and period, and a Badge button next to it.
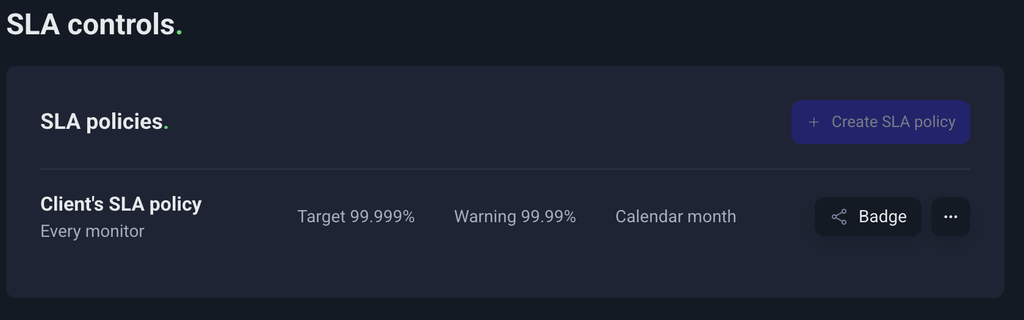
Add the badge to your site or README
Click Badge next to your policy to open the badge window.
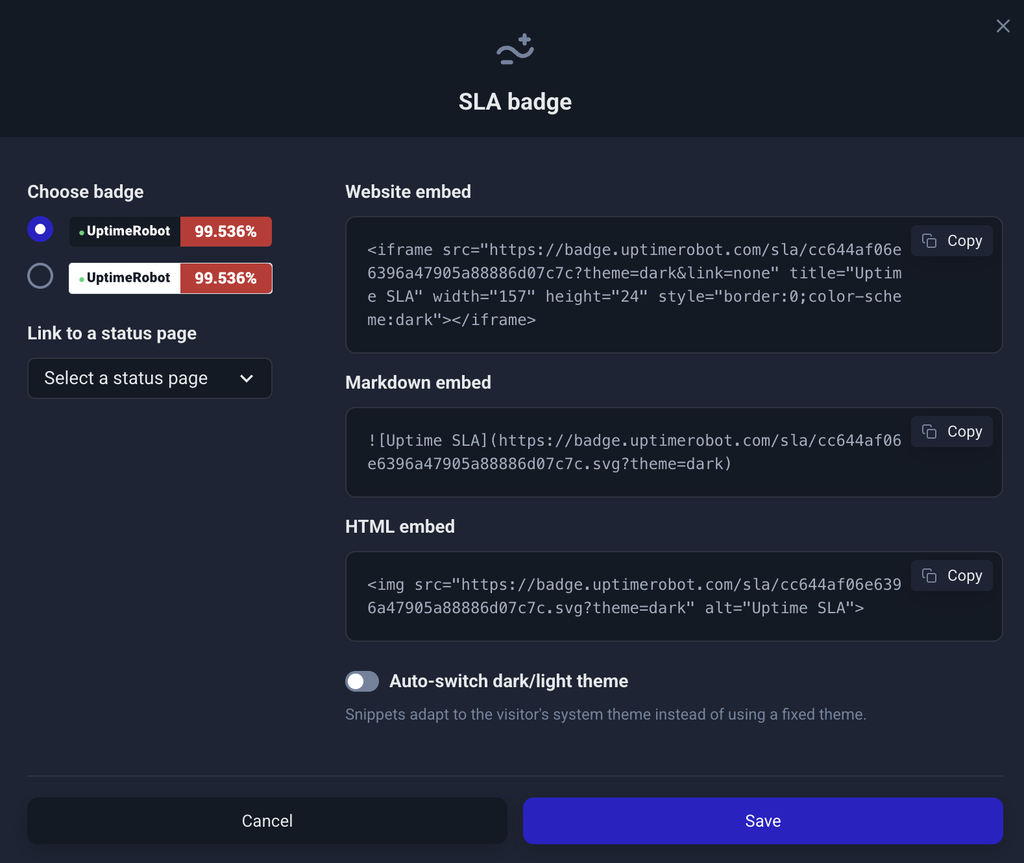
- Choose a badge. Pick the dark or the light version.
- Link it to a status page, if you like. Select one of your status pages, and anyone who clicks the badge lands on it. Without a link, the badge is an image only.
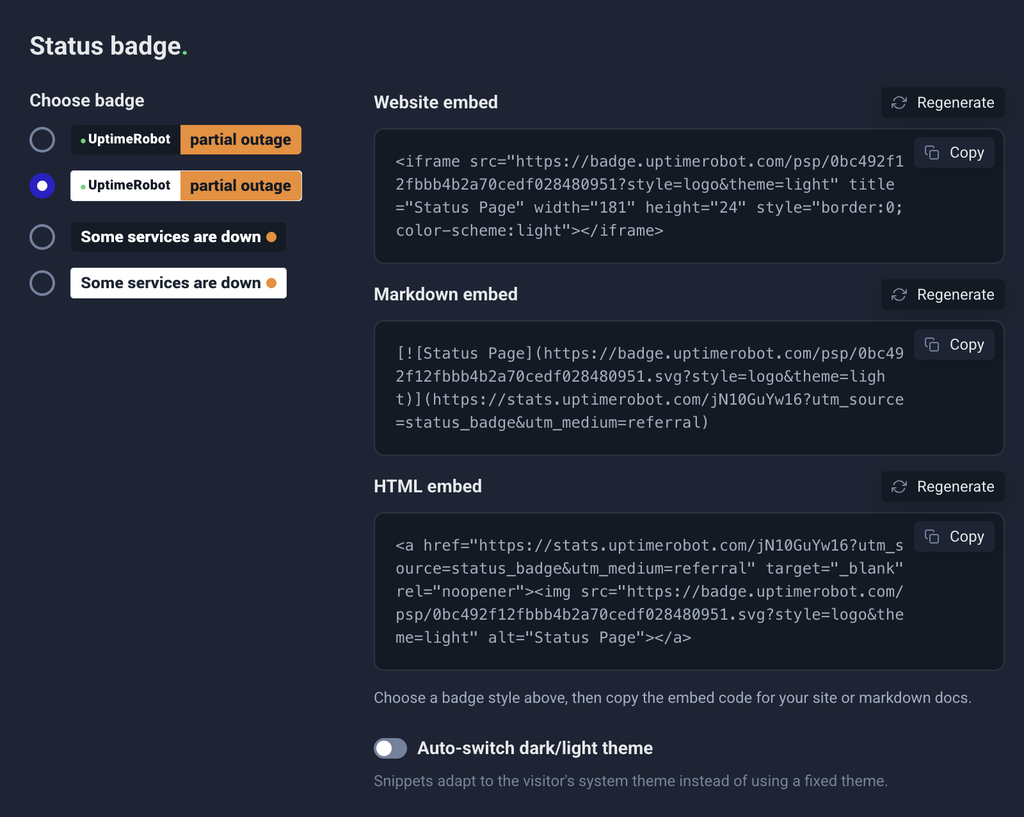
- Copy the embed that fits where the badge is going: Website embed for a web page like your footer, Markdown embed for a GitHub README or docs, or HTML embed for anywhere else that takes HTML.
- Match the theme, if you like. Turn on Auto-switch dark/light theme and the badge follows each visitor’s system setting instead of staying light or dark.
- Click Save.
In a README, the badge is one line next to your build and license badges:

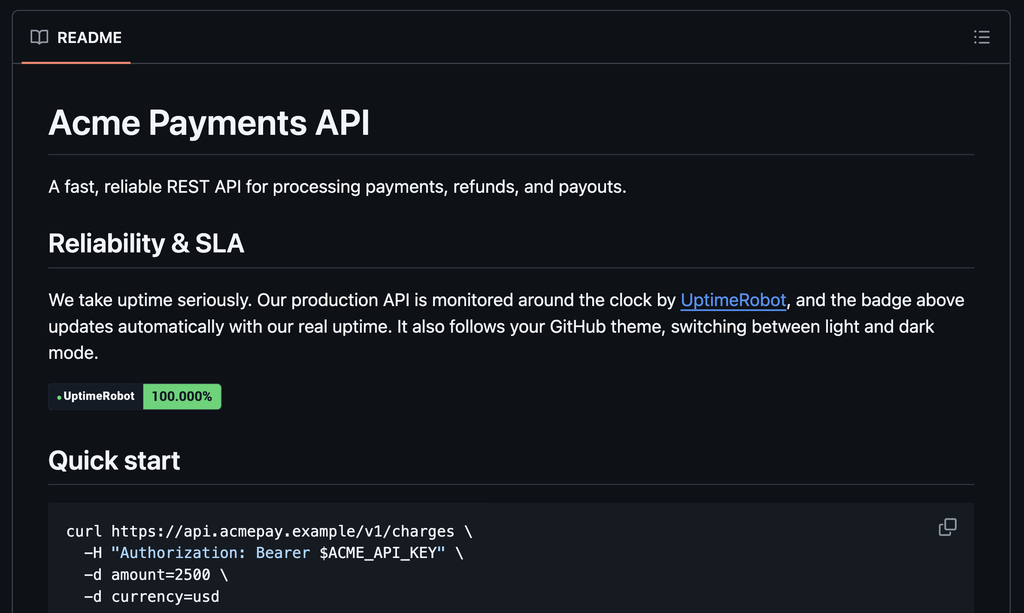
The badge updates every hour, so you paste it once and never need to touch it again.
Get the result in your inbox
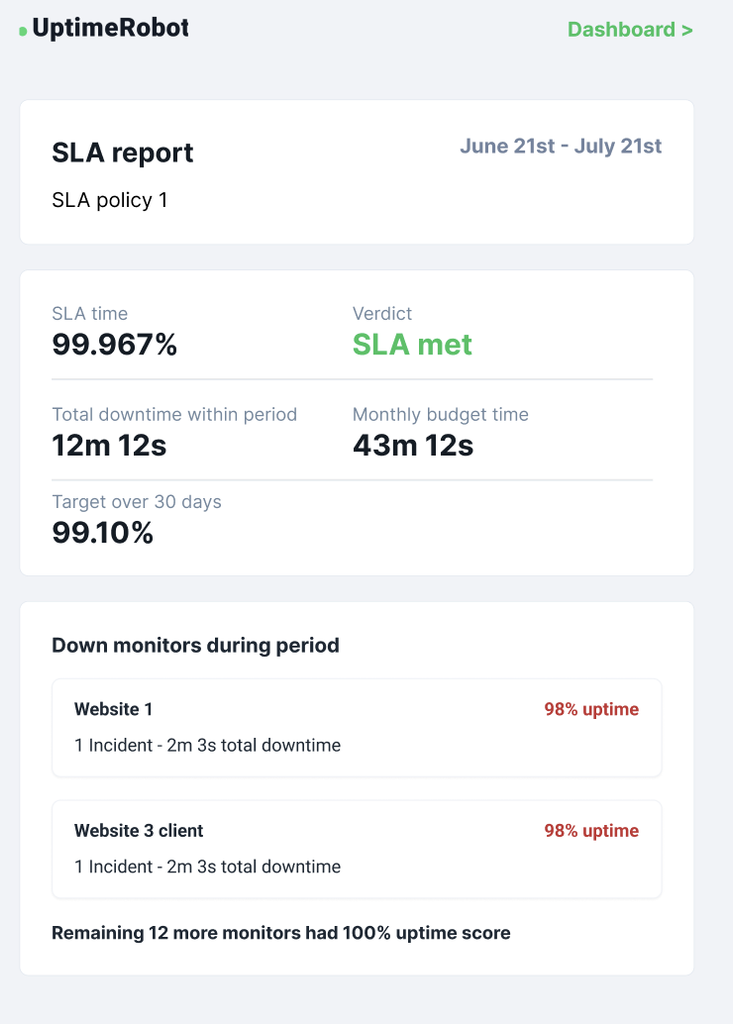
Turn on Email reports in the policy settings, and the account owner gets an SLA email when each period ends. It shows the policy’s uptime and whether you met the target, how much of your downtime budget you used, and every monitor that had downtime, so you can see exactly what cost you. When a client asks how last month went, you can simply forward it.
What counts toward your SLA?
Your policy’s uptime is the average uptime of its monitors over the period. Two things are left out, so the number matches what your customers actually experienced:
- Planned maintenance windows don’t count against your SLA.
- Paused monitors are left out of the result.
For example, if a policy covers six monitors, five at 100% and one at 98%, the policy’s uptime is 99.667%.
One policy per client
If you run monitoring for several clients, a paid plan lets you create a separate SLA policy for each one. Each policy covers its own monitor groups and gets its own badge and its own email report, so every client sees their own number and nobody else’s.
| Free | Paid plans | |
|---|---|---|
| SLA policies | 1 | unlimited |
| What a policy covers | Every monitor in your account | The monitor groups you choose |
| Periods | Calendar month, rolling 30 days | Calendar month and quarter, rolling 30 and 90 days |
| SLA badge | Included | Included |
| SLA email report | Included | Included |
See pricing for what else each plan includes.
Pair it with your status page
An SLA badge answers “how reliable have you been?”. A status page answers “is everything working right now?”.
In the badge settings, you can link your SLA badge to one of your status pages, so anyone who clicks it lands on your live status and incident history.
Your status pages have a badge of their own, too.
Go to Status pages, open any page and select Global Settings. The Status badge section shows the page’s current state, for example “partial outage”, in four styles, with the same Website, Markdown and HTML embeds.
Right below it is the SLA indicator switch, which adds your SLA to the monitor detail view of that status page. That view isn’t on the public status page yet, so for now, the SLA badge is how you show your SLA to visitors.
Create your first SLA policy
Log in, open SLA controls, and set the target you promise. Your badge is ready as soon as you click Create.
-
Not by itself. The color follows your uptime for the whole period, not the current status. A short outage turns the badge yellow or red only if it pushes your uptime for the period below your target or your warning value.
-
No. The UptimeRobot logo shows visitors that your uptime was measured by an independent service trusted by more than 3.4 million users. The logo stays on every plan, and white-label settings on your status pages don’t change that.
-
The badge stays where you put it and shows your real number in yellow or red. It’s never hidden, because a badge that only ever shows green wouldn’t prove anything.
-
Policies cover monitor groups, not single monitors. To include a monitor, add it to a group and choose that group in the policy. On the Free plan, the policy covers every monitor in your account.
-
Not on the public page yet. The SLA indicator switch is already in each status page’s Global Settings, but the view it adds isn’t public yet. For now, link your SLA badge to your status page, so visitors can go from your uptime number to your live status in one click.