A site can load normally in your browser while an uptime monitor reports it as down. That doesn’t necessarily mean either result is wrong.
Your browser and UptimeRobot can reach the same URL using different HTTP methods, IP addresses, user agents and monitoring locations. Caching and security rules can also affect the response. That means choosing the right URL matters just as much as how you configure the monitor.
We’ll take a look at how to choose the right monitoring target, when to use a homepage, health endpoint or API endpoint, and what to check when UptimeRobot sees something different from your browser.
If you already have a monitor showing as down, see the UptimeRobot debugging guide for troubleshooting steps.
Choose the URL based on what you need to know
Your first step is to figure out what information you need most.
A homepage is a good monitoring target when you want to know whether visitors can reach your site. But it may not tell you whether the application behind it is working. A cached page, for example, can remain available while a critical dependency is down.
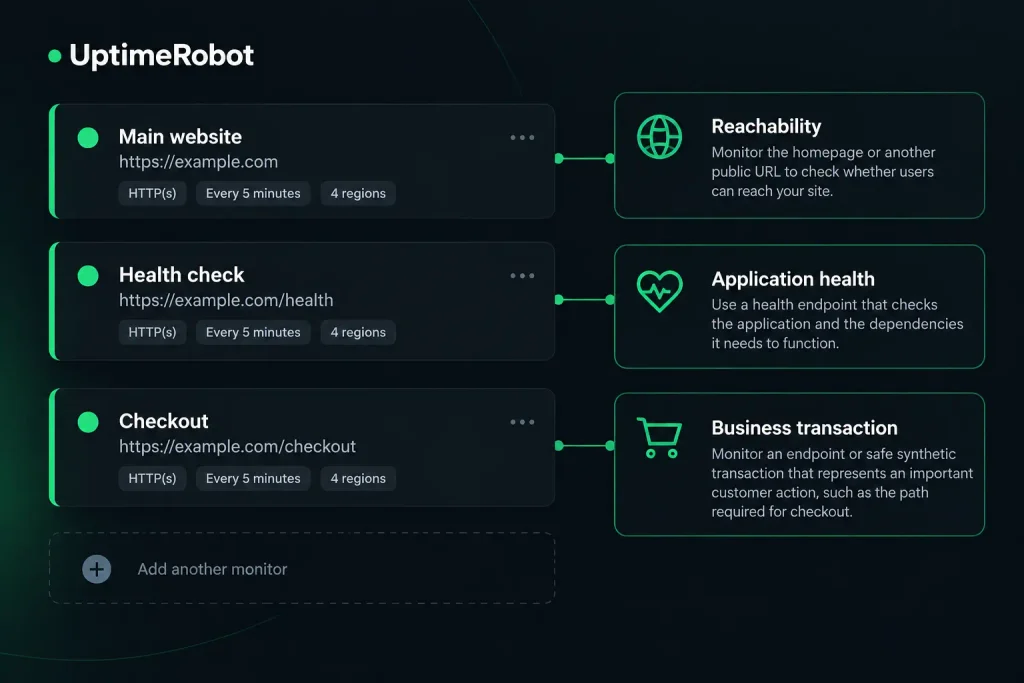
Pick the URL based on the type of failure you need to detect:
- Reachability: Monitor the homepage or another public URL to check whether users can reach the service.
- Application health: Use a health endpoint that checks the application and the dependencies it needs to function.
- Business transaction: Monitor an endpoint or safe synthetic transaction that represents an important customer action, such as the path required for checkout. For an API, choose an endpoint that represents a real customer-facing function instead of the base URL unless the base URL itself is meaningful.
You may need more than one monitor if these signals matter independently. Any synthetic transaction should also be safe to repeat without creating orders, charging cards or changing production data.
If application health is one of those signals, the next step is choosing what your health endpoint should actually check.
What makes a good health endpoint?
A health endpoint should check whether the service and its critical dependencies are working.
For example, a database-backed application could perform a lightweight database operation as part of the check. Optional dependencies can be monitored separately if their failure doesn’t make the service unavailable.
A few things make the endpoint more useful for monitoring:
- Return a meaningful HTTP status: A common pattern is 200 when healthy and 503 when the service is unavailable or not ready. Avoid returning 200 for a failed health check just because the response body contains an error.
- Keep the check lightweight and current: Dependency checks should have short internal timeouts, and appropriate cache-control headers such as Cache-Control: no-store can prevent stale health responses.
- Validate the response when status alone isn’t enough: UptimeRobot API Monitoring can check specific JSON fields and values and combine assertions using AND or OR logic. Keyword monitoring can also inspect response content.
- Keep sensitive information out of the response: Don’t expose credentials, stack traces, internal hostnames, environment variables or unnecessary infrastructure details. Protected endpoints can use supported authentication options or custom headers.
Once you’ve chosen the URL to monitor, the request itself needs to match how that endpoint is designed to respond.
Choose the right HTTP method
To change the HTTP method for an existing monitor, log in to UptimeRobot and select Monitoring from the left sidebar. Open the HTTP/S monitor you want to change, click Edit in the upper right corner, scroll down and expand Advanced Settings, then find HTTP Method and choose the method you want to use.
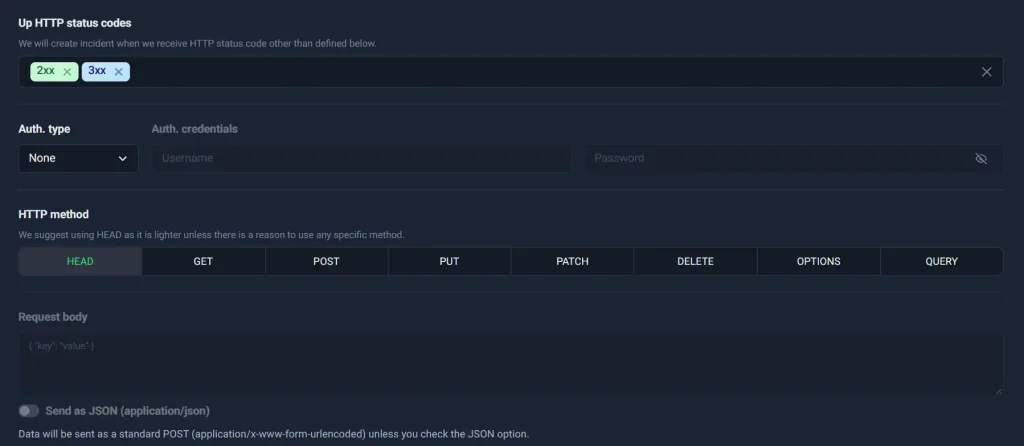
UptimeRobot HTTP monitors use HEAD by default, but GET might be the better choice depending on what you need to check.
| HEAD | GET | |
| What it checks | Response status and headers without downloading the response body | Response status, headers and body |
| Use it when | You only need to confirm that the URL responds as expected | You need to inspect content or validate data in the response |
| Good for | Basic availability checks | Keyword monitoring, JSON/API assertions and other checks that depend on the response body |
| Watch for | Some servers, CDNs or security rules don’t handle HEAD correctly | Downloads the response body, so it does more work than HEAD |
If a HEAD request fails, UptimeRobot can retry using GET. If the server consistently rejects HEAD, set the monitor to GET explicitly instead.
UptimeRobot also supports POST, PUT, PATCH, DELETE, QUERY and OPTIONS for endpoints that require them. API requests can include request bodies and custom headers where needed.
Use the method the endpoint expects and that gives you the response you actually need to validate.
Monitor the canonical URL
For your primary availability check, monitor the URL you actually expect visitors to reach, including the correct scheme, hostname and path.
For example, if http://example.com redirects to https://www.example.com, monitoring the final HTTPS URL gives you a direct check of the destination. If you monitor the redirecting URL with Follow Redirections enabled in Advanced Settings, UptimeRobot follows the redirect and checks the destination as part of the same request path.
If the redirect itself is important, monitor it separately with Follow Redirections disabled. You can then use Up HTTP Status Codes to define which response counts as Up. By default, UptimeRobot treats 2xx and 3xx responses as Up.
Even with the right URL and request settings, UptimeRobot may sometimes get a different response than you see in your browser.
When UptimeRobot sees something different from your browser
Even when you’re monitoring the right URL, the request may take a different path or be treated differently from a request made in your browser.
If the site works for you but UptimeRobot reports it as down, check the security rules and monitoring location before changing the monitor itself.
Check whether security tools are blocking the monitor
If your site uses a CDN or web application firewall (WAF), such as Cloudflare, Akamai or Fastly, it may treat an UptimeRobot check differently from a visit in your browser. The site can therefore work normally for you while the monitoring request is blocked or challenged.
If that happens, check two things:
- Monitoring IPs. Your firewall, CDN or other security tool may be blocking the IP address the check comes from. If your setup requires an allowlist, use UptimeRobot’s current Locations & IPs source rather than saving a static list that can become outdated.
- User agent. Security tools can also identify and filter automated requests based on their user agent. Check that UptimeRobot’s user agent isn’t being blocked, rate-limited or sent a CAPTCHA or bot challenge.
Check the monitoring region
A site can work normally in one part of the world while failing in another. Regional routing problems, CDN issues, geo-blocking or security rules can all affect what UptimeRobot sees from a particular monitoring location.
UptimeRobot checks from North America, Europe, Asia and Oceania (Australia). If a check fails, the failure is confirmed within that same region before the monitor is marked Down. Multiple regions don’t need to report the same failure.
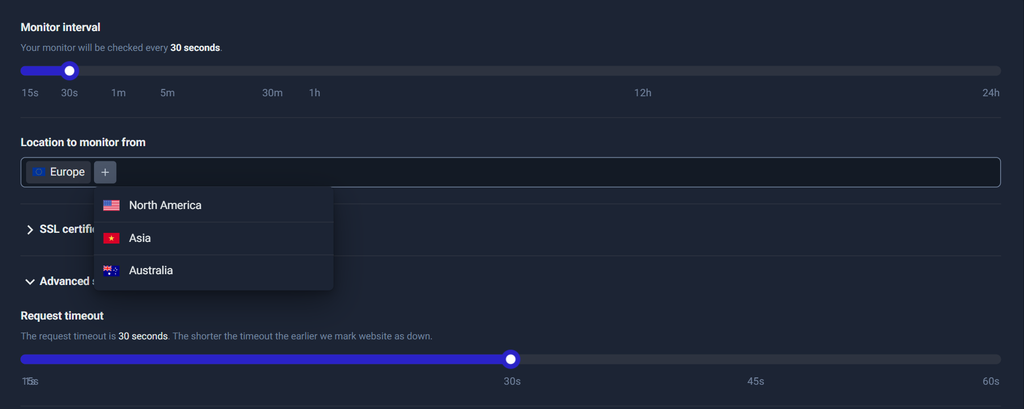
If a monitor reports a problem that you can’t reproduce, check the incident details to see which region reported it. A failure limited to one region can point to a regional issue rather than a site-wide outage.
The right monitoring setup should give you a clear signal when something users depend on stops working.
Start with the URL that best represents that failure, then configure the request to match how the endpoint is meant to respond. If the results don’t match what you see in your browser, check the request path, security rules and monitoring region before changing the target.
The checklist
- Choose the right target. Monitor the URL that represents the failure you actually need to detect.
- Use the canonical URL for your primary availability check. Monitor redirects separately if they matter.
- Keep health checks meaningful. Check critical dependencies, return an appropriate HTTP status and prevent cached responses from hiding a failure.
- Use the right HTTP method. HEAD works for basic availability checks. Use GET when you need the response body or the server doesn’t handle HEAD correctly.
- Validate more than the status code when needed. Use keyword or API monitoring when the response content determines whether the service is actually working.
- Keep health responses safe. Don’t expose credentials or unnecessary internal information.
- Check security rules. Make sure your firewall, CDN, WAF or bot protection isn’t blocking UptimeRobot’s monitoring IPs or user agent.
- Check the monitoring region. If a failure only appears from one location, investigate regional routing, CDN or security issues.
A monitor is most useful when an alert tells you something you actually need to act on. Choose the target and settings around that signal, and you’ll spend less time investigating alerts that don’t reflect the failure you intended to monitor.
-
The request is different. Common causes include a HEAD-versus-GET difference, blocked monitoring IPs, a WAF or bot-protection challenge, or a regional routing or geo-blocking rule. Check the incident details and the monitoring region first.
-
Use the target that answers the operational question you care about. The homepage is useful for basic reachability. A health endpoint can tell you whether the application and its critical dependencies are functioning. A business-transaction endpoint can tell you whether the customer action that matters is working. Those checks can coexist.
-
Neither is universally better. HEAD is the default for HTTP monitoring and avoids downloading a response body. GET is appropriate when the server does not handle HEAD correctly or when you need to inspect the body, such as with keyword or API validation.
-
A common pattern is an HTTP 200 response with a small structured payload when healthy and HTTP 503 when the service is unavailable or not ready. Check the dependencies that are genuinely required for the service to function, and keep the response free of sensitive information.
-
Not necessarily. If monitoring works normally, you do not need to change anything. If UptimeRobot requests are being blocked, allowlist the current monitoring IPs in the relevant firewall, WAF, CDN, or hosting security layer. Also check whether bot protection is challenging UptimeRobot’s user agent.
-
UptimeRobot checks selected regions in rotation, and a failed check is confirmed within that same region. A regional security, routing, CDN, or availability problem can therefore produce a real Down event even when the site is working from other parts of the world.
-
Use UptimeRobot API Monitoring. It can assert values in JSON responses, response headers, status codes, or raw response bodies. This lets you monitor the meaning of the response, not just whether the server answered.