Server monitoring tools watch the signals that matter, like CPU load, memory pressure, disk saturation, network throughput, and log output. They alert your team before those signals become incidents.
Choosing the right server monitoring software is harder than it looks, though.
The market is crowded, pricing models vary wildly, and the right tool for a three-person startup is rarely the right tool for an enterprise running hybrid infrastructure across a hundred nodes.
Our guide covers the key criteria to consider and highlights the server monitoring tools that stand out the most. In a hurry? Get the need-to-know from the table below.
| Tool | Best for | Starting price | Core strength | Free plan / Open source |
|---|---|---|---|---|
| UptimeRobot | External monitoring | Free; paid from $8/mo (annual) | External uptime monitoring, status pages, and alerting | Free plan |
| NinjaOne | MSPs and IT teams | Custom | Endpoint management and server monitoring | Free trial |
| ManageEngine OpManager | Enterprise IT infrastructure | Custom | Server, network, and infrastructure monitoring | Free edition available |
| PRTG Network Monitor | Windows environments | Free; paid from 500 sensors | Sensor-based infrastructure monitoring | Free (100 sensors) |
| Prometheus + Grafana | Kubernetes and cloud-native environments | Free | Open-source metrics monitoring and visualization | Open source |
| Checkmk | Large-scale infrastructure | Free Community edition | Auto-discovery and scalable monitoring | Open source / Free Community |
| Icinga | Infrastructure as code | Free | Highly customizable open-source monitoring | Open source |
| Datadog | Full-stack observability | Free tier; paid plans available | Metrics, logs, traces, and APM in one platform | Free tier |
| Dynatrace | Enterprise observability | Custom | AI-assisted monitoring and root cause analysis | Free trial |
| Sentry | Application monitoring | Free; paid plans available | Error tracking and application performance monitoring | Free plan |
Key takeaways
- UptimeRobot is best used alongside infrastructure monitoring tools to validate uptime and availability from an external perspective.
- NinjaOne, ManageEngine OpManager, and PRTG Network Monitor provide broad infrastructure monitoring capabilities for IT teams managing servers, endpoints, and network devices.
- Icinga, Checkmk, and Prometheus remain popular open-source options for teams that want flexibility and control over their monitoring stack.
- Dynatrace, Datadog, and Sentry extend beyond traditional server monitoring with observability, AI-assisted diagnostics, and application-level insights.
- The best server monitoring platform depends on your infrastructure, operational resources, and growth plans rather than the size of its feature list.
Before comparing specific platforms, it helps to understand the criteria that separate a good monitoring solution from a great one.
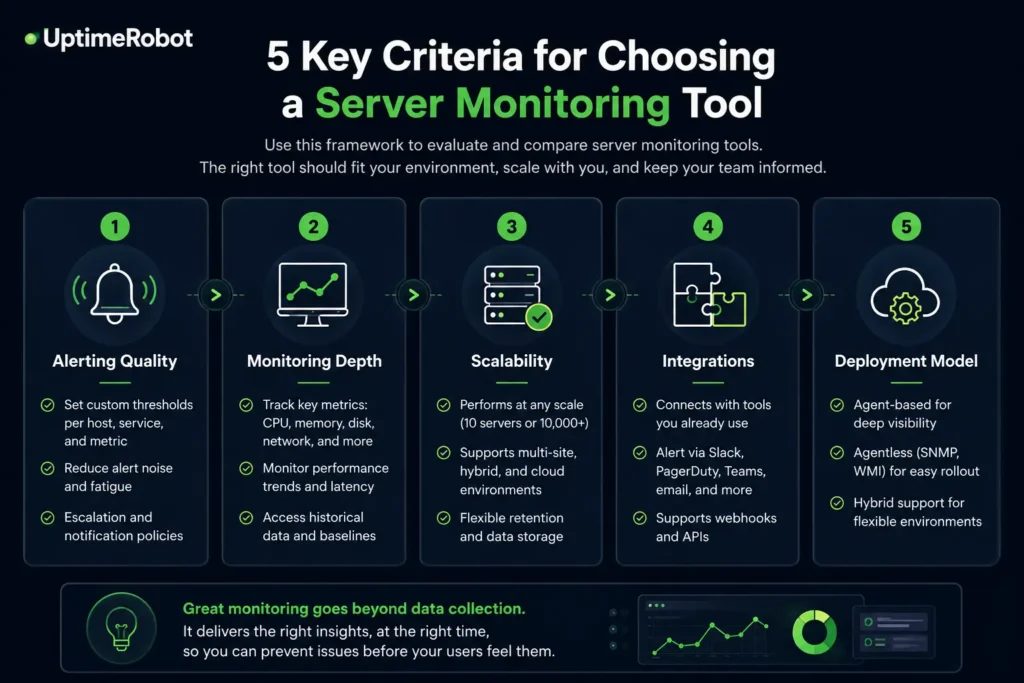
5 key criteria for choosing a server monitoring tool

Enterprise and IT management platforms
Enterprise monitoring platforms are built for organizations that need visibility across servers, endpoints, network devices, and other infrastructure from a single dashboard.
Many also include automation, remote management, and asset discovery features that make them particularly useful for IT operations teams and managed service providers (MSPs).
NinjaOne
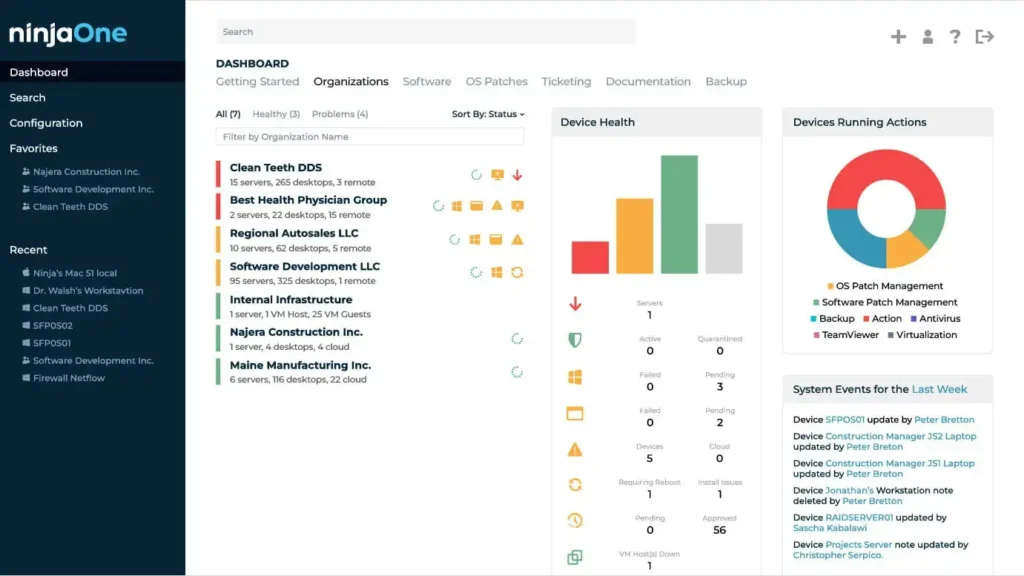
Source: NinjaOne dashboard example
NinjaOne is designed for managed service providers and in-house IT teams that need remote monitoring, endpoint management, and automated remediation in one platform.
For MSPs evaluating remote server monitoring software, it’s one of the more practical options, with built-in remote desktop access and remediation scripts that make real-time response possible without switching between tools.
It’s not built for deep APM or DevOps monitoring strategies, so it won’t replace Prometheus or Datadog in a cloud-native environment.
Pricing: 14 day free trial, pricing available only by request.
| Pros | Cons |
|---|---|
| Built-in remote desktop and remediation scripts | Not designed for APM or DevOps workflows |
| Strong fit for MSP operational workflows | Limited infrastructure metrics depth |
| Integrated endpoint management | Not cloud-native focused |
ManageEngine OpManager
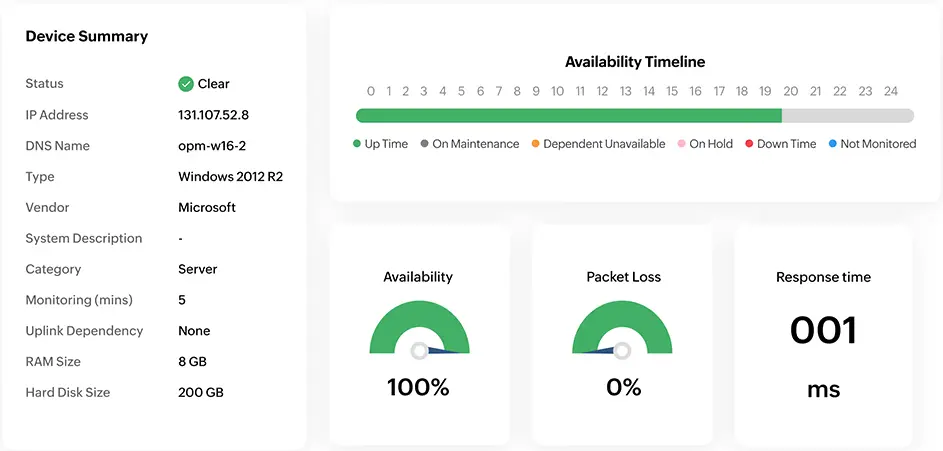
Source: ManageEngine OpManager dashboard example
OpManager uses perpetual licensing rather than subscription pricing, which appeals to organizations that prefer capital expenditure over ongoing subscription costs.
Built-in network topology maps and business-hours-aware alerting are practical features for IT operations teams. Cloud infrastructure monitoring requires the OpManager Plus edition, which is something to verify before purchasing the base product.
Pricing: Pricing available by request only.
| Pros | Cons |
|---|---|
| Perpetual licensing option | Cloud monitoring requires OpManager Plus |
| Built-in network topology maps | Less suited to cloud-native environments |
| Business-hours-aware alerting | Not as feature-rich as Datadog or Dynatrace |
PRTG Network Monitor
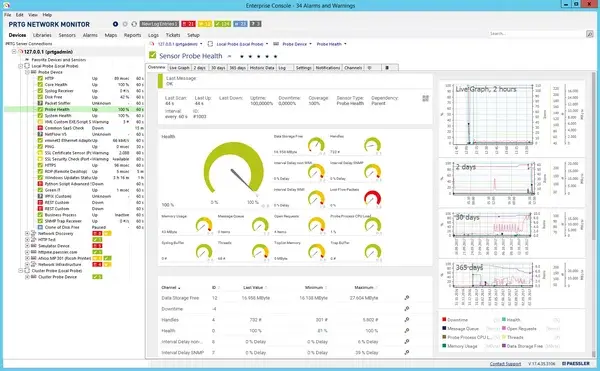
Source: PRTG Network Monitor dashboard example
PRTG uses a sensor-based licensing model where a single license covers SNMP, WMI, flow analysis, and REST API monitoring. It gives a straightforward way to monitor servers, network devices, and applications without purchasing separate modules.
Teams looking for server monitoring tools for Windows environments will find PRTG particularly well-suited for the job. Its WMI-based collection is first-class, and the interface is designed with Windows IT administrators in mind.
As Windows server monitoring software goes, PRTG is one of the more complete options for organizations that are primarily Microsoft-stack shops.
Pricing: PRTG includes a free version for up to 100 sensors. Paid plans start at $200/month and scale based on the number of sensors monitored.
| Pros | Cons |
|---|---|
| Single sensor-based license covers multiple protocols | Windows-centric; less suited for Linux-heavy or cloud-native stacks |
| No separate modules for network vs. server monitoring | Not designed for deep APM or Kubernetes monitoring |
| Intuitive interface for Windows IT environments | Sensor count limits require licensing upgrades |
Open-source and highly scalable monitoring tools
Prometheus, Checkmk, and Icinga are among the most widely used open-source monitoring platforms available today.
Each takes a different approach to monitoring, but all three offer the flexibility and control that many engineering and operations teams value in self-managed environments.
Prometheus (with Grafana)
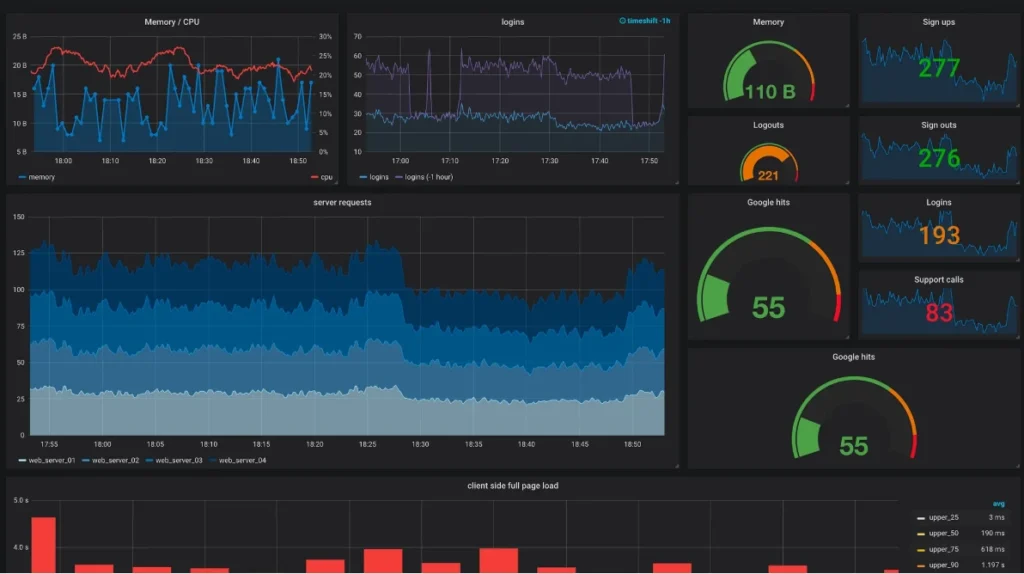
Source: Prometheus + Grafana dashboard example
Prometheus is most commonly associated with Kubernetes and cloud-native infrastructure. Its flexibility, large ecosystem, and powerful query language have made it a standard choice for organizations running containers, microservices, and modern distributed applications.
A large collection of exporters allows Prometheus to collect metrics from operating systems, databases, hardware, cloud services, and applications. Grafana is often used alongside Prometheus to visualize those metrics through dashboards and reports, making a monitoring stack that can scale from small deployments to large enterprise environments.
Prometheus requires more setup and ongoing management than most SaaS alternatives, and many teams add tools such as Thanos or Mimir for long-term metric storage.
It also focuses primarily on metrics, so organizations that need log management and distributed tracing typically integrate additional tools into their observability stack.
Pricing: Prometheus is free and open source, though infrastructure and storage costs increase as deployments grow.
| Pros | Cons |
|---|---|
| De facto standard for Kubernetes | 15-day default retention requires external storage |
| Powerful PromQL query language | Metrics only. No built-in logs or traces |
| Large exporter ecosystem | High-availability setup requires operational effort |
| No licensing cost | Grafana needed separately for dashboards |
Checkmk
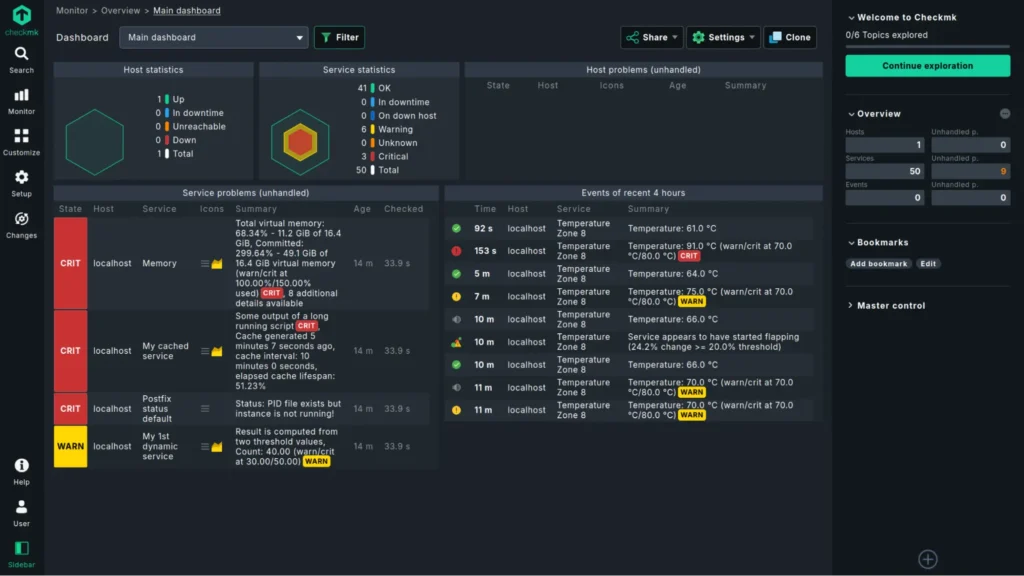
Source: Checkmk dashboard example
Checkmk is known for its auto-discovery capabilities, which automatically identify hosts, services, and devices as they are added to an environment.
The platform supports servers, network devices, applications, cloud resources, and containers, while the commercial Agent Bakery simplifies large-scale agent deployment and management.
Its service-based licensing model can also be more predictable than per-host pricing, particularly in larger environments.
Checkmk is a strong choice for organizations that need to monitor hundreds or thousands of systems across data centers, cloud environments, or hybrid infrastructure without spending excessive time on configuration.
Pricing: The Community edition is free. Commercial plans start at $275/month vary based on the number of monitored services and support requirements.
| Pros | Cons |
|---|---|
| Auto-discovery configures new hosts automatically | Community edition capped at ~100 hosts |
| Agent Bakery simplifies fleet deployment | Requires operational expertise at scale |
| Service-based pricing is relatively transparent | Less suited to Kubernetes-native workflows |
| Active development and support ecosystem | UI has a learning curve |
Icinga
Source: Icinga dashboard example
Icinga started as a fork of Nagios but is now a complete rewrite. The Icinga DSL is version-controllable and CI/CD-deployable, which makes it a natural fit for teams that manage configuration through code.
Icinga Director provides a web UI for teams that don’t want to edit config files by hand. Clustering support handles distributed environments, and the plugin ecosystem is compatible with Nagios plugins.
Pricing: Free and open-source. However, Access to official packages for RHEL, Amazon Linux 2, and SUSE Linux Enterprise Server requires a repository subscription
| Pros | Cons |
|---|---|
| Version-controllable DSL for config | RHEL/SLES packages require a repository subscription |
| Nagios plugin compatibility | Smaller community than Nagios or Prometheus |
| Clustering for distributed environments | Requires technical expertise to operate well |
| Icinga Director GUI reduces manual config work | No integrated AI features |
Best observability platforms
Server monitoring tools show what is happening across your infrastructure. Observability platforms go a step further by connecting metrics, logs, traces, and application performance data to provide a more complete picture of system health.
They shine in cloud-native environments where identifying the root cause of an issue can require visibility across multiple services and dependencies.
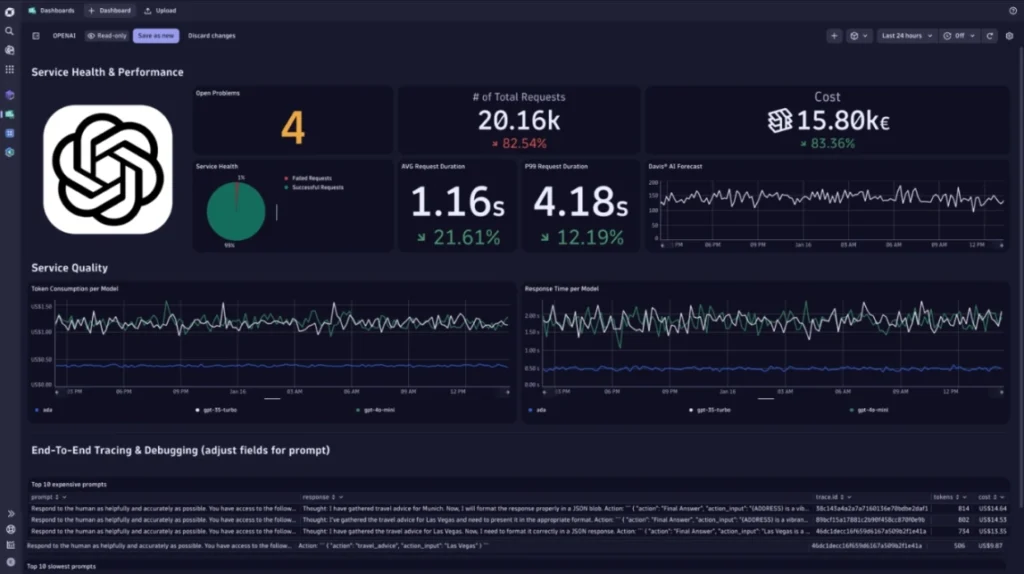
Datadog
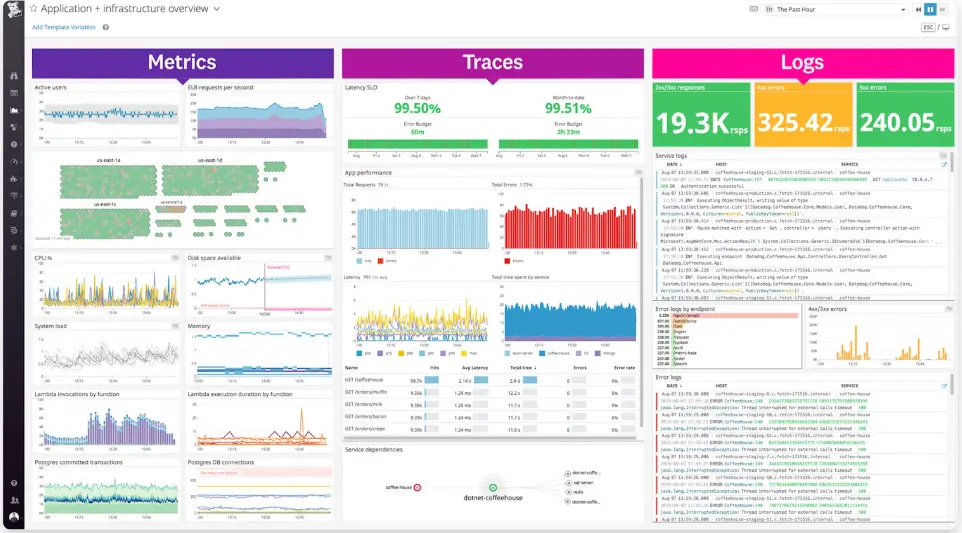
Source: Datadog dashboard example
Datadog combines infrastructure monitoring, APM, logs, traces, and synthetic monitoring in a single platform. Its extensive integration library and feature set make it a popular choice for teams that want visibility across applications, servers, and services without stitching together multiple tools.
Watchdog AI automatically surfaces anomalies and helps teams investigate issues faster, while built-in support for logs, metrics, and traces simplifies troubleshooting.
Pricing: Free tier available. Paid plans vary based on products, usage, and monitored hosts.
| Pros | Cons |
|---|---|
| Unified metrics, APM, logs, and synthetics | Per-host plus per-module billing escalates at scale |
| 850+ integrations with minimal setup | Can become one of the more expensive options |
| Watchdog AI for automated anomaly surfacing | Requires cost discipline as usage grows |
| Strong SaaS convenience and support | Vendor lock-in risk over time |
Dynatrace
Source: Dynatrace dashboard example
Dynatrace is built for organizations that need visibility across large, complex environments. Its OneAgent automatically discovers applications, services, processes, and dependencies, cutting the amount of manual setup required compared to many other monitoring platforms.
The platform’s Davis AI decreases alert fatigue by grouping related issues into a single incident rather than generating multiple notifications for the same underlying problem. It can also adapt thresholds based on historical behavior, making it easier to spot unusual activity without constant tuning.
Dynatrace is one of the more expensive options in this category and may be more than smaller teams need. For larger organizations, however, its automated discovery, dependency mapping, and AI-assisted troubleshooting can shrink operational overhead.
Pricing: Dynatrace uses custom pricing based on the capabilities and infrastructure being monitored.
| Pros | Cons |
|---|---|
| OneAgent auto-discovers processes and dependencies | Highest cost at scale |
| Davis AI reduces noise to single problem cards | Can be excessive for small or simple environments |
| Multiple anomaly detection modes (static, adaptive, seasonal) | Platform complexity has a learning curve |
| Strong compliance and enterprise support | Less flexible than open-source alternatives |
Sentry
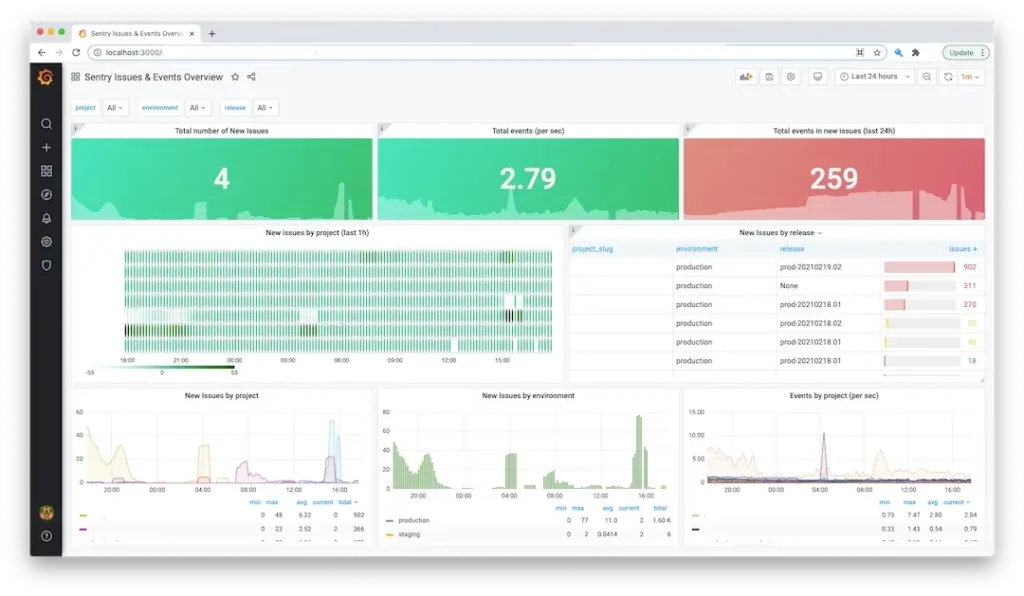
Source: Sentry + Grafana dashboard example
Sentry focuses on application monitoring, error tracking, and performance monitoring rather than traditional server metrics. Development teams use it to identify bugs, investigate application issues, and understand how errors affect real users.
The platform provides detailed context around errors, including stack traces, release information, and performance data, making it easier to troubleshoot problems and prioritize fixes. Support for a wide range of programming languages and frameworks has made Sentry a popular choice for web, mobile, and cloud applications.
Sentry works best alongside infrastructure monitoring tools rather than as a replacement for them. While it excels at application-level visibility, it offers less insight into server health and infrastructure performance than platforms like Datadog or Dynatrace.
Pricing: Sentry offers a free plan, with paid plans starting at $26/month and scaling based on usage and event volume.
| Pros | Cons |
| Excellent error tracking and debugging tools | Not focused on infrastructure monitoring |
| Detailed stack traces and performance insights | Limited server and network visibility |
| Supports a wide range of languages and frameworks | Best used alongside a dedicated monitoring platform |
| Free plan available | Costs increase with event volume |
How to choose the right server monitoring tool
The best server monitoring tool depends less on feature count and more on how well it matches your environment.
Start by considering what you actually need to monitor. Teams running cloud-native applications may benefit from observability platforms like Datadog or Dynatrace, while organizations focused on infrastructure visibility may find tools like PRTG, ManageEngine OpManager, or Checkmk a better fit.
It’s also worth thinking about operational overhead. Open-source platforms such as Prometheus, Icinga, and Checkmk offer flexibility and control, but they require more hands-on management than SaaS alternatives. Managed platforms reduce maintenance requirements but typically come with higher licensing costs.
Finally, don’t overlook the difference between internal and external monitoring. Infrastructure monitoring shows what’s happening inside your environment, while external monitoring confirms whether users can actually access your services.
Many organizations use both approaches together to gain a more complete view of system health.
UptimeRobot: Your external monitoring companion
Most server monitoring platforms focus on what is happening inside your infrastructure. UptimeRobot works alongside infrastructure monitoring platforms by verifying availability from outside your network and confirming that users can actually reach your services.
Key features:
- HTTP(S), ping, port, DNS, SSL certificate, keyword, and heartbeat monitoring
- Global monitoring locations for external availability checks
- Public status pages for incident communication
- Response time monitoring and performance tracking
- Integrations with Slack, Microsoft Teams, PagerDuty, webhooks, and more
- Free plan: 50 monitors with 5-minute checks
- Solo plan: Starts at $8/month (annual billing)
- Team and Enterprise plans available for larger organizations
Unlike traditional server monitoring platforms, UptimeRobot is designed to work alongside tools like Prometheus, PRTG, Datadog, and Dynatrace. It gives you an external view of service health, helping teams validate uptime and availability from the user’s perspective.
Sign up for a free account today (no credit card required) to start monitoring in just a few clicks.
-
The best server monitoring tool depends on your environment and requirements. Prometheus is a popular choice for Kubernetes and cloud-native infrastructure, while Datadog and Dynatrace provide broader observability capabilities. Organizations focused on IT operations may prefer platforms like PRTG Network Monitor or ManageEngine OpManager, while UptimeRobot complements these tools with external uptime monitoring.
-
Server monitoring focuses on infrastructure metrics such as CPU, memory, disk usage, and network performance. Observability platforms build on those metrics by combining logs, traces, and application performance data, making it easier to investigate issues across complex systems and distributed applications.
-
Many organizations use both. Internal monitoring provides visibility into server and infrastructure health, while external monitoring validates that websites, APIs, and services are actually available to users. Together, they provide a more complete picture of system health and help teams identify issues faster.