While monitoring five websites is simple, monitoring five hundred or more endpoints across a team is a different discipline. The questions stop being “is my site up” and start being “who gets paged, who can change things, how do we prove uptime to a client, and how do we choose the right plan as we grow.”
The patterns below are the ones that come up most often in UptimeRobot support and sales conversations as accounts grow.
The scaling questions we hear most
The recurring themes as accounts grow cluster in a predictable set of areas:
- How do we route alerts to the right people?
- Who needs a login, and who only needs notifications?
- How do we manage status pages, reporting, exports, and IP allowlisting across multiple environments?
- How should we plan pricing as monitor counts and team size grow?
Let’s take a look at each.
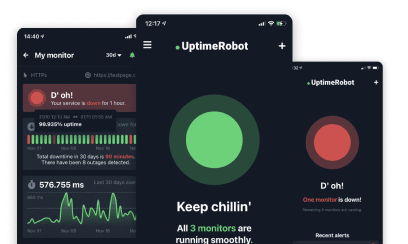
Routing alerts to the right people
UptimeRobot gives you fine-grained control. Alert contacts are attached to the specific monitors they should cover and configured for the events that matter, so you decide exactly who hears about what.
The setup habit worth adopting at scale is to attach the right contacts as part of creating each monitor, so every new service is wired into your alerting from the moment it goes live.
That per-monitor control is what makes precise routing possible. You can send production-critical monitors to a PagerDuty rotation while lower-severity ones post to a Slack channel, keeping each alert meaningful to the people who receive it.
UptimeRobot has many integrations, including with Slack, Microsoft Teams, and PagerDuty alongside email, SMS, voice, and webhooks, giving you plenty of room to design routing that matches how your team actually responds. For SMS and voice, keeping a healthy credit balance ensures those channels are always ready when you need them. You can also use our mobile app for real-time alerts right in your pocket.
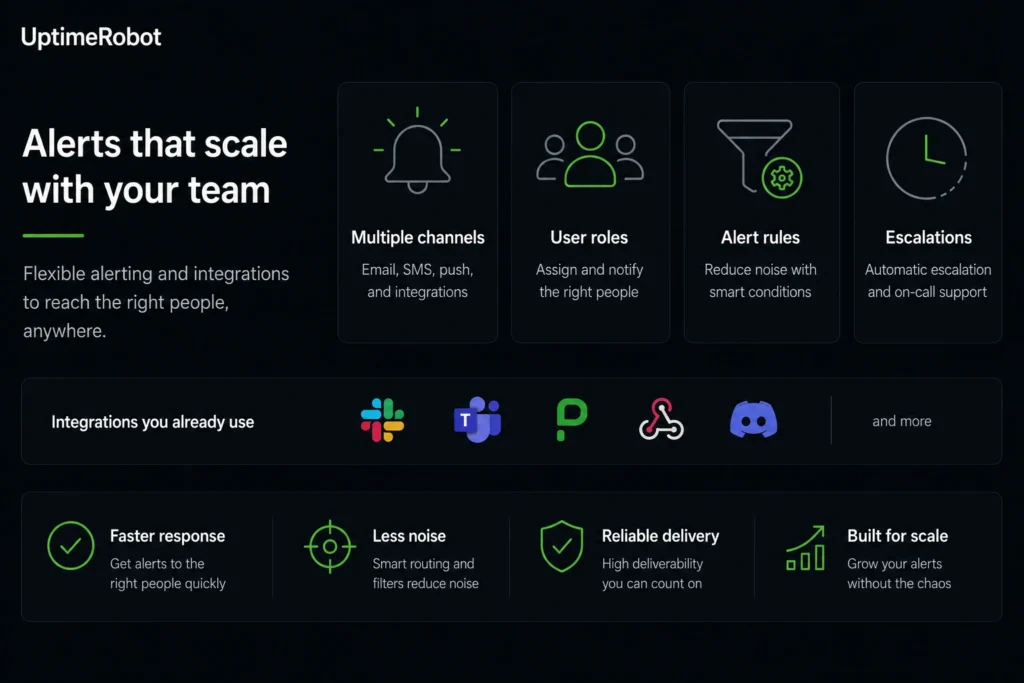
Get alerts to the right audience
Seats and ownership: who can do what
UptimeRobot distinguishes between team members who can log in and manage monitors and notify-only contacts who only receive alerts.
As your team grows, that distinction becomes more important. On-call responders may only need notifications, while a smaller group manages the account. Limiting login access to people who actually need it reduces both the risk of accidental changes and your seat costs.
It’s also a good idea to keep ownership with the team rather than any one individual. Use a role or shared account where appropriate, keep more than one administrator, and remove seats when people leave.
Setting this up early keeps ownership clear and makes account management much simpler as the team grows.
Grouping and bulk management
Once you have hundreds of monitors, organizing them well is what keeps everything manageable. UptimeRobot supports tags for grouping and bulk actions to edit, tag, pause, or set notifications across many monitors at once.
Grouping by client, environment, service, or criticality gives you a way to filter the dashboard, drive status pages, and apply changes to a whole set in one move.
Tag along the lines you’ll actually want to filter and report by later. If you bill clients, a per-client tag pays for itself the first time you need a client-specific status page or report. If you run multiple environments, tagging production separately from staging lets you route and escalate them differently.
Decide this while you have tens of monitors, not thousands, to avoid a painful retroactive cleanup.
Status pages as external communication
At larger scale a status page becomes a workload-reducer and a trust-builder. A public page gives customers a place to self-check instead of opening tickets, and gives support, CS, and sales one reliable link to share, keeping messaging consistent when something breaks. Many teams run both public pages for customers and private pages for internal visibility.
You choose which monitors appear (individually or in bulk), brand the page with your logo, colors, and layout, and host it on your own domain such as status.example.com by pointing a CNAME record at UptimeRobot’s status page host.
The custom-domain setup involves a DNS record and SSL issuance, so it’s worth configuring ahead of when you need it. See the full capabilities on the UptimeRobot status page overview.
Reporting and exports for SLAs and audits
As your monitoring footprint grows, reporting becomes just as important as real-time alerts. Clients, auditors, and procurement teams often want evidence of uptime and incident history rather than a live dashboard.
UptimeRobot provides several ways to access that data, including the dashboard, scheduled email reports, and an API for programmatic exports and custom reporting. Together, these options make it easier to produce the records needed for SLA reviews, audits, or vendor assessments.
It’s worth deciding on your reporting process before you need it. If you provide clients with regular uptime reports, choose the approach that best fits your workflow. If you need incident history for compliance or audits, check your plan’s data retention period so you know what information will be available.
Vendor reviews increasingly extend beyond uptime data. Enterprise and public-sector buyers may also request documents such as SOC 2 reports, DPAs, or completed security questionnaires, so knowing where to find them can make procurement much smoother.
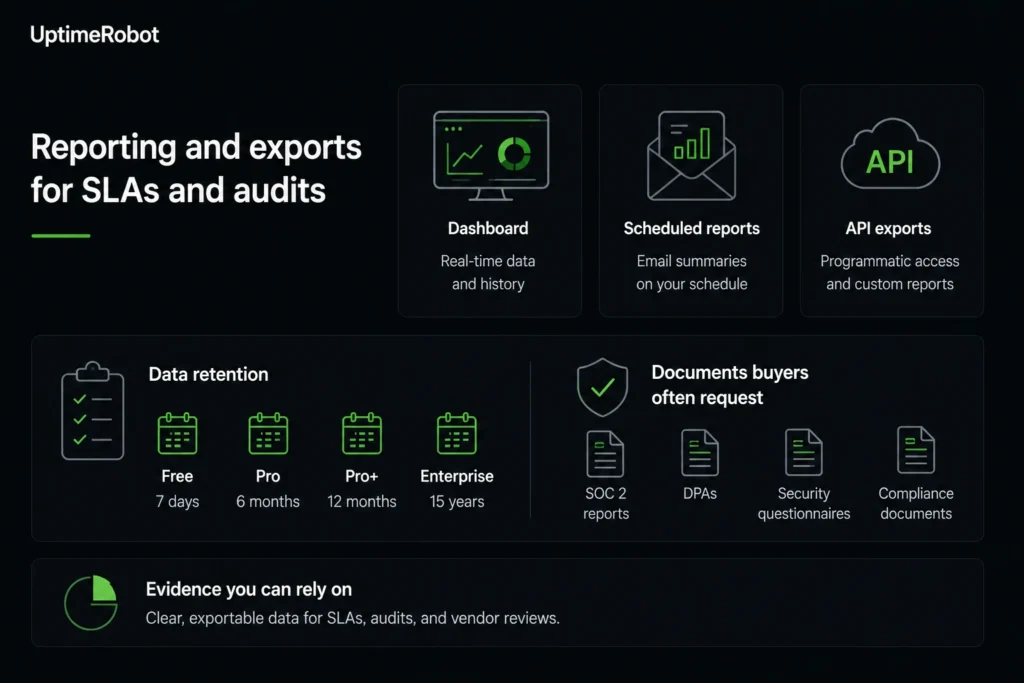
Reporting and exports
Allowlisting across many environments
Automated monitoring works by sending checks to your endpoints from UptimeRobot’s servers, and to keep those checks flowing, the monitoring traffic needs to be allowed through your defenses.
Firewalls, WAFs, CDNs, and security plugins are built to block automated requests they don’t recognise, so a brand-new monitor pointed at a well-protected site can be stopped at the door by those rules rather than by any real downtime.
UptimeRobot guards against misreads by re-checking from multiple locations before confirming a state, and allowlisting removes the ambiguity entirely by letting the checks reach their target cleanly.
A related false-down cause is platforms that reject the HEAD requests some monitors use, returning a 403 that looks like downtime, switching the affected monitor to GET resolves it.
At scale, the clean approach is to make IP allowlisting a standard part of onboarding each new environment. Because checks come from multiple locations and the IP list can change, allowlist the full published range rather than a single address.
UptimeRobot maintains a current list of monitoring IPs to allowlist; building it into your setup checklist keeps every monitor accurate from day one.
Making the monitoring itself grow up
Scaling isn’t just about adding more monitors. You’ll likely expand the types of checks you run as you expand.
That might include keyword monitors that verify page content, port monitors for specific services, heartbeat or cron monitors for scheduled jobs, SSL certificate and domain expiration monitoring, and API monitoring for critical endpoints.
Multi-location checks also confirm that an issue is real rather than a temporary problem in a single region before an alert is sent.
This matters at scale because an expired SSL certificate or a silently failed cron job can be as damaging as an outright outage, and both are invisible to a basic up/down check.
Expanding monitor types is how monitoring keeps pace with what you’re running. See the fuller set aimed at larger teams on the UptimeRobot enterprise overview.
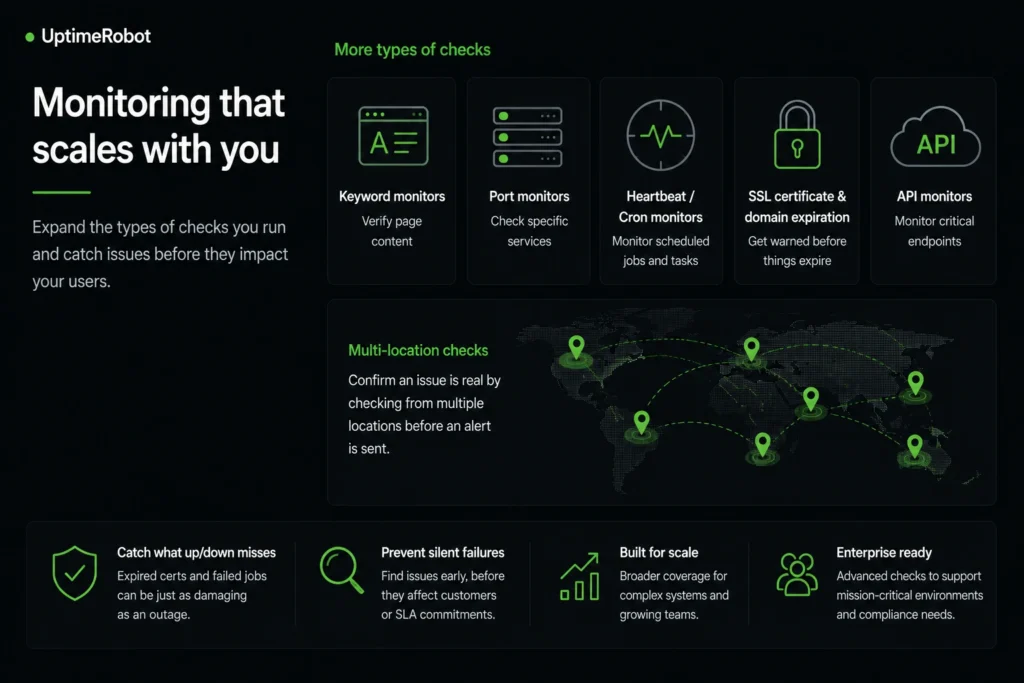
UptimeRobot monitoring
Planning plans and pricing for growth
Planning the commercial side alongside the technical side keeps scaling smooth.
UptimeRobot’s pricing scales with the things you’d expect, monitor count, seats, and add-ons like SMS or voice credits, so once you know which of those is your main growth axis, your costs are straightforward to forecast as you expand.
It helps to match your plan to where you’re heading. Check what a plan includes as you approach its limits, and step up when your footprint grows. For teams monitoring at real scale, the UptimeRobot enterprise plan is built around exactly these needs, including more monitors, faster checks, clearer ownership, and alert routing across teams on one platform.
Choosing the right tier for your stage keeps monitoring costs clear and easy to plan around.
Next steps
Monitoring a handful of websites is straightforward. Scaling to hundreds or thousands of endpoints takes more planning, but it doesn’t have to mean more complexity.
By organizing monitors, routing alerts to the right teams, planning your reporting process, and expanding the types of checks you run, you can build a monitoring setup that grows alongside your infrastructure instead of becoming harder to manage.
If you’re reaching the limits of your current monitoring setup, explore the UptimeRobot Enterprise plan to see how features like faster monitoring intervals, advanced alert routing, team management, and enterprise support can help you scale with confidence.
-
Attach the relevant alert contacts to each monitor and configure them for the events you care about, since UptimeRobot lets you set routing per monitor. Attaching contacts as part of creating each monitor keeps every service wired into your alerting from the start. For SMS or voice, keep a healthy credit balance so those channels are always ready.
-
A team member (login seat) can sign in and manage monitors; a notify-only contact simply receives alerts without dashboard access. As you scale, give login access to those who administer the account and use notify-only for responders who just need to be paged, which keeps seat costs and change control tidy.
-
Use tags to group monitors by client, environment, service, or criticality, and use bulk actions to edit, tag, pause, or set notifications across many at once. Decide your tagging scheme early, along the lines you’ll want to filter and report by, so it scales with you.
-
Allowlist UptimeRobot’s published monitoring IPs in your firewall, WAF, or CDN so the checks reach your endpoints cleanly. Because checks come from multiple locations and the list can change, allowlist the full published range, and build this into onboarding for each new environment.
-
UptimeRobot offers uptime and incident data through the dashboard, scheduled email reports, and a full API for programmatic exports. Pick the path that fits your workflow, and note your plan’s retention window so you can plan reporting around it.
-
Pricing scales with monitor count, seat count, and add-ons like SMS or voice credits, so identifying your main growth axis makes costs easy to forecast. Check what a plan includes as you approach its limits and step up when your footprint grows. Larger teams often move to the enterprise plan for scale and clearer ownership.
-
Yes. UptimeRobot is SOC 2 certified, and a copy of the report is available through an enterprise demo. A signed DPA and details of security practices are published on the security page. If your procurement process includes a vendor security questionnaire, raise it with the sales team early, completed documentation is part of the enterprise onboarding path, and starting it in parallel with your technical evaluation keeps the purchase from stalling at due diligence.
-
Yes. Alongside major credit and debit cards, UptimeRobot supports wire transfer, and enterprise plans can be handled through PO-based, annually invoiced workflows, useful when finance can’t issue a card for a non-US vendor. Annual billing also saves roughly 20% versus monthly. If your procurement runs on POs, mention it when you talk to sales so billing cadence and payment method are set up correctly from the start.
-
Two common causes. First, a firewall, WAF, CDN, or security plugin blocking the checks, solved by allowlisting the published monitoring IPs. Second, some platforms reject the HEAD requests certain monitors use, returning a 403 that looks like downtime; switching the affected monitor to GET resolves it. Multi-location re-checks already filter out single-region blips, but these two fixes remove false downs at the source.