The reasons for replacing SolarWinds vary. For some teams, it’s rising costs. For others, it’s cloud adoption, containerized workloads, or a desire for simpler monitoring tools that require less administration.
Whatever the motivation, there are now far more choices than there were a few years ago. This comparison looks at the leading SolarWinds alternatives across network monitoring, observability, uptime monitoring, and open-source infrastructure monitoring.
Key takeaways
- UptimeRobot: Best for uptime monitoring and status pages
- LogicMonitor: Best SaaS based infrastructure monitoring
- Datadog: Best for cloud native environments
- Dynatrace: Best for large enterprise deployments
- PRTG Network Monitor: Best overall SolarWinds replacement
- ManageEngine OpManager: Best value for traditional IT teams
- Zabbix: Best free and open source option
- Checkmk: Best for customization and flexibility
- Icinga: Best for open source monitoring with modern automation capabilities
- Nagios: Best for highly customizable monitoring environments

Why some users leave SolarWinds
Many organizations start looking for alternatives when licensing costs, infrastructure changes, or a high level of complexity start to outweigh the benefits of staying on SolarWinds.
Pricing can become difficult to justify
Cost is one of the most common themes that appears in user reviews. While SolarWinds is often praised for its monitoring capabilities, some teams feel the platform becomes expensive as environments grow or additional modules are added.
One Gartner Peer Insights reviewer described SolarWinds as a powerful monitoring solution but noted that “the licensing and pricing are complex” and cited the “high cost” as a drawback.
Similar feedback shows up across review platforms, where users mention licensing costs as a factor when evaluating alternatives.
Complexity comes with the platform’s depth
The platform is designed to do a lot, but some users say that complexity can make day-to-day administration harder.
A G2 reviewer wrote that “there’s a steep learning curve because the interface is complex,” which is a common theme in user reviews, especially from teams that want a simpler monitoring setup.
Gartner Peer Insights reviews echo this sentiment, with users describing SolarWinds as powerful but sometimes cumbersome to set up and manage, particularly for smaller teams.
User experience and performance concerns
Another recurring theme is that some parts of the platform can feel dated compared to newer monitoring tools.
One Capterra reviewer summarized this concern simply: “Product feels dated.”
Performance can also become a frustration. A Software Advice reviewer reported that “over time it gets really slow,” highlighting concerns about responsiveness and day-to-day usability.
Modern infrastructure has changed monitoring needs
Many alternatives place greater emphasis on cloud-native environments, SaaS delivery, Kubernetes, and modern observability workflows.
Organizations moving toward hybrid or cloud-first architectures often use that transition as an opportunity to reevaluate their monitoring stack and compare SolarWinds against newer platforms that were designed with those environments in mind.
Quick comparison
Every tool in this guide approaches monitoring a little differently. Some are built for large enterprise environments, some focus on network and infrastructure monitoring, and others prioritize simplicity, flexibility, or uptime monitoring.
Here’s a quick side-by-side comparison before we look into each option.
| Alternative | Best for | Main advantage | Starting price |
| UptimeRobot | Uptime monitoring and status pages | Fast set up and predictable pricing | Free plan, Enterprise from $54/month |
| LogicMonitor | SaaS based infrastructure monitoring | No monitoring infrastructure to manage | Custom pricing |
| Datadog | Cloud native environments | Infrastructure monitoring, APM, and observability in one platform | Usage based pricing |
| Dynatrace | Large enterprise deployments | Automated discovery and root cause analysis | Custom pricing |
| ManageEngine OpManager | Traditional IT teams | Familiar SolarWinds style monitoring at a lower cost | Custom pricing |
| PRTG Network Monitor | Best overall replacement | Fast setup and extensive sensor library | Free for 100 sensors |
| Zabbix | Free and open source server monitoring | No software licensing costs | Free |
| Checkmk | Customization and flexibility | Deep visibility across complex environments | Free, paid enterprise plans available |
| Icinga | Modern open source monitoring | Strong automation and extensibility | Free |
| Nagios | Highly customizable monitoring | Large plugin ecosystem | Free, paid enterprise editions available |
Enterprise and SaaS alternatives
SaaS monitoring platforms remove the need to maintain monitoring infrastructure while adding capabilities such as multi location monitoring, automation, collaboration features, and cloud visibility.
These platforms are preferred by teams that want enterprise monitoring capabilities without running and maintaining the monitoring platform themselves.
UptimeRobot
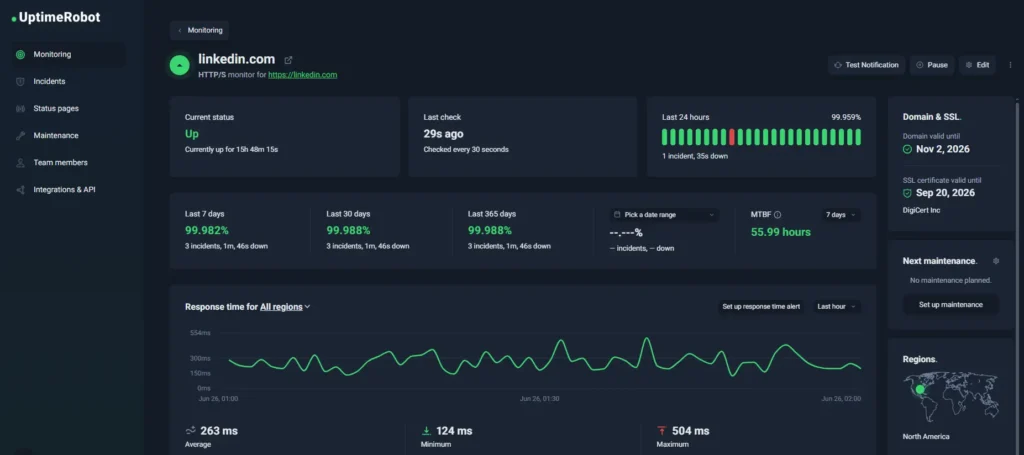
UptimeRobot dashboard
Best for: Organizations that want visibility into service availability and fast outage alerts without maintaining a larger monitoring platform.
Teams often choose UptimeRobot to monitor websites, APIs, SSL certificates, ports, DNS records, domains, and heartbeat (cron jobs) from external locations around the world.
It provides fast outage detection, alerting, incident communication, and status pages without requiring monitoring servers, agents, or complex deployment projects.
Alerts can be delivered through email, SMS, Slack, Microsoft Teams, PagerDuty, webhooks, and other integrations. Built-in status pages make it easy to share incident updates with customers and stakeholders, while API access allows teams to automate monitor management and reporting.
Enterprise plans add capabilities for larger deployments, including 30-second monitoring intervals, multi-location checks, incident management, advanced response time monitoring, unlimited status pages, dedicated customer success support, and role based access controls.
| Free plan | Enterprise plan |
| 50 monitors | Custom monitor limits |
| 5-minute monitoring intervals | 30-second monitoring intervals |
| HTTP(S), ping, port, keyword, API, UDP, DNS, and multi-location monitoring | All monitoring types, plus faster detection and higher limits |
| Basic status pages | Unlimited customizable status pages |
| Up to 5 integrations | Full integration library and enterprise workflows |
| Email alerts | Advanced alerting, incident management, and escalations |
| Web dashboard and mobile apps | Role-based access control and dedicated customer success |
| No credit card required | SLA reporting and enterprise support |
Pricing: Free plan available with 50 monitors. UptimeRobot’s Enterprise tier starts at $54 per month when billed annually.
Custom Enterprise plans are available for organizations that need more than 1,000 monitors or additional requirements.
| Pros | Cons |
| Fast deployment with no monitoring infrastructure to manage | Not designed for deep network device monitoring |
| Multi-location monitoring and 30-second checks | No SNMP based network discovery |
| Unlimited status pages and incident communication tools | Less infrastructure telemetry than observability platforms |
| Enterprise features including role based access and dedicated support | |
| Free plan with 50 monitors |
Ready to start monitoring?
UptimeRobot makes it easy to track websites, APIs, servers, SSL certificates, domains, DNS records, and other critical services without deploying a complex monitoring platform. Create a free account and start monitoring in minutes.
LogicMonitor
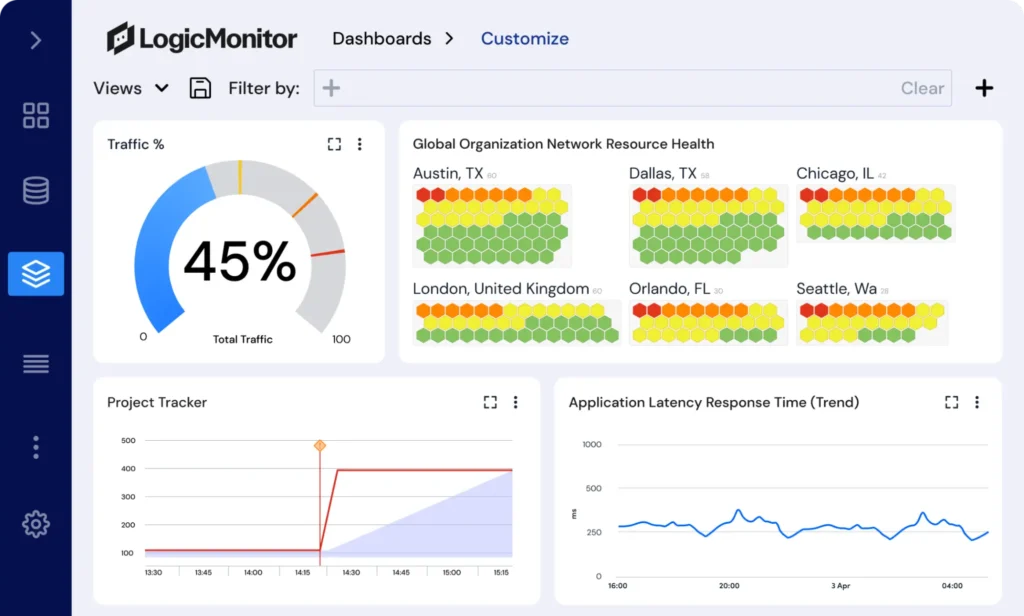
Source: LogicMonitor customizable dashboard example
Best for: Organizations that want infrastructure monitoring without maintaining the monitoring platform themselves.
LogicMonitor is a cloud based monitoring solution that covers networks, servers, applications, cloud services, containers, and storage systems from a single dashboard. Automated discovery and a large library of prebuilt integrations help teams get started quickly without building a monitoring environment from scratch.
That downside comes up frequently in reviews. LogicMonitor is generally praised for ease of deployment and broad monitoring coverage, but cost can become a consideration as environments grow.
Key features:
- Automated infrastructure discovery
- Network, server, cloud, and application monitoring
- Large integration library
- Custom dashboards and reporting
- Alerting and anomaly detection
- SaaS deployment
Pricing: Custom pricing based on monitored resources and deployment requirements.
| Pros | Cons |
| No monitoring infrastructure to manage | Pricing can become expensive at scale |
| Strong automation and discovery capabilities | Custom pricing requires sales engagement |
| Broad infrastructure visibility | Less flexibility than self hosted tools |
| Large integration ecosystem |
Datadog
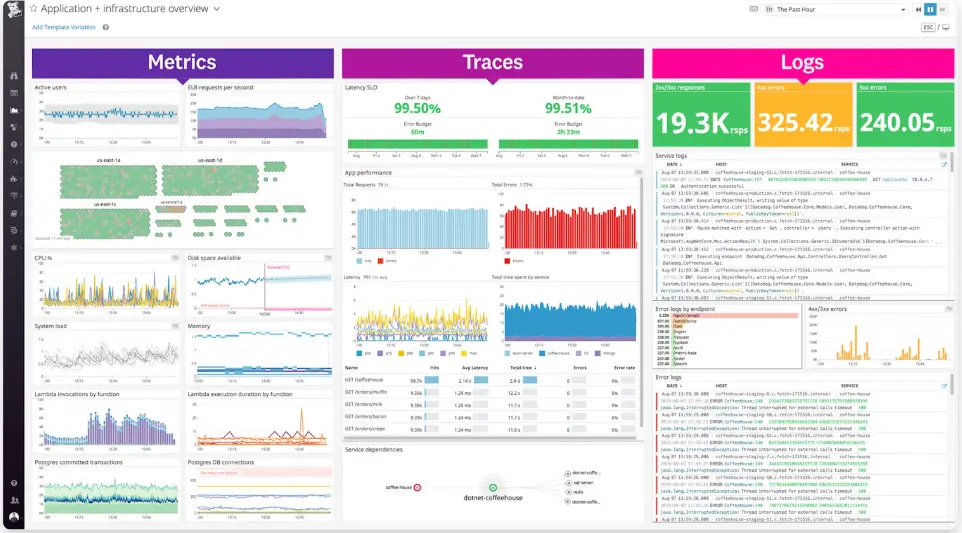
Source: Datadog dashboard example
Best for: Teams that need infrastructure monitoring, application monitoring, and observability in a single platform.
Datadog has become one of the most widely used observability platforms for cloud native environments. In addition to infrastructure monitoring, it offers application performance monitoring, log management, distributed tracing, security monitoring, and real user monitoring.
The platform’s strength is breadth. Teams can collect and correlate data across infrastructure, applications, containers, and cloud services from a single environment.
Key features:
- Infrastructure monitoring
- Application performance monitoring
- Log management
- Distributed tracing
- Kubernetes and cloud monitoring
- Security monitoring
Pricing: Usage based pricing across multiple products and services.
| Pros | Cons |
| Extensive observability capabilities | Costs can grow quickly |
| Strong cloud and Kubernetes monitoring | Pricing can be difficult to forecast |
| Large integration ecosystem | More complexity than traditional monitoring tools |
| Excellent application visibility |
Dynatrace
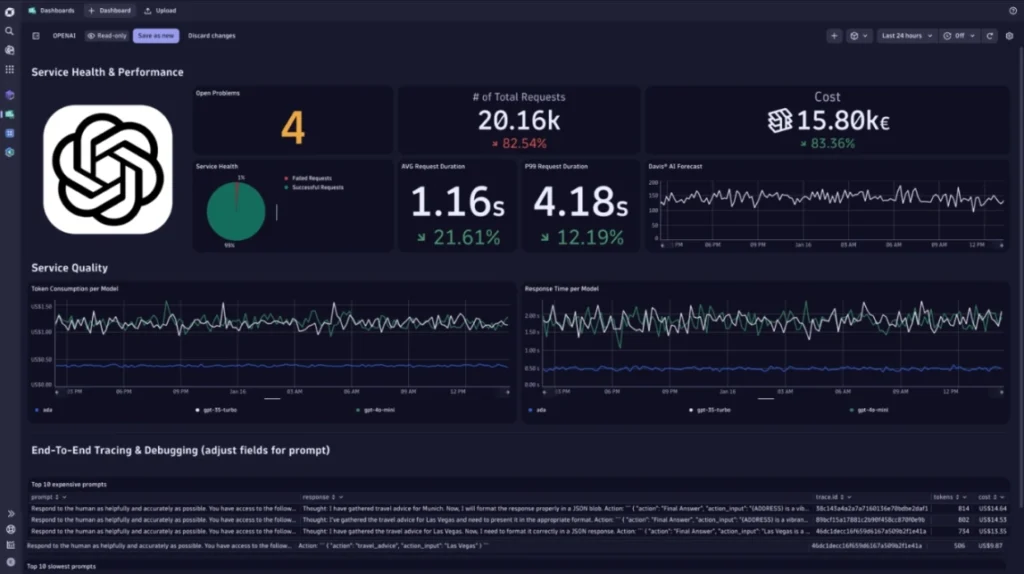
Source: Dynatrace dashboard example
Best for: Large enterprises that want automated monitoring, dependency mapping, and root cause analysis across complex environments.
Dynatrace is an enterprise observability platform for large scale hybrid and cloud environments. It automatically maps relationships between infrastructure, services, applications, and dependencies to help teams identify issues faster.
The platform is known for automation and AI assisted analysis, decreasing the amount of manual investigation required during incidents.
Key features:
- Infrastructure and application monitoring
- Automatic dependency mapping
- Distributed tracing
- Cloud and Kubernetes monitoring
- AI assisted root cause analysis
- Digital experience monitoring
Pricing: Custom pricing based on monitored hosts, applications, and usage.
| Pros | Cons |
| Strong automation capabilities | Premium pricing |
| Excellent visibility across complex environments | More platform than many organizations need |
| Advanced root cause analysis | Implementation can take time |
| Broad observability coverage |
Traditional infrastructure monitoring alternatives
Some organizations replacing SolarWinds are not looking for observability platforms or SaaS monitoring tools. Instead, they want network monitoring, device visibility, automated discovery, and performance monitoring that works similarly to what they’re already using today.
Teams that want broad infrastructure monitoring without moving to a full observability stack often gravitate towards these platforms.
ManageEngine OpManager
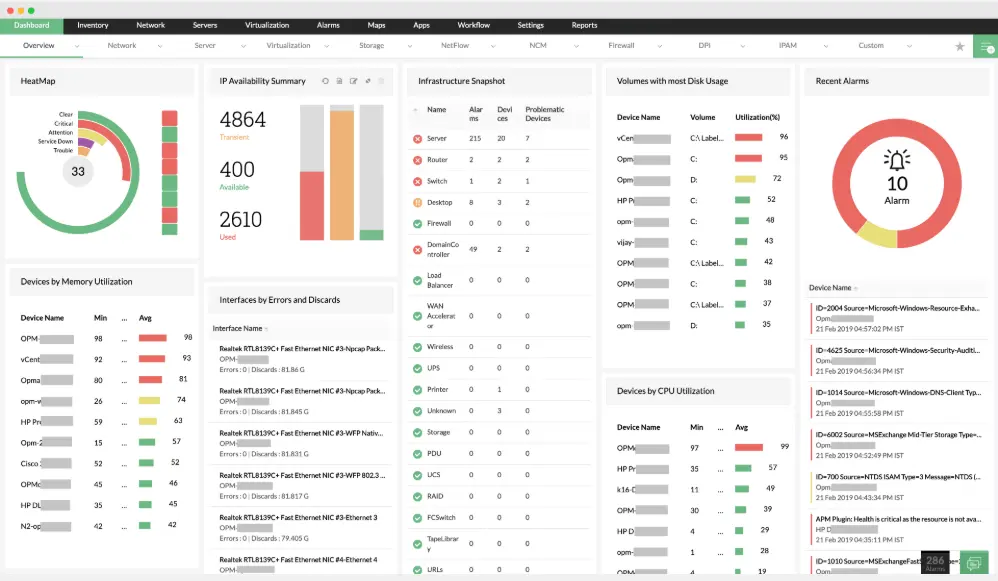
Source: Network monitoring dashboard example from ManageEngine
Best for: IT teams that want network and infrastructure monitoring similar to SolarWinds at a more predictable cost.
ManageEngine OpManager is one of the closest direct competitors to SolarWinds. It covers network devices, servers, storage systems, virtual environments, and applications while following a monitoring model that feels familiar to many SolarWinds users.
Organizations often consider OpManager when they want to preserve traditional infrastructure monitoring workflows without moving to a full observability platform.
Key features:
- Network, server, and storage monitoring
- Automated device discovery
- Performance monitoring and alerting
- Network mapping and visualization
- Custom dashboards and reporting
- Integrations with the wider ManageEngine ecosystem
Pricing: Multiple editions and pricing tiers are available based on deployment size and requirements.
| Pros | Cons |
| Familiar experience for SolarWinds users | Interface can feel crowded |
| Broad infrastructure monitoring coverage | Some advanced capabilities require additional products |
| Automated discovery and mapping | Cloud monitoring is less mature than some observability tools |
| Predictable licensing model |
PRTG Network Monitor
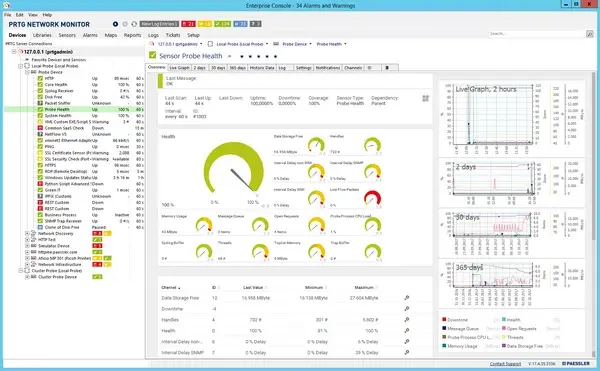
Source: PRTG Network Monitor dashboard example
Best for: Organizations that want broad infrastructure visibility and network monitoring without the complexity of larger enterprise platforms.
PRTG Network Monitor is one of the most frequently recommended SolarWinds alternatives. It covers network devices, servers, applications, virtual environments, cloud services, and bandwidth monitoring through a large library of preconfigured sensors.
Deployment is generally faster than many enterprise monitoring platforms thanks to built in auto discovery and ready made monitoring templates. This makes PRTG a popular option for organizations that want broad infrastructure visibility without spending months building and tuning a monitoring system.
A Reddit user discussing SolarWinds alternatives described it this way: “For monitoring, PRTG comes to mind pretty quickly as the best alternative [to SolarWinds].”
Key features:
- More than 250 preconfigured sensor types
- Automatic network discovery
- Network, server, application, virtualization, and cloud monitoring
- SNMP, WMI, NetFlow, sFlow, IPFIX, and packet sniffing support
- Custom dashboards, maps, and reporting
- On premises and hosted deployment options
Pricing: PRTG includes a free version for up to 100 sensors. Paid plans scale based on the number of sensors monitored.
| Pros | Cons |
| Frequently recommended as a SolarWinds replacement | Sensor based pricing can become expensive in large environments |
| Fast deployment with auto discovery | Estimating sensor requirements can be challenging |
| Strong network monitoring capabilities | Less focused on observability than Datadog or Dynatrace |
| Large library of built in sensors |
Open source and self hosted alternatives
Open source monitoring tools remain popular among organizations that want more control over their monitoring environment or want to avoid recurring software licensing costs.
These platforms typically require more setup and ongoing administration than commercial alternatives, but they offer a level of flexibility and customization that many infrastructure teams value.
Zabbix
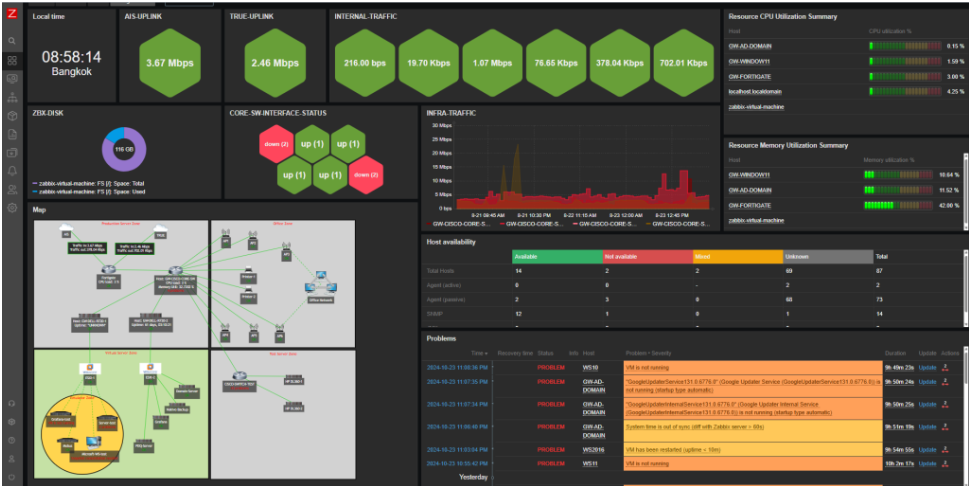
Source: Zabbix dashboard example
Best for: Teams that want enterprise grade monitoring without recurring software licensing costs.
Zabbix is one of the most popular open source monitoring platforms and a common choice for organizations looking to move away from SolarWinds without taking on recurring licensing costs.
The platform supports servers, network devices, cloud infrastructure, virtual machines, containers, and applications through a combination of agent based and agentless monitoring. While it requires more hands-on administration than SaaS alternatives, many teams consider the tradeoff worthwhile because of its flexibility and scalability.
Key features:
- Free and open source
- Agent based and agentless monitoring
- SNMP, IPMI, JMX, and WMI support
- Custom dashboards and visualizations
- Alerting and escalation policies
- Distributed monitoring architecture
Pricing: Zabbix is free to use. Commercial support and professional services are available separately.
| Pros | Cons |
| No licensing costs | Requires more administration than hosted platforms |
| Highly customizable | Steeper learning curve |
| Scales well in large environments | Initial deployment can take time |
| Large community and ecosystem |
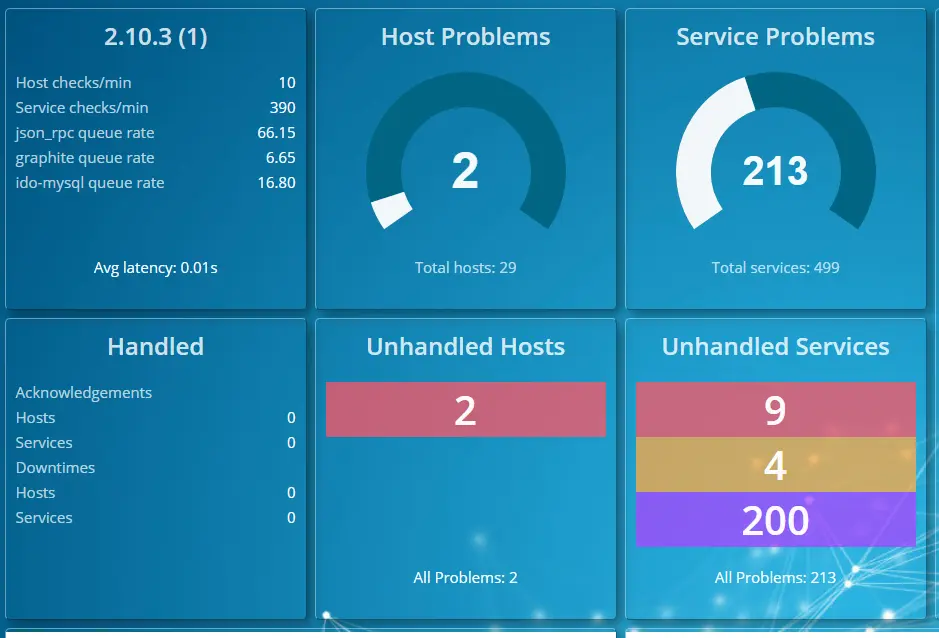
Checkmk
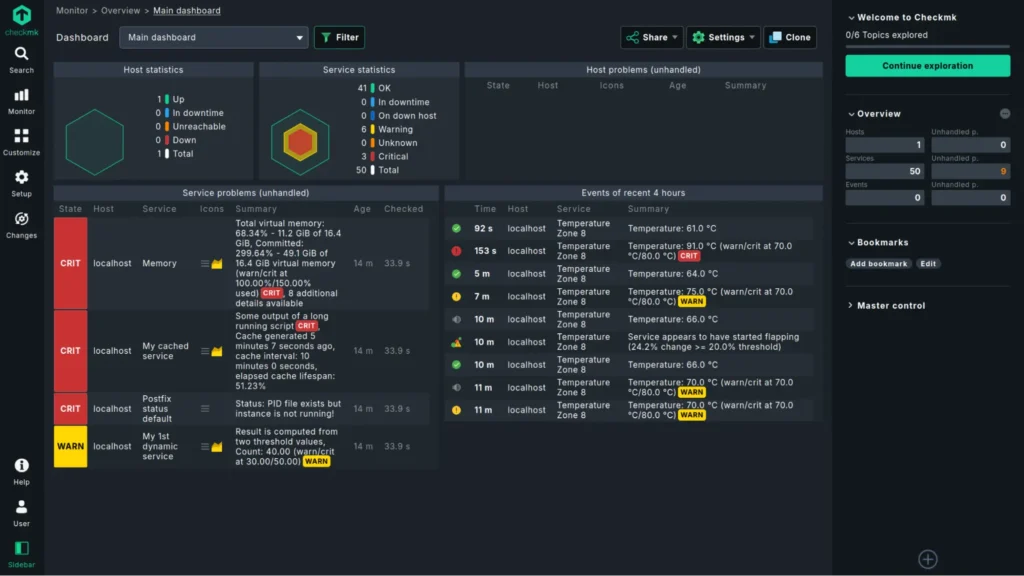
Source: Checkmk dashboard example
Best for: Organizations that need deep visibility across large hybrid environments and have the resources to customize their monitoring platform.
Checkmk has built a strong following among infrastructure teams that need detailed monitoring across large and complex environments. It supports physical infrastructure, virtual machines, cloud services, containers, applications, and network devices from a single platform.
One Reddit user described their experience with Checkmk this way: “We’ve got Nagios with Checkmk. It works well enough for the monitoring that we do, but it’s time consuming to set up and get working the way you want.”
That balance between flexibility and administration effort comes up frequently in discussions about Checkmk. Organizations willing to invest the time are rewarded with extensive monitoring depth and customization options.
Key features:
- Infrastructure, application, and cloud monitoring
- Automated service discovery
- Custom dashboards and reporting
- Distributed monitoring
- Advanced alerting and notifications
- Free and enterprise editions
Pricing: Checkmk Raw Edition is free and open source. Commercial enterprise plans are available for larger deployments.
| Pros | Cons |
| Deep monitoring capabilities | Requires time to configure and tune |
| Strong scalability | Learning curve can be steep |
| Excellent hybrid environment visibility | Administration overhead is higher than SaaS tools |
| Free open source edition available |
Icinga
Source: Icinga dashboard example
Best for: Teams that want open source monitoring with modern automation and extensive customization options.
Icinga began as a fork of Nagios and has evolved into a monitoring platform with a more modern architecture, stronger automation capabilities, and a cleaner management experience.
It remains a popular option among organizations that want the flexibility of open source monitoring while avoiding some of the limitations associated with older monitoring platforms.
Key features:
- Infrastructure and network monitoring
- Modern web interface
- API driven architecture
- Custom dashboards and reporting
- Distributed monitoring support
- Extensive integrations and extensions
Pricing: Icinga is free and open source.
| Pros | Cons |
| Modern alternative to Nagios | Requires self hosting and maintenance |
| Strong automation capabilities | Smaller ecosystem than Nagios |
| Flexible deployment options | Can require significant configuration |
| Free and open source |
Nagios
Source: Nagios dashboard example
Best for: Organizations that need highly customizable monitoring and are comfortable managing it themselves.
Nagios is one of the longest running infrastructure monitoring platforms and remains widely used across enterprise and public sector environments. Its greatest strength is flexibility. With thousands of plugins available, organizations can monitor almost any device, service, or application.
However, that flexibility comes with tradeoffs. Compared to newer platforms, Nagios often requires more manual configuration and ongoing administration.
Key features:
- Infrastructure and network monitoring
- Large plugin ecosystem
- Custom alerting and reporting
- Agent based and agentless monitoring
- Broad protocol support
- Enterprise editions available
Pricing: Nagios Core is free and open source. Commercial editions are available separately.
| Pros | Cons |
| Extremely flexible | Interface feels dated compared to newer platforms |
| Large plugin ecosystem | Significant manual configuration |
| Free open source edition | Higher maintenance requirements |
| Well documented and widely deployed | Steeper learning curve for new users |
How to choose a SolarWinds replacement
A platform that’s perfect for network monitoring may be a poor fit for cloud observability, and a tool that’s ideal for uptime monitoring may not have the infrastructure visibility your team needs.
Define your non negotiables
Start by identifying the capabilities you can’t live without. If your team relies on SNMP, WMI, or ICMP polling for network devices, you’ll want a platform built around infrastructure monitoring.
If application performance monitoring, distributed tracing, or cloud observability are priorities, tools such as Datadog or Dynatrace may be a better fit.
Review your integrations
Monitoring rarely exists in isolation. Before committing to a replacement, verify that it integrates with the tools your team already uses, whether that’s Jira, ServiceNow, Slack, Microsoft Teams, PagerDuty, or another part of your incident management workflow.
Look beyond the starting price
Pricing models vary significantly between vendors. Tools such as PRTG charge based on sensors, ManageEngine primarily charges by device count, and UptimeRobot charges by monitor count.
Observability platforms often use usage based pricing tied to hosts, logs, traces, or data volume. Understanding how costs scale is just as important as comparing the starting price.
Match the platform to the job
Some organizations need a direct SolarWinds replacement. Others are looking for a cloud based monitoring platform, an open source alternative, or a simpler way to monitor websites and APIs.
Choosing a tool that matches your actual requirements usually leads to a better outcome than selecting the platform with the longest feature list.
Next steps
If uptime monitoring is your priority, try UptimeRobot for free and see how quickly you can start monitoring websites, APIs, SSL certificates, domains, and other critical services.
You can create your first monitors in minutes, configure alerts through email, Slack, Microsoft Teams, PagerDuty, and other integrations, and share updates through built in status pages.
-
The best SolarWinds alternative depends on your requirements. ManageEngine OpManager and PRTG Network Monitor are often considered the closest replacements for traditional infrastructure monitoring. Datadog and Dynatrace are popular choices for cloud observability, while UptimeRobot is a strong option for uptime monitoring and status pages.
-
Yes. Zabbix, Checkmk, Icinga, and Nagios all offer free open source versions. UptimeRobot also offers a free plan with 50 monitors for uptime monitoring.
-
Datadog and Dynatrace are among the most popular choices for cloud and hybrid environments because they combine infrastructure monitoring, application monitoring, and observability capabilities in a single platform.