TCP monitoring tools range from lightweight external service monitors to packet analyzers and infrastructure monitoring platforms. They cover everything from verifying TCP service availability to diagnosing latency, retransmissions, and connection failures.
The right tool depends on whether you’re monitoring availability, troubleshooting network issues, or both.
TCP is the protocol that guarantees ordered delivery, handles retransmission when packets go missing, and manages flow control between endpoints with very different capacities.
When it works, you don’t think about it. When it doesn’t, the symptoms are frustratingly vague, and show up in the form of slow page loads, dropped database connections, VoIP calls that crackle and stutter, or microservices that time out under load.
The problem isn’t usually a clean break. TCP degrades gradually, and without the right visibility, it can look like an application problem, a server problem, or simply “the network being weird today.”
TCP monitoring gives protocol-level visibility into what’s actually happening by tracking metrics such as round-trip time, retransmission rate, and connection establishment latency.
We’ll compare the best TCP monitoring tools, explain the key metrics they measure, and show how to choose the right approach for your environment.
Key takeaways
- TCP monitoring tools generally fall into two categories: external service monitoring and protocol diagnostics. Most production environments benefit from both.
- UptimeRobot, Better Stack, and Oh Dear continuously verify that TCP services are reachable from external locations, making them well suited to availability monitoring and fast outage detection.
- Wireshark, SolarWinds, Nagios, PingPlotter, and PRTG provide deeper visibility into TCP connections, helping teams investigate latency, retransmissions, packet loss, and other network issues.
- The right tool depends on your environment, troubleshooting requirements, and how it fits into your existing monitoring stack.
- Combining external TCP monitoring with protocol-level diagnostics provides a more complete view of service availability and network performance.
What TCP monitoring measures
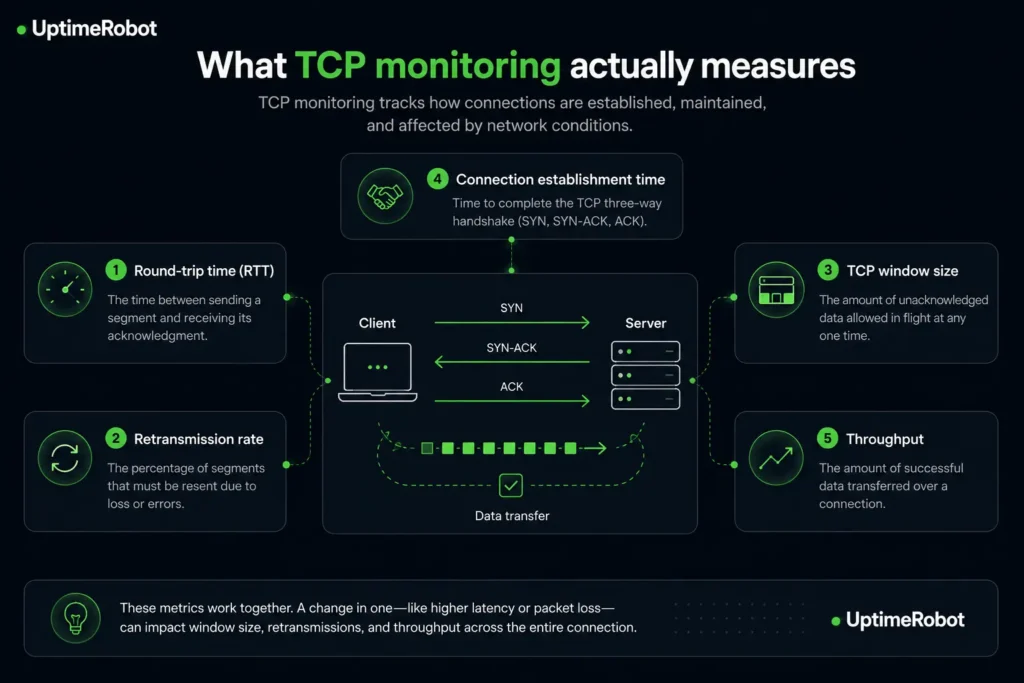
TCP monitoring tracks how connections are established, maintained, and affected by changing network conditions. While different tools expose different levels of detail, most focus on five core metrics:
- Round-trip time (RTT): The latency between sending a TCP segment and receiving its acknowledgment. Rising RTT increases application response times and often signals network congestion.
- Retransmission rate: The percentage of segments that must be resent. Consistently high retransmissions usually indicate congestion, packet loss, or hardware issues.
- TCP window size: The amount of unacknowledged data that can be in transit. Window size helps identify throughput bottlenecks caused by buffer or configuration limits rather than bandwidth.
- Connection establishment time: The time required to complete the TCP three-way handshake. Increasing handshake latency can point to server overload, firewall delays, or networking issues.
- Throughput: The amount of data successfully transferred over a connection. Throughput depends on bandwidth, latency, packet loss, and TCP window size rather than raw network capacity alone.
What TCP monitoring measures
How to choose the right TCP monitoring tool
As with most monitoring needs, it depends on what you want to monitor. Some platforms verify that TCP services are reachable from external locations, while others help diagnose protocol behavior and network performance from inside your infrastructure.
When comparing tools, consider:
- Your monitoring goal: Do you need to verify service availability, investigate TCP performance issues, or both?
- Deployment environment: Cloud, on-premises, hybrid, and Kubernetes environments have different monitoring constraints.
- Integration with your existing stack: Choose a tool that works with your monitoring, alerting, and incident management workflows.
- Alerting and reporting: Decide whether you need real-time alerts, historical trend analysis, or both.
- Operational overhead: Consider the time required to deploy, maintain, and interpret the tool, not just its licensing cost.
| Tool | External TCP monitoring | Packet analysis | Historical trends | Alerts | SaaS | Free plan | Best for |
| UptimeRobot | ✅ | ❌ | ✅ | ✅ | ✅ | ✅ | External TCP availability |
| Better Stack | ✅ | ❌ | ✅ | ✅ | ✅ | ❌ | Observability + uptime |
| Oh Dear | ✅ | ❌ | ✅ | ✅ | ✅ | ❌ | Website & server health |
| Wireshark | ❌ | ✅ | ❌ | ❌ | ❌ | ✅ | Deep packet analysis |
| SolarWinds NPM | ◐ | ❌ | ✅ | ✅ | ❌ | ❌ | Enterprise infrastructure |
| Nagios | ◐ | ❌ | ✅ | ✅ | ❌ | ✅ (Core) | Infrastructure monitoring |
| PingPlotter | ◐ | ❌ | ✅ | ✅ | ❌ | ✅ | Path latency troubleshooting |
| PRTG | ◐ | Limited | ✅ | ✅ | ❌ | ✅ | All-in-one infrastructure |
External TCP service monitoring
External TCP monitoring answers a different question than packet analyzers. Rather than inspecting TCP behavior inside your infrastructure, these tools verify that TCP services are reachable from the public internet.
They complement internal monitoring by showing what your users actually experience.
UptimeRobot
UptimeRobot ping monitoring dashboard
Best for: Teams that need continuous external TCP service monitoring without deploying additional infrastructure.
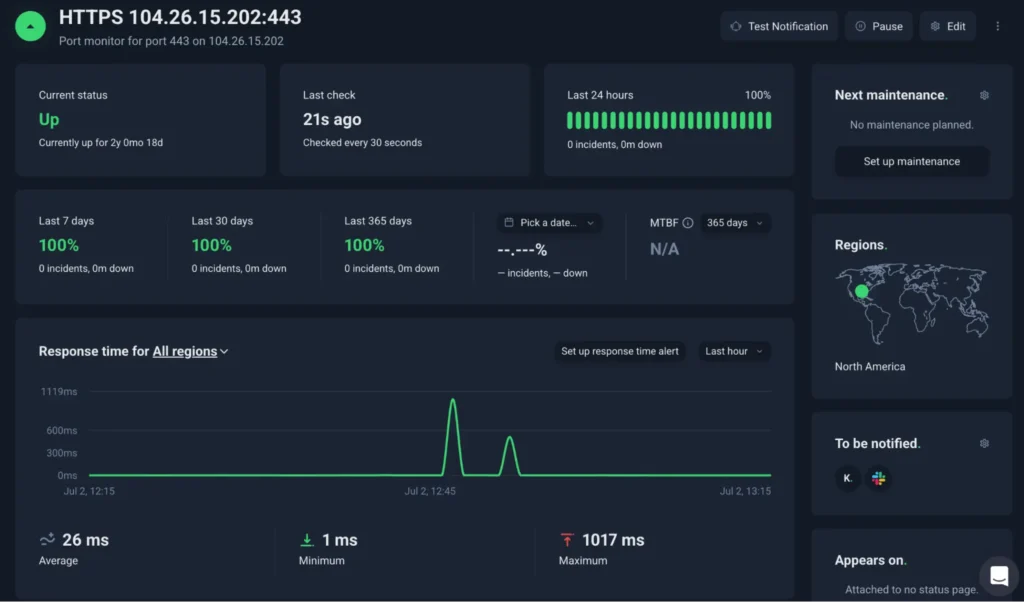
UptimeRobot’s TCP ping monitoring verifies service availability by attempting a full TCP handshake against the ports you specify from multiple external monitoring locations. It supports standard services such as SSH, SMTP, DNS, FTP, databases, and custom TCP ports, alerting you as soon as a connection fails.
Monitoring locations distinguishes localized connectivity issues from widespread outages, while slow response alerts notify you when performance degrades. Custom metadata makes it easier to organize monitors and route alerts in larger deployments.
UptimeRobot continuously checks whether your TCP services are reachable from outside your network, providing an external view of service availability that complements internal monitoring.
Pricing: Free plan available. Paid plans start at $9/month (annual).
| Pros | Cons |
| Multi-location TCP port monitoring | No packet-level diagnostics or TCP performance metrics |
| No infrastructure or agents to maintain | Doesn’t analyze retransmissions, RTT, or window size |
| Fast alerts and status pages | Best used alongside infrastructure monitoring |
| Free plan with 50 monitors |
Better Stack
Source: Better Stack service monitoring dashboard template
Best for: Teams that want external TCP monitoring as part of a broader observability platform.
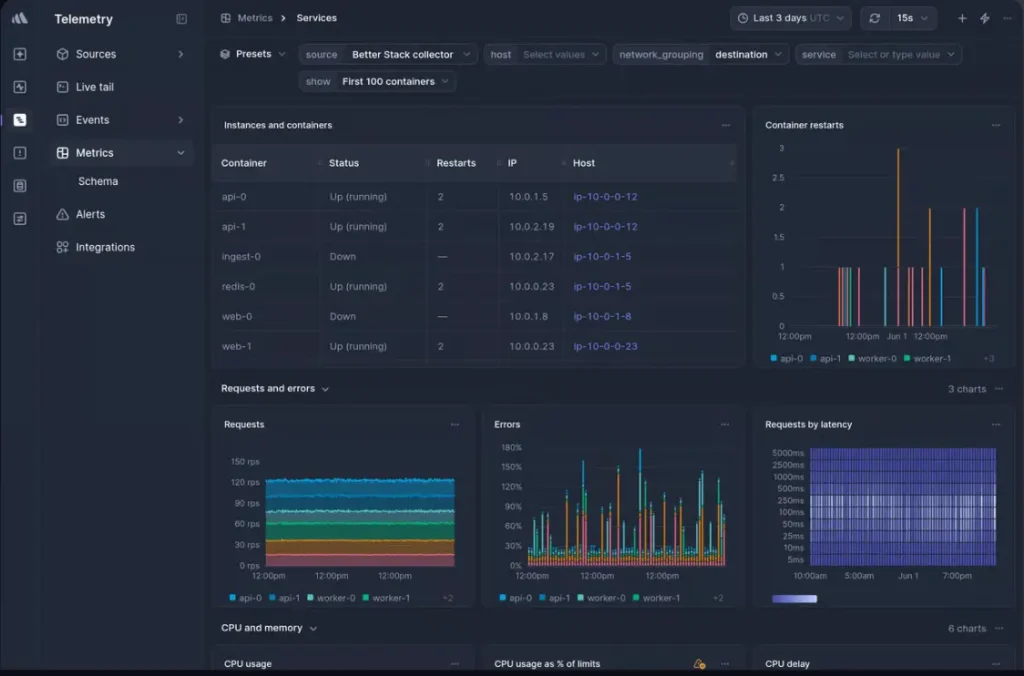
Better Stack includes TCP and UDP port monitoring alongside uptime monitoring, log management, tracing, incident management, and on-call scheduling. Organizations already using Better Stack’s observability platform will be pleased to find that TCP monitoring fits naturally into an existing monitoring workflow.
Complexity is one of the downsides. Compared to dedicated uptime monitoring platforms, Better Stack’s modular pricing and broader feature set make it a better fit for teams that also need centralized observability.
Pricing: Uptime monitoring starts at around $21/month, with additional costs depending on users and enabled products.
| Pros | Cons |
| TCP port monitoring integrated with observability | More complex than dedicated uptime monitoring |
| Logs, tracing, and incident management | Modular pricing increases total cost |
| Strong alerting and automation | Not intended for packet-level TCP analysis |
| Good fit for existing Better Stack users |
Oh Dear
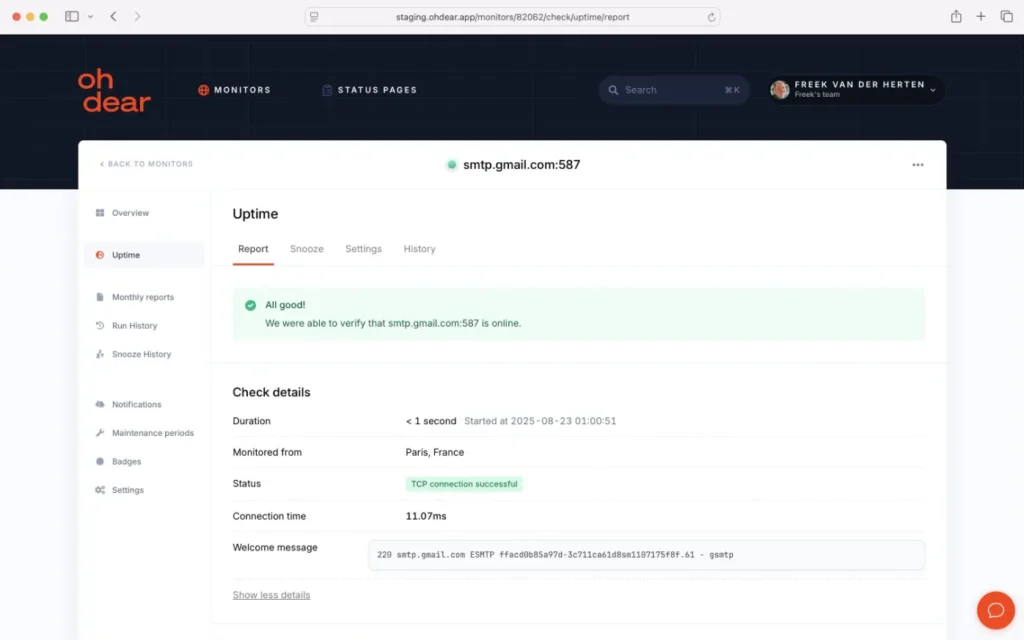
Source: Oh Dear TCP monitoring success page
Best for: Small teams looking for website health monitoring beyond basic uptime checks.
Oh Dear provides TCP port monitoring with SSL certificate monitoring, DNS checks, broken link detection, cron monitoring, Lighthouse audits, and other website health checks. It emphasizes keeping public-facing services available rather than providing deep network diagnostics.
If you’re mainly interested in website availability and health checks, Oh Dear covers much more than simple uptime monitoring.
Pricing: Starts at €15/month after a free trial.
| Pros | Cons |
| Simple SaaS deployment | Limited TCP diagnostics |
| Broad website health monitoring | No packet inspection or protocol analysis |
| Unlimited users | Smaller observability ecosystem than enterprise platforms |
| Easy to configure |
TCP diagnostics and infrastructure monitoring
These tools focus on TCP behavior inside your infrastructure. They expose protocol-level metrics, packet data, and connection statistics used to investigate latency, retransmissions, packet loss, and failed connections.
Wireshark
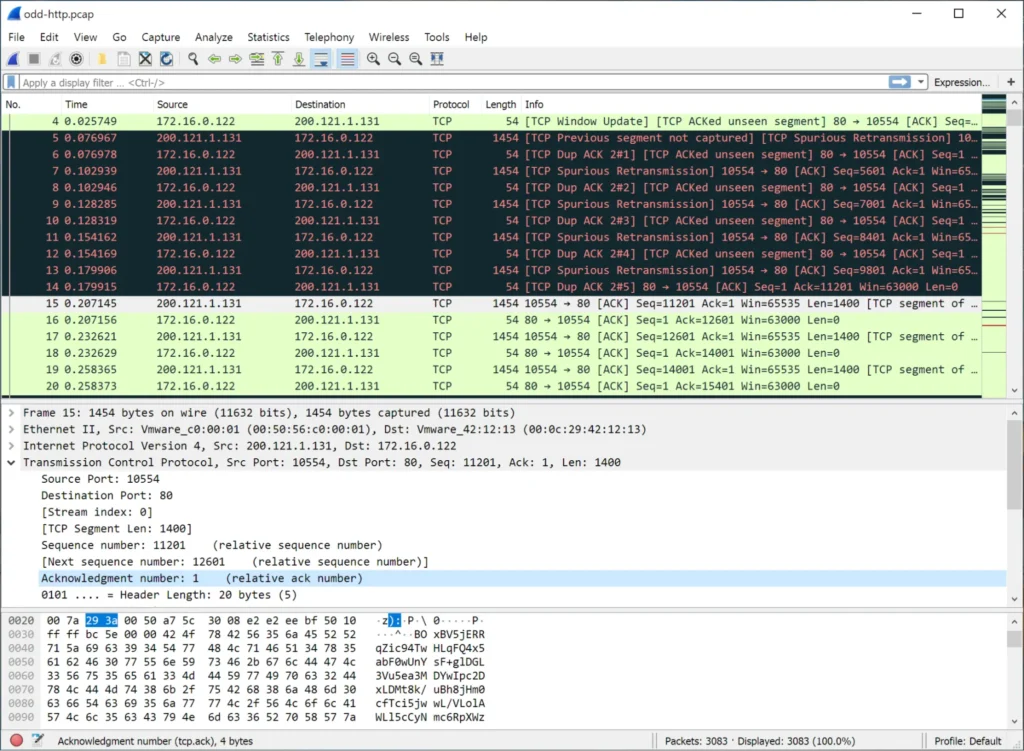
Source: Wireshark interface showing TCP packet analysis
Wireshark is the reference tool for packet-level TCP analysis. Its capture-and-inspect model is unmatched for diagnosing handshake failures, malformed segments, and unusual retransmission patterns.
You can filter on tcp.analysis.retransmission to isolate every retransmitted frame in a capture, or use tcp.analysis.ack_rtt > 0.2 to surface packets experiencing more than 200ms of queuing delay.
However, note that Wireshark consumes significant CPU and memory during packet dissection, it’s not designed for continuous monitoring, and it can drop packets under heavy multi-gigabit traffic. It’s most valuable during focused incident investigation, not as a persistent background monitor.
Pricing: Free and open-source
| Pros | Cons |
| Most granular TCP analysis available | Not designed for continuous monitoring |
| Free and open source | Drops packets under heavy multi-gigabit traffic |
| Massive protocol support and filter library | Steep learning curve for TCP state analysis |
| Available on every major platform | Generates large capture files that need separate storage |
SolarWinds Network Performance Monitor
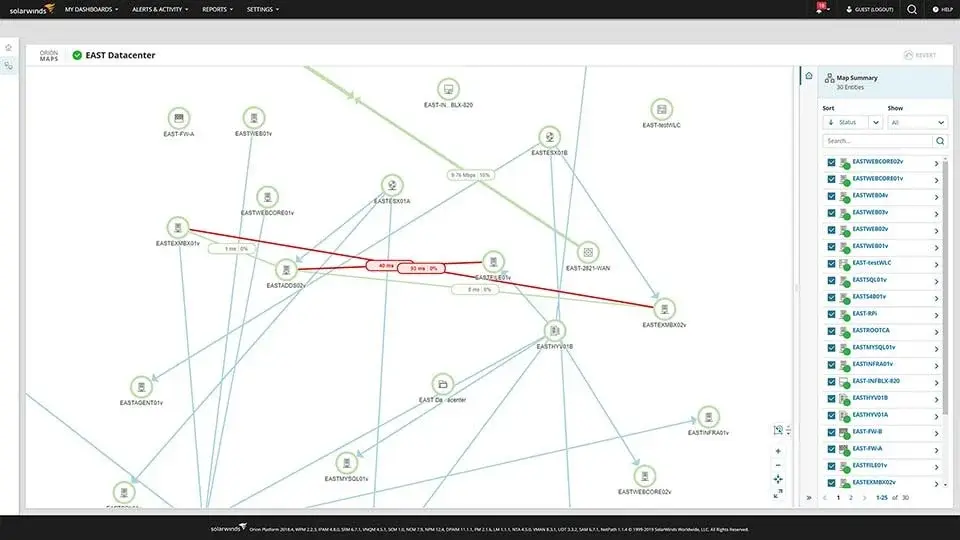
Source: SolarWinds NPM long and network performance pack example
SolarWinds NPM sits at the opposite end of the spectrum. It’s a commercial platform built for enterprise operations teams who need dashboards, threshold-based alerts, and historical trending without deep packet inspection.
Its Quality of Experience dashboard separates TCP handshake latency from application response time (time to first byte), which is a useful distinction for isolating where latency originates.
The trade-off is architectural weight. SolarWinds NPM requires substantial Windows Server infrastructure, setup is complex, and its polling-based model doesn’t adapt well to highly elastic cloud environments.
Pricing: Starts at $8 per node/month (annual subscription; volume discounts available).
| Pros | Cons |
| Separates TCP handshake latency from app response time | Requires substantial Windows Server infrastructure |
| Strong dashboards and historical trending | Complex setup and ongoing maintenance |
| Enterprise-grade threshold alerting | Polling model doesn’t suit elastic cloud environments |
Nagios
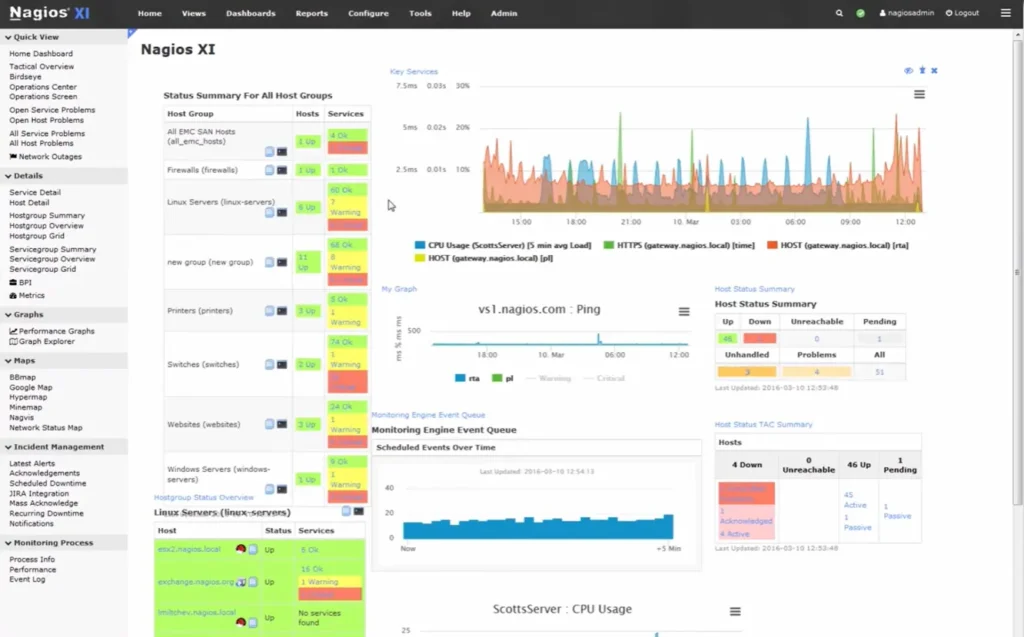
Source: Monitoring TCP/UDP ports with Nagios
Nagios has been part of infrastructure monitoring for a long time, and its plugin architecture gives it genuine flexibility.
The alerting model is well-tested in large environments, and there’s a substantial ecosystem of community-built plugins for TCP port checks and connection timing measurement. It’s reliable for verifying that services are reachable and flagging when they’re not.
That said, Nagios is primarily a state-checker. It can verify that a TCP port is open and measure how long a connection attempt takes, but it doesn’t provide native packet-level or flow-level metric streams.
The setup complexity is high, and the interface hasn’t kept pace with modern expectations. A strong choice for teams with existing Nagios expertise, not a first recommendation for new deployments.
Pricing: Nagios Core is free and open source. Nagios XI, which adds a web interface, reporting, and enterprise features, starts at $2,595.
| Pros | Cons |
| Mature and well-tested alerting model | No native packet-level or flow-level metrics |
| Huge plugin ecosystem for TCP port monitoring | Interface hasn’t kept pace with modern tools |
| Free Core version available | High setup complexity |
| Proven at scale in large environments | Primarily a state-checker, not a traffic analyzer |
PingPlotter
Source: PingPlotter network path analysis
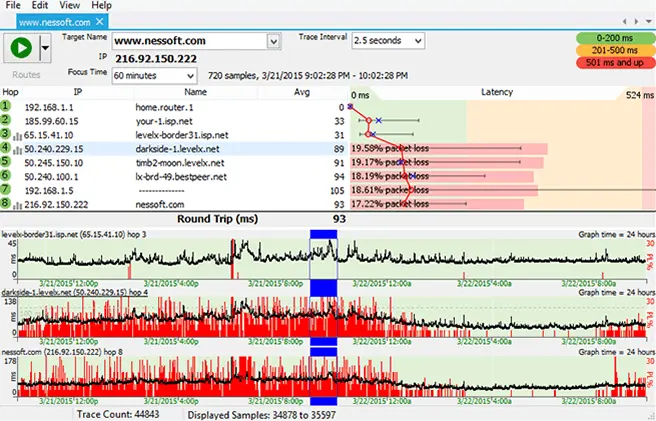
PingPlotter occupies a niche that none of the other tools here fill: visualizing path-level latency and packet loss over time in a format that non-specialists can actually interpret.
It uses real TCP SYN probes, typically targeting port 443, to trace each hop and map latency along the path. This mirrors actual application-layer behavior and bypasses networks that filter ICMP.
The limitation is that PingPlotter works with synthetic probes, not passive production traffic. It won’t surface dynamic socket metrics or tell you about retransmissions in live sessions.
It’s most valuable for diagnosing whether a problem lives in your local network, an ISP segment, or a remote endpoint, making it a good choice for distributed teams and remote-work troubleshooting.
Pricing: Free version available. Professional starts at $29/month, with perpetual licenses also available.
| Pros | Cons |
| Uses real TCP SYN probes, bypasses ICMP filtering | Synthetic probes only, not passive production traffic |
| Clear hop-by-hop latency visualization | No live socket metrics or retransmission data |
| Accessible to non-specialists | Limited to path-level diagnostics |
PRTG Network Monitor
Source: PRTG Network Monitor overview
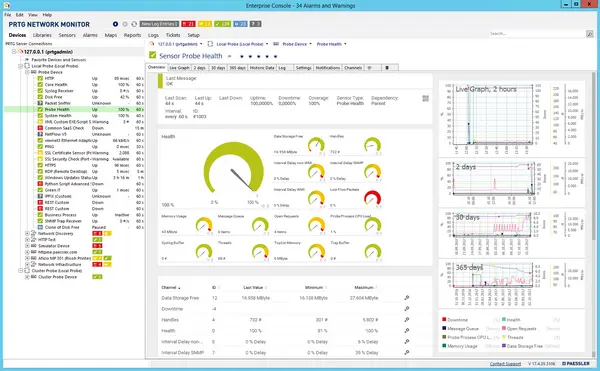
PRTG is a generalist platform that treats TCP monitoring as one capability among many. Its pre-built sensor library covers SNMP, WMI, NetFlow, and packet sniffing, and it functions as a consolidated availability and traffic monitoring tool.
Out-of-the-box templates can decrease initial configuration time, and the sensor-based licensing model scales reasonably for mid-sized environments.
Large or highly dynamic environments may find the sensor limits constraining, and PRTG doesn’t offer deep application-layer transaction correlation. For multi-site infrastructure teams that want consolidated visibility without building a platform from scratch, it’s a practical addition.
Pricing: Free edition available (up to 100 sensors). Paid subscriptions start at $200/month (billed annually)
| Pros | Cons |
| Pre-built sensor library covers TCP alongside SNMP, WMI, NetFlow | Sensor-based licensing can constrain large environments |
| Out-of-the-box templates reduce setup time | No deep application-layer transaction correlation |
| Consolidated multi-device visibility in one interface | Windows-centric core server |
The manual shortcut: CLI tools for quick checks
Some TCP issues don’t require a dedicated monitoring platform. Built-in command-line tools are often the fastest way to inspect active connections or capture traffic during troubleshooting.
- ss / netstat: View listening TCP ports, active connections, and socket statistics.
- lsof -i: Identify which processes are using specific TCP ports.
- tcpdump: Capture TCP packets directly from the command line for server-side troubleshooting or detailed protocol analysis.
TCP monitoring best practices
A few simple practices make TCP monitoring more effective:
- Establish a baseline: Compare current performance against historical trends instead of relying on fixed thresholds. Normal latency varies across networks and environments.
- Use meaningful alert thresholds: Alert on sustained increases in retransmission rates, handshake latency, or failed connections rather than isolated spikes.
- Correlate network and application data: TCP metrics become much more useful when viewed alongside infrastructure, application, and system health data.
- Monitor for unusual connection patterns: Unexpected spikes in SYN activity, half-open connections, or traffic on unfamiliar ports can indicate misconfigurations or potential security issues.
Common TCP performance problems and how monitoring surfaces them
TCP monitoring helps identify issues before they impact users. Some of the most common include:
- Buffer bloat: Large network buffers increase latency under load, even when bandwidth isn’t fully utilized. Rising RTT is often the first sign.
- Retransmission storms: Increasing retransmission rates combined with falling throughput usually indicate packet loss or network congestion.
- SYN flooding: Whether caused by a DDoS attack or a misconfigured application, a growing number of half-open connections and rising handshake latency can overwhelm a server.
- Half-open connections: Stale TCP sessions consume connection table resources over time. Monitoring connection states helps detect the problem before it affects availability.
No single tool catches every TCP issue. Combining external availability monitoring with deeper protocol analysis gives you the clearest picture of TCP health across your environment.
Choosing the right TCP monitoring approach
The best TCP monitoring strategy combines external service monitoring with protocol-level diagnostics. External monitoring confirms that users can reach your services, while diagnostic tools explain why connections slow down or fail. Together, they provide a much clearer picture of network health than either approach alone.
If continuous TCP service availability is your priority, UptimeRobot’s TCP ping monitoring verifies your services by attempting a full TCP handshake from multiple external monitoring locations. It supports standard services such as SSH, SMTP, DNS, FTP, databases, and custom TCP ports, with slow response alerts, custom metadata, status pages, and check intervals as short as 30 seconds on Enterprise plans.
FAQ
-
TCP monitoring measures the health and availability of TCP connections by tracking metrics such as connection establishment, latency, retransmissions, and service availability. It identifies network problems before they impact applications and users.
-
Traditional ping monitoring uses ICMP to verify that a host is reachable. TCP monitoring attempts to establish a connection to a specific TCP port, confirming not only that the host is online but also that the service listening on that port is responding.
-
The best tool depends on what you need to monitor. UptimeRobot is well suited to external TCP service availability, Wireshark provides detailed packet analysis, PingPlotter visualizes latency and packet loss, while PRTG, SolarWinds, and Nagios are better suited to infrastructure-wide monitoring.