Website monitoring is the practice of continuously checking a site’s availability, performance, and content so problems get caught before customers hit them. Good website monitoring goes beyond a single uptime ping. It combines multiple monitor types to detect outages, performance issues, unexpected content changes, SSL certificate problems, and domain expiration before they affect customers.
We’ll go over six practical steps, from choosing what to check to routing alerts to the right people, plus how to confirm outages from multiple locations and keep customers informed with a status page.
Key takeaways
- Monitor your homepage, transactional pages, and backend APIs separately using the appropriate monitor type, whether that’s HTTP/S for websites or ping for server availability.
- Match check intervals to business risk: one minute for revenue-driving pages, five minutes for standard sites, 15 or more minutes for staging environments.
- Route alerts by severity, saving SMS and phone calls for confirmed hard downs.
- Confirm outages from at least two geographic locations before paging anyone.
- Share uptime through a customizable public or private status page with automatic subscriber updates.
- Review alert logs regularly to reduce false positives and keep monitoring reliable.
- UptimeRobot offers a free tier with 50 monitors at five-minute intervals, plus a public status page and alerts for growing teams.
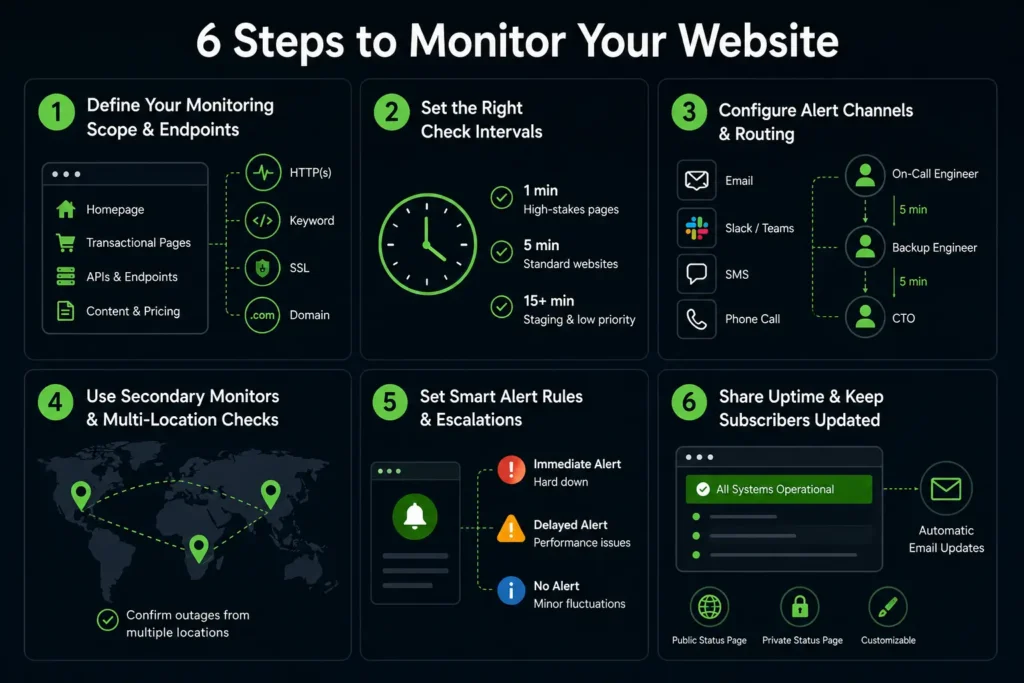
6 steps to website monitoring
Step 1: Define your monitoring scope and endpoints
Before you turn anything on, decide what actually needs watching. Your homepage is critical, but it isn’t the only page that deserves monitoring. Checkout flows, login pages, and backend APIs can fail independently, even while the homepage remains online.
This is also where you choose the right monitor types. Website monitoring goes beyond checking whether a page is online. Depending on your setup, you may also want to monitor response times, SSL certificates, domain expiration, specific page content, APIs, and server availability.
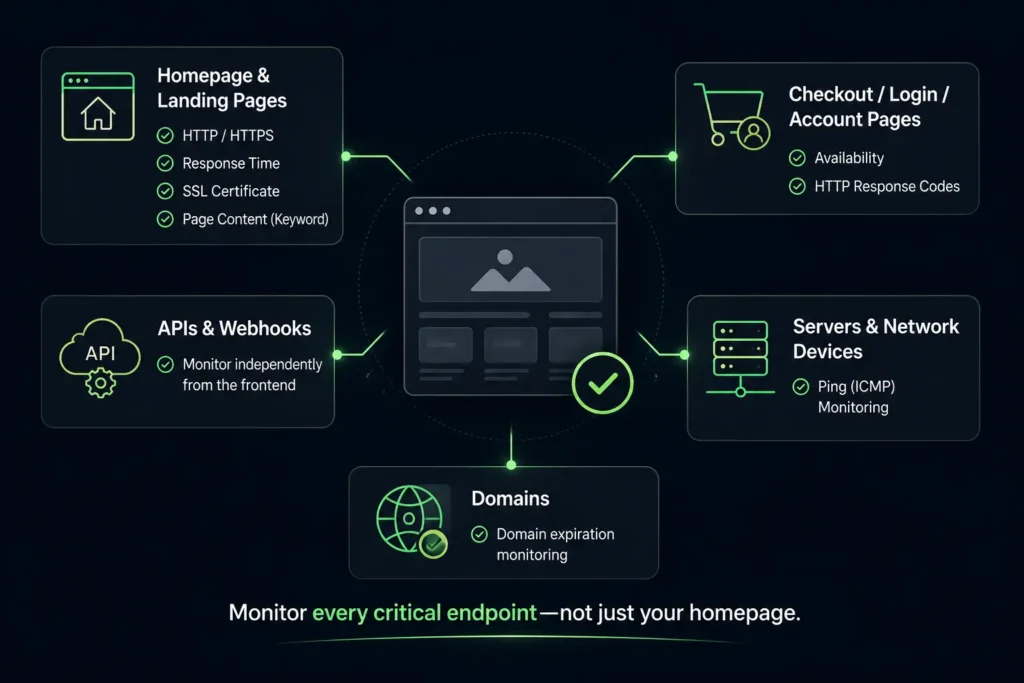
What to monitor
Think of your scope in tiers:
- Homepage and key landing pages, using HTTP/HTTPS monitoring to track availability, response times, SSL certificates, and expected page content.
- Checkout, login, and account pages, monitored independently so you’re alerted if they become unavailable or return unexpected HTTP response codes.
- Backend APIs and webhooks, monitored separately from the frontend so service issues don’t go unnoticed.
- Servers and network devices, using ping (ICMP) monitoring to verify network connectivity.
- Domains, monitored for upcoming expiration to help prevent avoidable outages.
Once you know what you’re watching, you can decide how often to check it.
Step 2: Establish the right check intervals
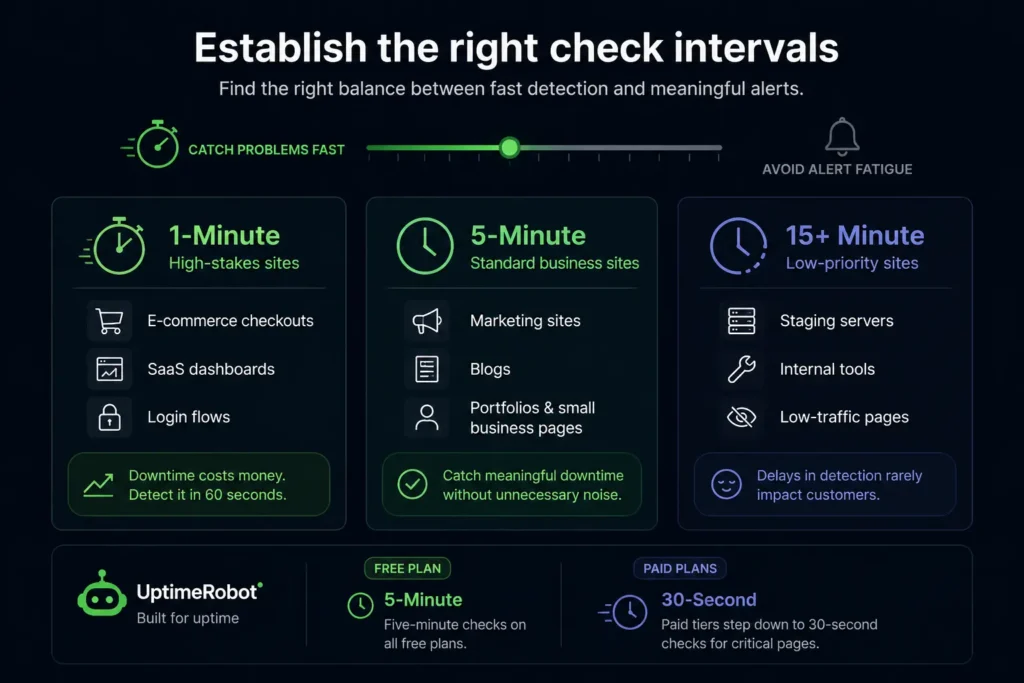
Check frequency is a balance between catching problems fast and generating noise nobody needs. The interval you pick matters as much as the check itself.
High-stakes sites, meaning e-commerce stores and SaaS platforms where downtime directly costs money, should run checks at one-minute intervals. Anything slower lets a real outage run unnoticed for too long. Standard business sites, portfolios, and blogs are usually well served by five-minute intervals, which catch meaningful downtime without adding unnecessary load.
Staging environments and low-priority pages can run on 15-minute intervals or longer, since a delay in detection there rarely matters to a paying customer.
- One-minute intervals: E-commerce checkouts, SaaS dashboards, login flows.
- Five-minute intervals: Marketing sites, blogs, portfolios, most small business pages.
- 15-plus minute intervals: Staging servers, internal tools, low-traffic pages.
UptimeRobot runs five-minute checks on free plans, which covers most standard business sites. Paid tiers step down to 30 second checks for pages where every second of downtime counts.
Alert frequency tips
Step 3: Configure alert channels and routing
Alerts call for different response severities, and treating them all equally is how teams end up ignoring notifications altogether. The channel you use should match the urgency of the failure.
Email works well for a paper trail. It’s easy to search later and gives you a record for post-incident reviews, but it’s a poor choice for anything that needs a response in the next few minutes since inboxes get ignored.
Push notifications through the mobile app help on-call engineers stay connected even when they’re away from their desks. They provide immediate visibility into new incidents, making it easier to respond quickly wherever you are.
Slack, Microsoft Teams, webhooks, and other integrations combine with existing workflows, allowing teams to receive alerts wherever they already manage operational communication.
SMS and phone calls should be reserved for hard downs, the kind of failure where your site or a core function is completely unreachable and someone needs to act immediately.
| Channel | Best for | Response speed |
| Records, post-incident review | Slow | |
| Slack / Teams / Webhooks | Day-to-day visibility | Moderate |
| SMS / Phone call | Confirmed hard downs | Immediate |
Escalation policies tie this together. A simple version might state that if the first on-call engineer doesn’t acknowledge an SMS alert within five minutes, the system automatically calls a backup engineer, and after another five minutes, it texts the CTO.
Step 4: Set up multi-location checks
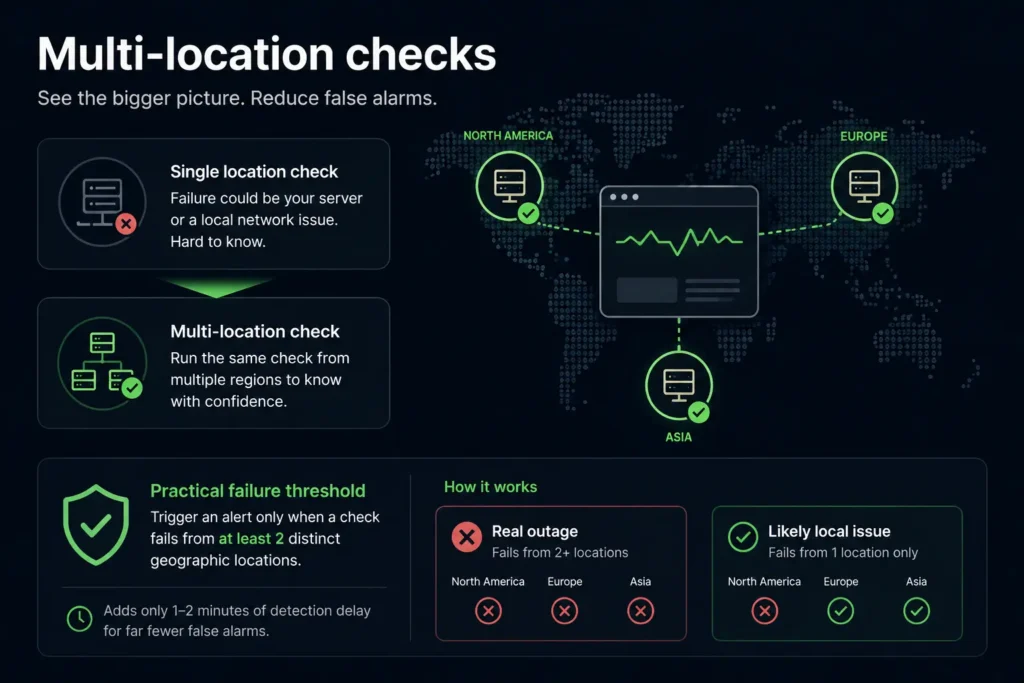
Checking your site from a single location tells you less than you’d think. If your only monitor sits in New York and it reports a failure, that could mean your server is down, or it could mean a regional ISP had a bad five minutes.
Without a second data point, you can’t tell the difference, and that uncertainty leads to either missed outages or false alarms.
Multi-location checks benefits
Multi-location monitoring solves this by running the same check from several regions at once, commonly North America, Europe, and Asia. If your site fails from all three, you’re looking at a real outage. If it only fails from one, the problem is likely local to that network path rather than your infrastructure.
A practical failure threshold: trigger an alert only when a check fails from at least two distinct geographic locations. This single rule cuts false alarms dramatically while adding only a minute or two of detection delay, which is a reasonable trade for far fewer 2 a.m. false pages.
Step 5: Create a status page
A status page does two jobs at once. It tells customers what’s happening, and it takes pressure off your support team during an incident.
Public status pages are customer-facing. They build trust because they show you’re aware of problems and actively working on them, instead of leaving visitors to wonder why checkout isn’t loading.
Private status pages serve internal stakeholders, like leadership or account managers, who need visibility into system health without exposing infrastructure details externally.
Subscribers can receive email updates as incidents are posted and resolved, helping customers stay informed without having to keep refreshing the status page.
Good incident communication follows a simple pattern:
- Acknowledge the issue as soon as it’s confirmed, even before you know the cause.
- State clearly that the team is investigating.
- Give a timeframe for the next update, such as “next update in 30 minutes.”
- Close the loop once resolved, with a short note on what happened.
Step 6: Review, refine, and run routine audits
Once your monitors are in place, the hard part is done. The monitoring runs continuously in the background, alerting you when something needs attention so you don’t have to keep checking your website manually. But you can always improve your setup.
Run reviews and audits
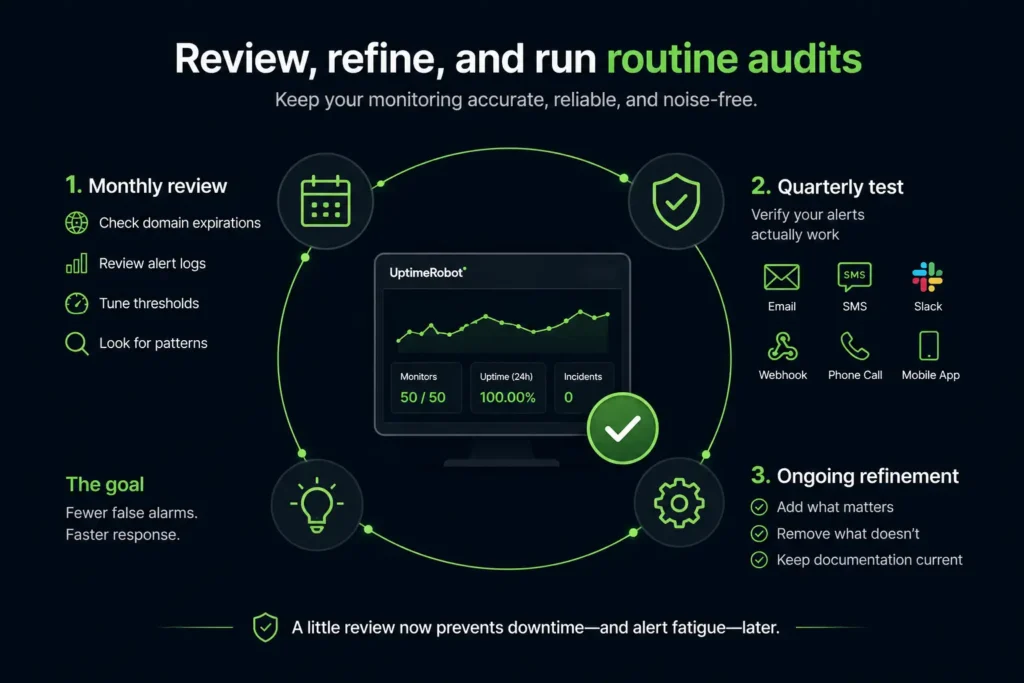
Domain expiration alerts deserve a spot on your monthly checklist alongside everything else.
Reviewing your alert logs monthly helps you spot false positives before they train your team to ignore real alerts. If a page consistently runs slower during a predictable peak, adjusting the timeout threshold for that window prevents spam alerts without hiding a genuine problem.
This kind of review also surfaces useful patterns like repeated content or timing shifts often point to a deploy, a CDN change, or an unnoticed edit worth investigating.
Testing your alerting system quarterly matters just as much as reviewing logs. Phone numbers change, webhook URLs expire, and Slack integrations occasionally lose their permissions.
Run a quarterly test that deliberately triggers alerts through every configured channel. This confirms your escalation policy still works before you need it during a real incident.
Next step: Create a free UptimeRobot account
Website monitoring works best as a system, not a single tool switched on and forgotten. Define what you’re watching and set intervals that match the stakes. Route alerts so the right person hears about the right problem, and confirm outages from more than one location before anyone gets paged.
Add an automated status page for communication and a quarterly habit of testing the whole setup, and you’ve got a monitoring system that catches problems early without wearing out your team. Start small if you need to. Even a basic HTTP check with sensible alerting beats waiting for a customer to tell you your site is down.
The next step is picking a way to actually watch them.
UptimeRobot’s free plan gives you 50 monitors, 5-minute checks, status page, and the core monitoring types including HTTP/S, keyword, ping, and port.
When a real outage hits, multi-location checks let you spot regional outages, routing problems, or CDN edge issues that won’t show up from a single vantage point.
Alerts can be delivered through email, SMS, voice calls, mobile push notifications, Slack, PagerDuty, webhooks, and other integrations.
Catch outages early, confirm them fast, and keep customers informed automatically.
-
UptimeRobot’s free tier covers 50 monitors at five-minute intervals, which is enough for most small sites, blogs, and side projects to get reliable uptime and SSL certificate monitoring alerts without spending anything.
-
A soft down is a single failed check, often caused by a brief network blip or a slow response, and it shouldn’t trigger an urgent alert on its own. A hard down is an outage that persists beyond your configured alert threshold. Brief interruptions can resolve on their own, so alert confirmation remove unnecessary notifications without delaying alerts for genuine incidents.
-
Three regions, such as North America, Europe, and Asia, give you enough spread to distinguish a real outage from a regional network issue. Requiring failures from at least two before alerting keeps false positives low.