API monitoring checks whether your APIs are available, performing as expected, and returning the correct responses. By sending scheduled requests to your endpoints, it can detect outages, slow response times, failed requests, and unexpected changes before users notice them.
Reliable API monitoring has become essential as more applications depend on APIs for authentication, payments, third party integrations, mobile apps, and internal services.
A single failing endpoint can interrupt critical business processes, even when the rest of your application appears to be working normally.
Modern API monitoring tools do much more than confirm an endpoint is online. They can validate response codes, headers, JSON payloads, SSL certificates, and multi-step workflows while measuring response times and sending alerts when something changes.
Read on to learn about ten API monitoring tools compared by features, pricing, setup, alerting capabilities, and the teams they’re best suited for, from lightweight uptime monitoring platforms to enterprise observability solutions.
Key takeaways
- API monitoring checks endpoint availability, response times, and response accuracy, helping teams detect problems before users are affected.
- The right tool depends on your team’s size, budget, and monitoring needs, from simple uptime checks to full observability platforms.
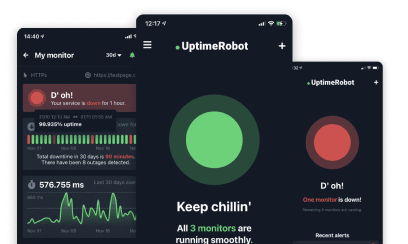
- UptimeRobot is a strong choice for startups and lean teams that want fast setup, predictable pricing, and reliable API monitoring without the complexity of enterprise observability tools.
- Developer-focused platforms like Checkly and Postman suit teams that want monitoring integrated into their development workflow, while Datadog and New Relic are better suited to organizations that need trace-level observability.
- Prioritize monitoring revenue-critical endpoints, authentication services, and third-party integrations before expanding coverage to lower-priority APIs.
API monitoring tools at a glance
This table orders every option by where it tends to land in a team’s stack. Pricing on usage-based platforms like Datadog and New Relic won’t reduce to one clean number, so those figures are a floor rather than a ceiling.
| Tool | Best for | Starting price (paid) | Free tier? | Check interval |
| UptimeRobot | Solo devs, startups, lean ops teams | $8/mo (billed annually) | Yes, 50 monitors | 30 sec to 5 min |
| Checkly | Developer-heavy teams writing tests in code | $40/mo (Team tier) | Yes, 10K API checks/mo | 10 sec to 5 min |
| Better Stack | Startups wanting on-call bundled with monitoring | $29/user/mo (annually) | Yes, 10 monitors | 30 sec to 3 min |
| Postman | Teams already building APIs in Postman | $9/mo (Solo), $19/user/mo (Team) | Yes, single user | Flexible schedules |
| Datadog | Enterprises correlating checks with APM and logs | ~$5 per 10K API test runs/mo | Limited | 1 min |
| New Relic | Enterprises already on New Relic APM | Pay-as-you-go past free allowance | Yes, 500 checks/mo | 1 min |
| Pingdom | Enterprise IT teams wanting legacy stability | $10/mo (billed annually) | No permanent free plan | 1 min |
| StatusCake | EU/UK businesses needing data residency | $24/mo (Superior plan) | Yes, includes 1 SSL monitor | 30 sec to 5 min |
| Site24x7 | Cost-conscious IT teams monitoring more than APIs | $10/mo (10 monitors) | Not explicitly free | 10 sec to 1 min |
| Prometheus + Blackbox Exporter | Teams with ops capacity wanting full self-hosted control | Free (self-hosted) | N/A | Configurable |
API monitoring vs. APM and full-stack observability
API monitoring checks your endpoints from the outside to confirm they’re available, performing well, and returning the expected responses. Observability platforms collect logs, traces, and metrics from inside your applications to help explain why a problem occurred.
Some tools focus primarily on external monitoring, while platforms like Datadog and New Relic combine synthetic monitoring with application performance monitoring and distributed tracing. For many small and mid-sized teams, external API monitoring is enough.
Larger organizations running complex microservices often benefit from the deeper troubleshooting capabilities observability platforms provide.
The best API monitoring tools, compared
Pricing and monitor allowances shift often, so confirm current numbers on the vendor’s pricing page before you commit.
1. UptimeRobot
UptimeRobot API monitoring dashboard
Best for: Teams that want reliable API and uptime monitoring with fast setup, predictable pricing, and room to scale from small projects to enterprise deployments.
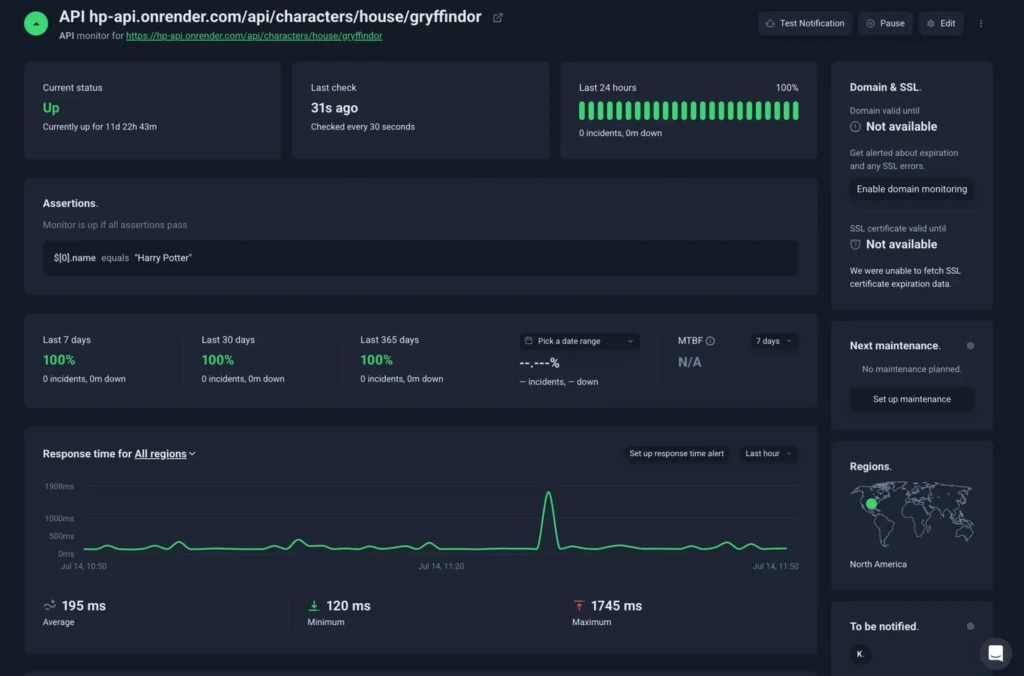
UptimeRobot is the fastest path from “I need to know if my API is down” to an actual working monitor. Setup takes under 60 seconds. Enter an endpoint URL, choose a check interval, and define what a healthy response looks like, whether that’s an expected keyword or a specific status code, all from the web dashboard.
Monitor types cover HTTP/S, ping, port, keyword, DNS, SSL and domain expiration, heartbeat (cron jobs), API, and UDP.
The API monitor supports multi-step checks with assertions on response body, headers, and status codes, so you can validate that an endpoint returns the right data rather than just confirming it responded. Slow-response alerts, multi-location checks, and SSL certificate monitoring come included on paid plans.
Status pages connect directly to your monitors, so customers see a live uptime view without any manual updates from your team.
- Free: 50 monitors at 5-minute intervals, 1 basic status page
- Solo: $8/month billed annually, 10-50 monitors with 60-second checks
- Team: $33/month billed annually ($396/year), 100 monitors with 60-second checks, full status pages, three included seats
- Enterprise: $69/month billed annually, 200 to 1,000+ monitors checked every 30 seconds
No per-seat pricing is a major bonus for larger teams. Where platforms like Better Stack charge by the seat as teams grow, UptimeRobot charges by monitor count, so adding engineers to an on-call rotation doesn’t trigger a billing increase.
| Pros | Cons |
| 50 free monitors, no credit card required | No built-in on-call scheduling or escalation policies |
| Multi-step API assertions on response body, headers, and status codes | No synthetic browser (Playwright/Selenium) testing |
| No per-seat pricing, charges by monitor count | No trace-level correlation with application logs |
| Multi-location checks from multiple global probe locations | Basic analytics compared to enterprise platforms |
| SOC 2 Type 1 certified, operating since 2010 | |
| First monitor live in under a minute |
2. Checkly
Source: Checkly dashboard
Best for: Engineering teams who want API and browser checks managed in Git alongside application code.
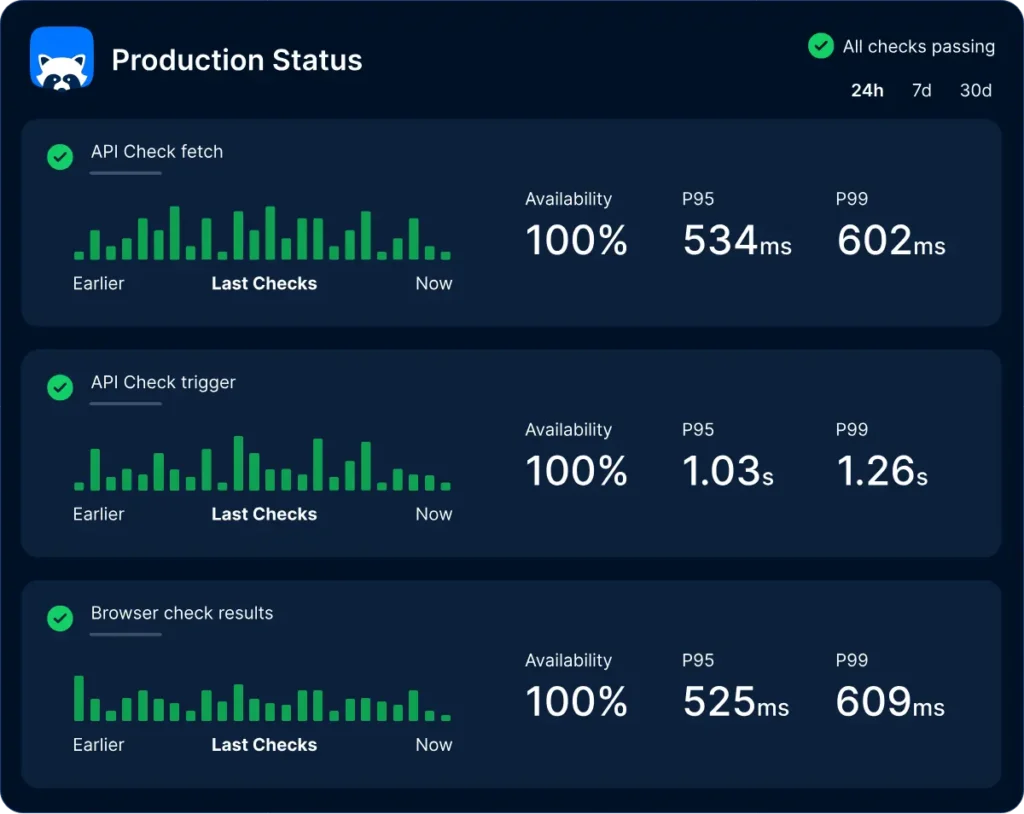
Checkly is built for teams who want their monitors living in the same repo as their application code. Checks are written in JavaScript or TypeScript, run on Playwright, and get pushed to production through the same CI/CD pipeline as everything else, a philosophy called monitoring-as-code.
It covers both API assertions and full browser synthetic tests. AI-assisted failure analysis helps narrow down whether a break is a real regression or a flaky selector. For teams that need to handle complex authentication flows, like token renewal through setup scripts, Checkly handles this cleanly, though multi-factor and biometric flows remain tricky to automate reliably.
The free Hobby tier includes 10,000 API check runs and 1,000 browser check runs per month. Paid Team plans start at $60/month for 100,000 API runs and 12,000 browser runs. There are both smaller and larger plans available as well.
That code-first setup is a real strength for teams already living in Git, but it’s genuine overhead for anyone who just wants to point a tool at a URL and get an alert.
| Pros | Cons |
| Monitoring-as-code, checks live in Git with the application | Requires JavaScript or TypeScript knowledge to set up |
| Playwright-based browser and API checks in one platform | Real overhead for teams that just need URL monitoring |
| AI-assisted failure analysis for Playwright runs | Browser check costs add up quickly at scale |
| Strong CI/CD pipeline integration | Not suited to non-technical users or no-code teams |
| Handles complex multi-step auth flows via setup scripts | Paid tier at $40/mo is steep for small teams |
3. Better Stack
Source: Better Stack uptime monitoring dashboard
Best for: Startups and growing teams that want uptime monitoring, on-call scheduling, and a status page bundled into one tool.
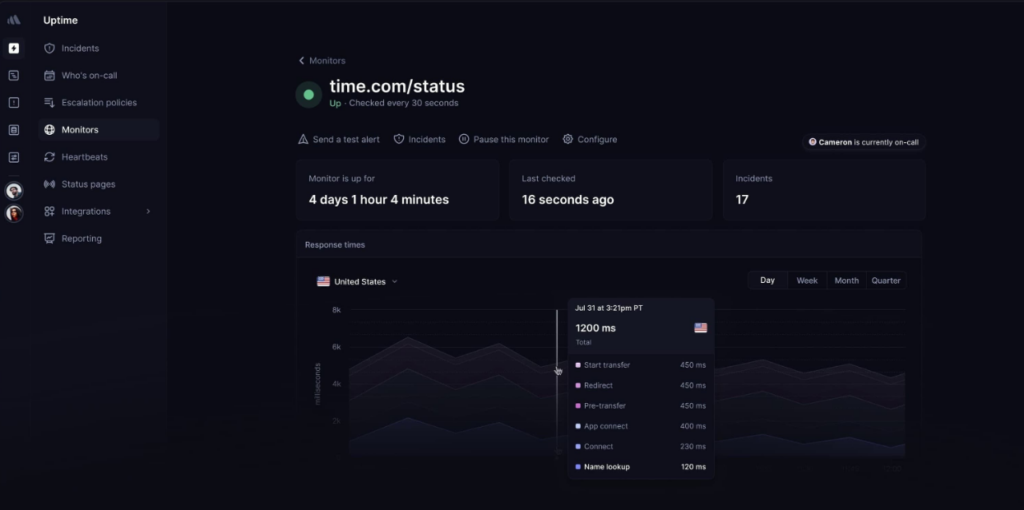
Better Stack packages uptime checking with on-call scheduling, status pages, and log management in one dashboard, so you’re not stitching a monitor to a separate incident-response tool.
Alerts escalate through voice calls and SMS as well as the usual chat integrations, which matters once a team has an actual on-call rotation rather than one person watching Slack.
The free plan includes 10 monitors with three-minute check intervals, one status page, and free access to Better Stack’s telemetry platform with usage limits. Paid Responder licenses start at $29 per user per month when billed annually and include on-call scheduling, incident management, and unlimited phone and SMS alerts.
Keep in mind that per-seat pricing can add up quickly as your on-call team grows.
| Pros | Cons |
| On-call scheduling bundled with monitoring | Per-seat pricing rises fast as the team grows |
| Voice call and SMS escalation included | Free plan limited to 10 monitors at 3-minute intervals |
| Log management included in one dashboard | No browser or synthetic Playwright testing |
| Status pages come with all plans | Expensive at scale versus flat-pricing alternatives |
| 30-second check intervals on paid plans |
4. Postman
Source: Postman dashboard
Best for: API development teams that want to run monitoring on top of collections they’ve already built.
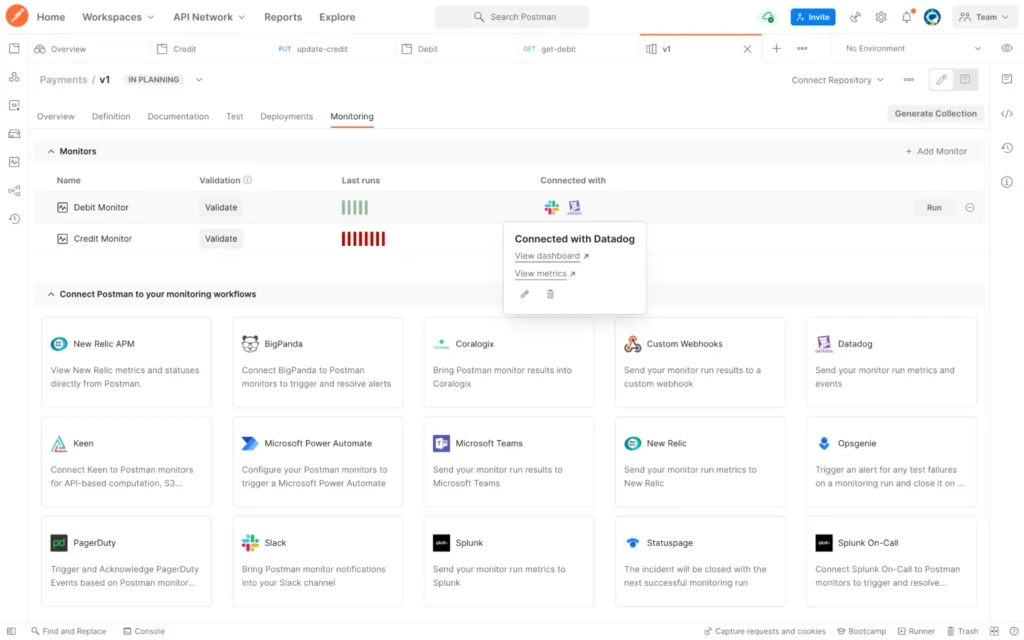
Postman is the tool most API developers already have open, and its Monitors feature runs existing collections on a schedule instead of requiring new checks from scratch.
This is a good feature for multi-step workflows: logging in, extracting a JWT, using that token to fetch a resource, and validating the final schema in the same run. That kind of chained check catches breaks a single endpoint ping would miss entirely.
The Free plan is limited to a single user, while paid plans start at $9/month for Solo, $19 per user/month for Team, and $49 per user/month for Enterprise, all billed annually. Some capabilities, including API monitoring, are usage-based on paid plans.
Since monitoring here is bolted onto an API-development workflow rather than purpose-built for uptime alerting, teams whose main need is a dedicated availability layer often pair Postman’s collections with a focused monitor like UptimeRobot for core checks.
| Pros | Cons |
| Reuses existing API collections, no new checks to write | Free plan is now single-user only |
| Multi-step workflow testing including auth flows and token extraction | Monitoring is an add-on to a dev tool, not purpose-built for uptime |
| Familiar interface for teams already in Postman | Team plan at $19/user/mo adds up for larger teams |
| Mock servers and test environments supported | No dedicated uptime alerting, often needs a companion tool |
5. Datadog
Source: Datadog dashboard
Best for: Enterprises that need a failed API check to connect directly to backend traces, logs, and application telemetry.
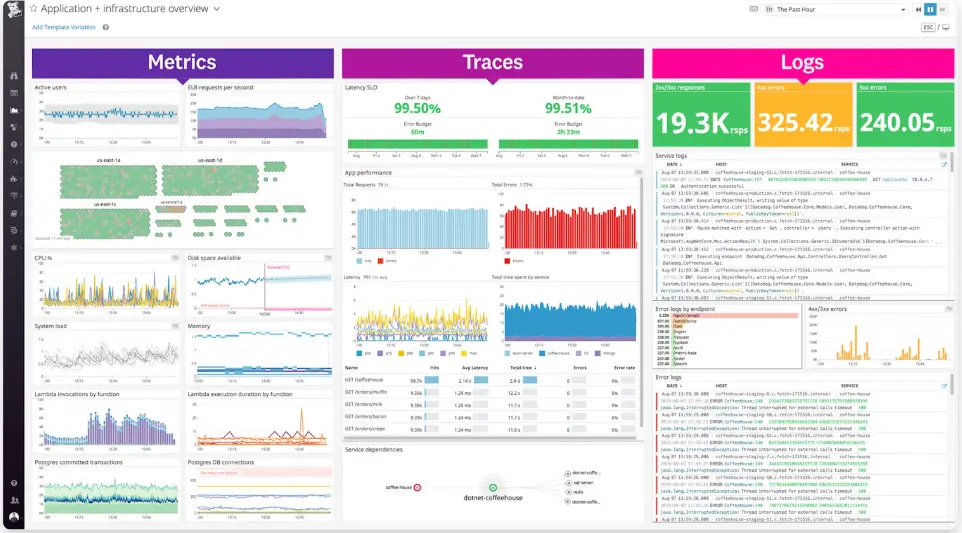
Datadog treats API monitoring as one input into a much larger observability picture. When a synthetic check fails, an engineer can click straight through to the trace or log line behind it, then trace the exact database query that caused the failure.
This is genuinely useful once your API sits on a sprawling microservices setup where the failure cause isn’t obvious from the check alone. It supports multi-step API tests, global monitoring locations, and SLO tracking alongside APM and log correlation.
Pricing starts at $5 per 10,000 API test runs per month when billed annually. Usage-based pricing scales well for large organizations but can become expensive for teams running frequent checks across multiple endpoints and locations.
| Pros | Cons |
| Failed check links directly to backend traces and logs | Usage-based pricing hard to predict for small teams |
| Global monitoring locations with SLO tracking | Overkill and overpriced for basic endpoint uptime |
| 850+ integrations with minimal setup | Per-module billing stacks quickly across features |
| Multi-step API tests with detailed assertions | Vendor lock-in risk increases as usage deepens |
6. New Relic
Source: New Relic dashboard
Best for: Teams already running New Relic APM that want synthetic API monitoring in the same platform.
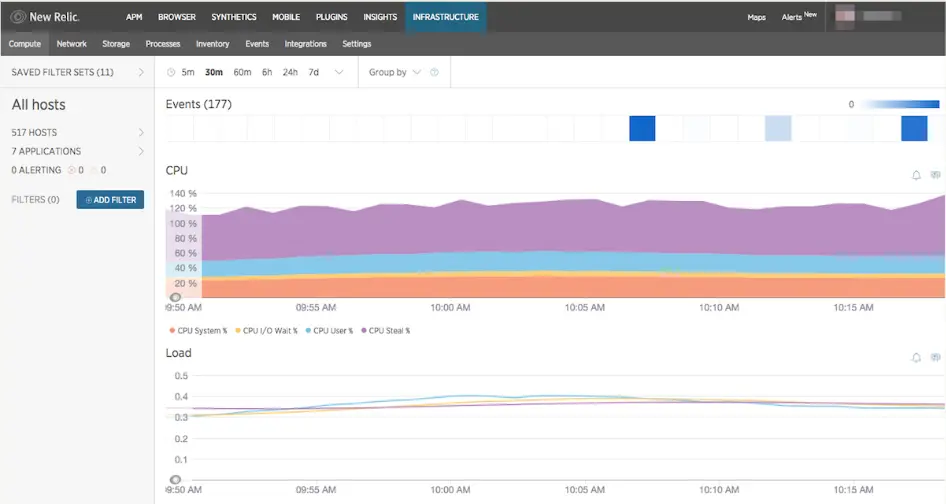
New Relic extends its observability platform with synthetic API monitoring, distributed tracing, and custom scripting, allowing teams to investigate failed checks alongside application telemetry.
Free accounts include 500 synthetic checks per month, while Standard includes 10,000, Pro 1 million, and Enterprise 10 million. Additional non-ping synthetic checks are billed at $0.005 per check.
That pricing model makes the most sense for teams already invested in the broader New Relic platform. For smaller organizations that only need API monitoring, costs can be harder to predict because they depend on synthetic usage alongside the wider platform.
| Pros | Cons |
| 500 free synthetic checks per month | Usage-based pricing can be difficult to predict |
| Tight integration with APM and distributed tracing | Best value for teams already using New Relic |
| Custom scripting for complex check scenarios | Additional synthetic checks billed at $0.005 each |
| Unified platform for synthetics, logs, metrics, and traces | Broader platform can be more than smaller teams need |
7. Pingdom
Source: Pingdom dashboard
Best for: Enterprise IT teams that need Real User Monitoring alongside synthetic uptime checks.
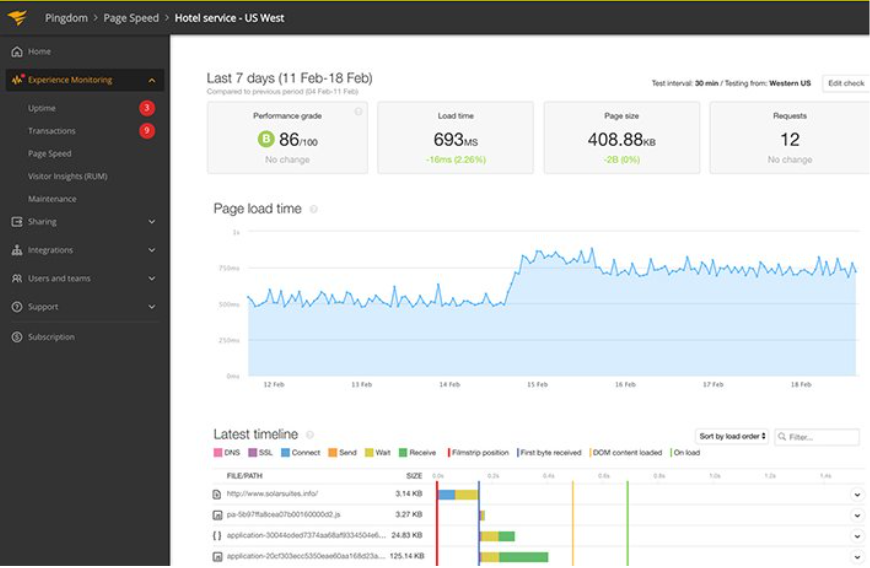
Pingdom, now owned by SolarWinds, has been running uptime checks longer than almost anyone else on this list and is still trusted by enterprise IT teams for its Real User Monitoring alongside synthetic transaction checks.
While newer competitors have expanded into broader observability platforms, Pingdom remains focused on uptime monitoring, synthetic transaction monitoring, and Real User Monitoring. Organizations that already use SolarWinds products may also appreciate the familiarity and integration within the wider ecosystem.
There’s no permanent free plan, only a 30-day trial. The Starter tier runs $10/month billed annually for 10 uptime checks and 50 SMS alerts, scaling to $40/month for 50 checks on the Standard tier.
| Pros | Cons |
| Real User Monitoring alongside synthetic uptime checks | No permanent free plan, only a 30-day trial |
| Long track record trusted by enterprise IT | More expensive than UptimeRobot for equivalent monitor count |
| Mobile app for on-the-go alerts | Owned by SolarWinds, some teams prefer independent vendors |
| Transaction monitoring for multi-step user flows | Interface looks dated compared to newer tools |
8. StatusCake
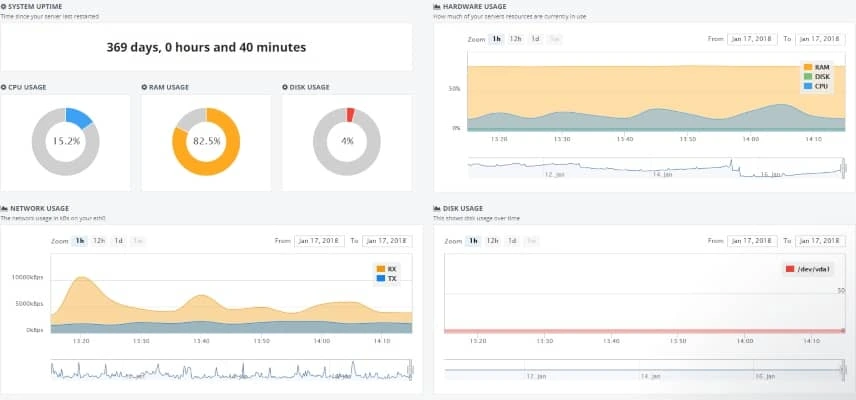
StatusCake dashboard
Best for: UK and EU businesses with data residency requirements or teams needing SSL, domain, and server monitoring alongside API and uptime checks.
StatusCake has built a following in the UK and EU on the strength of data residency and compliance options that matter under European regulations. Its core plans bundle SSL, domain, server performance, and uptime monitoring into a single platform.
In addition to API and website monitoring, StatusCake offers page speed testing, global monitoring locations, public status pages, and alerting through email, SMS, Slack, Microsoft Teams, PagerDuty, webhooks, and other integrations. That combination appeals to teams that want to monitor websites, APIs, SSL certificates, and server performance from the same dashboard.
The free tier includes one SSL monitor. Paid plans start with the Superior plan at $24/month, which includes 100 uptime monitors checked every minute.
| Pros | Cons |
| EU/UK data residency options for compliance-sensitive teams | Higher entry price than UptimeRobot for equivalent coverage |
| SSL, domain, and server monitoring bundled in core plans | Limited global name recognition outside UK/EU |
| 100 monitors at 1-minute intervals on Superior plan | Free tier limited to 1 SSL monitor |
| Includes page speed monitoring | Feature depth thinner than enterprise alternatives |
9. Site24x7
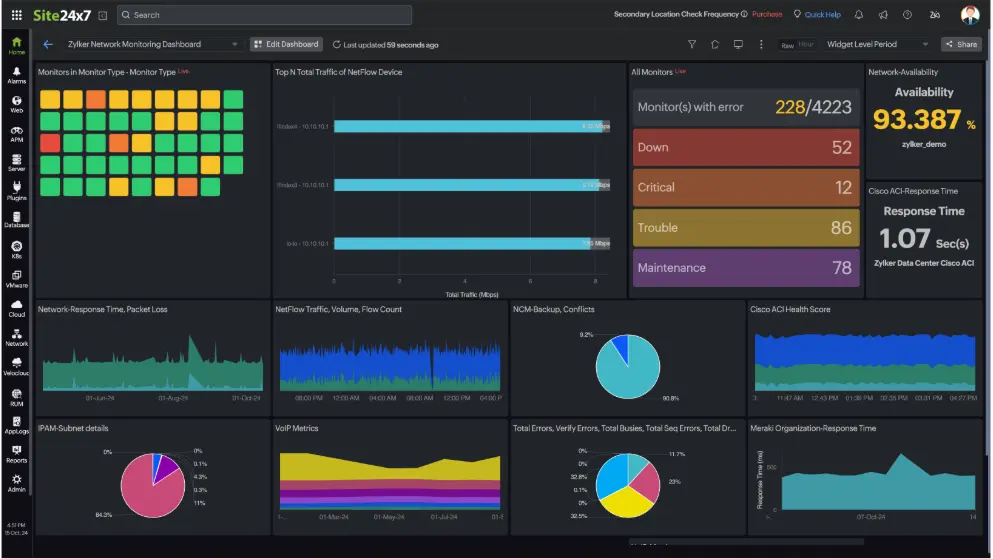
Source: Site24x7 dashboard
Best for: Cost-conscious IT teams that need API monitoring as part of a broader infrastructure monitoring platform.
Site24x7, part of the Zoho suite, treats API monitoring as one piece of a much bigger platform that also covers servers, networks, and cloud infrastructure.
Its REST API Monitor supports bulk-importing endpoints from HAR and CSV files or Swagger definitions, a real time-saver when you’re onboarding dozens of routes at once.
Beyond API monitoring, Site24x7 includes infrastructure, cloud, application, network, log, and Real User Monitoring in the same platform. Teams already using those capabilities can monitor APIs without adopting another tool, though organizations that only need uptime and API monitoring may find the broader platform more complex than necessary.
Paid plans start at $10/month (or $9/month billed annually) with the Lite plan, which includes multiple website and server monitors and supports REST API monitoring as a basic monitor.
| Pros | Cons |
| Covers servers, networks, and cloud alongside APIs | Platform breadth adds complexity for API-only teams |
| Bulk import from HAR, CSV, and Swagger definitions | No explicitly free plan |
| Competitive $10/mo entry price for 10 monitors | Less API-specialist depth than Checkly or Datadog |
| AIOps capabilities on higher tiers | Tied to the Zoho ecosystem |
10. Prometheus + Blackbox Exporter
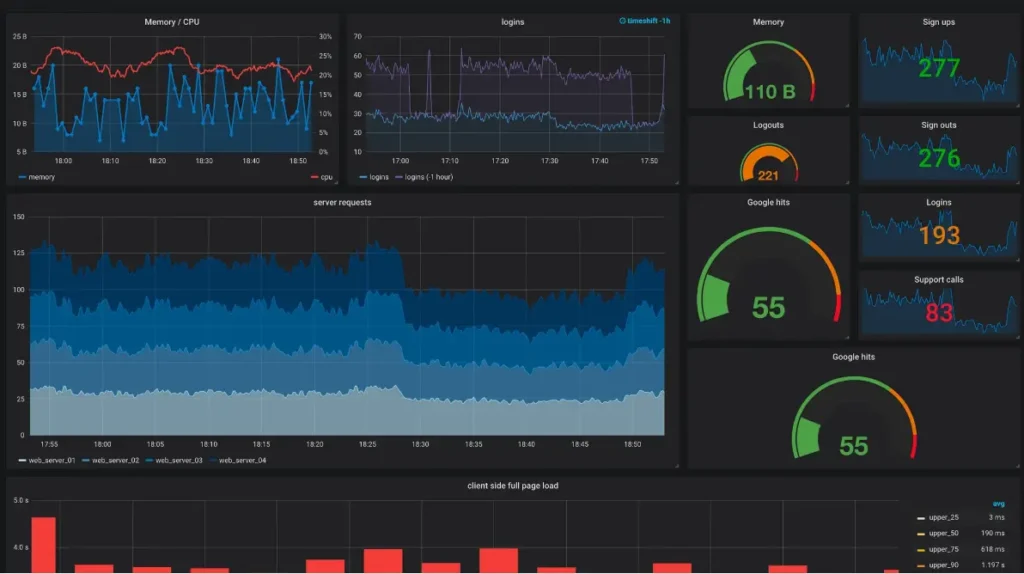
Source: Prometheus + Grafana dashboard
Best for: Teams with existing Prometheus and Grafana infrastructure that want full self-hosted control over monitoring data.
Prometheus paired with the Blackbox Exporter is one of the most flexible open source options for teams with existing operations expertise. It runs entirely on your own infrastructure, results are queried with PromQL and visualized in Grafana, and there are no per-check charges.
It’s also the only self-hosted option on this list. That gives teams complete control over monitoring data and retention, but also means maintaining the exporter, scraping infrastructure, and alerting rules themselves.
Many organizations pair it with a hosted platform such as UptimeRobot for external monitoring, since a self-hosted monitoring stack can’t reliably alert you if the infrastructure it’s runs on is the part that fails.
| Pros | Cons |
| Completely free and open source | Requires ops expertise to configure and maintain |
| Full control over data retention and storage | Monitoring infra fails if it runs on the stack it monitors |
| No per-check billing, scales to any volume | No hosted SaaS option, no vendor support |
| Integrates natively with existing Prometheus and Grafana | Alert rules, scrape configs, and dashboards all built manually |
Core features to look for in an API monitoring tool
Most API monitoring tools check whether an endpoint is available, but the best platforms go further by validating responses, measuring performance, and notifying the right people when something goes wrong. As you compare tools, look for these capabilities:
- Multi-location monitoring: Verifies whether an outage is global or limited to a specific region, helping reduce false alerts.
- Response time tracking: Measures latency over time so you can spot performance issues before they become outages.
- Response validation: Confirms status codes, headers, JSON payloads, or keywords instead of simply checking whether an endpoint responds.
- Support for modern APIs: REST support is essential, while GraphQL, SOAP, and WebSocket monitoring may be important depending on your stack.
- SSL certificate monitoring: Warns about expiring certificates before they interrupt your services.
- Alerting and integrations: Look for alerts through email, SMS, Slack, Microsoft Teams, webhooks, PagerDuty, or other tools your team already uses.
- Dashboards and status pages: Historical reporting and public or private status pages make it easier to communicate incidents and identify long-term trends.
How to choose the right API monitoring tool
The best API monitoring tool depends on your team’s size, technical requirements, and existing infrastructure. Before making a decision, consider these questions:
- How much monitoring do you need? Simple uptime checks require a very different platform than multi-step API testing or full observability.
- Who will manage the monitors? Some tools prioritize fast, no-code setup, while others are designed for monitoring-as-code and Git-based workflows.
- Will your team grow? Compare pricing carefully. Some platforms charge by monitor count, while others charge per user or based on usage.
- Which integrations matter? Make sure the platform works with your existing alerting, incident management, and collaboration tools.
- Do you need a hosted or self-hosted solution? Hosted platforms get you monitoring quickly, while self-hosted tools provide greater control at the cost of additional maintenance.
For many teams, a hosted platform offers the best balance of simplicity, reliability, and cost. If you want to start monitoring APIs in minutes without managing your own infrastructure, UptimeRobot provides API monitoring, response validation, alerting, status pages, and a free plan with 50 monitors to get started.
-
UptimeRobot offers the best mix of speed, price, and coverage: a basic check takes under a minute to set up, the free plan covers 50 monitors, and paid tiers scale gradually rather than jumping to enterprise pricing. Checkly suits developers who want monitors written in code and pushed through CI/CD. Datadog or New Relic make more sense once you need a failed check to trace straight to a backend log.
-
Checkly and Datadog go furthest here because they break latency down by phase rather than just confirming an endpoint responded. If you only need basic response-time tracking alongside uptime checks, UptimeRobot already covers time to first byte and total round-trip time without added complexity.
-
Most tools push alerts through Slack, email, and SMS, with webhook support for routing into whatever system a team already uses. More mature platforms add on-call rotations and escalation policies so a specific person gets paged. Better Stack bundles on-call scheduling directly with monitoring, including voice call escalation.