TL;DR (QUICK ANSWER)
Pingdom remains a strong uptime monitoring platform, but it’s no longer the default choice for every team. UptimeRobot is one of the best alternatives for organizations that want simple uptime monitoring and predictable pricing, while Better Stack adds incident management and on-call workflows. Teams with self-hosting requirements should consider Uptime Kuma or OneUptime, and larger engineering organizations may benefit from observability platforms like Datadog or New Relic.
Pingdom by SolarWinds remains one of the best-known uptime monitoring platforms on the market. It offers uptime checks, synthetic monitoring, alerting, and performance reporting for websites and applications.
Many teams are looking for something different. A simpler uptime monitoring tool with predictable pricing is often the goal, while built-in incident management, self-hosted deployment, and broader infrastructure visibility are becoming increasingly important requirements for others.
In this guide, we’ll compare the best Pingdom alternatives across several categories, including self-hosted monitoring, lightweight uptime monitoring, incident management platforms, and enterprise observability tools.
| Tool | Best for | Deployment | Starting price | Free plan | Key advantage over Pingdom |
| UptimeRobot | Lightweight uptime monitoring | SaaS | $9/mo | Yes | Faster setup, simpler workflows, generous free plan |
| Better Stack | Incident management | SaaS | $29/mo/seat | Limited | Built-in on-call scheduling and incident response |
| Uptime Kuma | Self-hosted monitoring | Self-hosted | Free | N/A | Full infrastructure ownership and open-source flexibility |
| OneUptime | Monitoring + incident response | SaaS & self-hosted | $20/user/mo | Yes | Combines monitoring, status pages, and incident workflows |
| Updown.io | Minimalist uptime monitoring | SaaS | Pay-as-you-go | No | Extremely lightweight and developer-friendly |
| Uptrends | Synthetic monitoring | SaaS | $42/mo | No | Stronger transaction testing and reporting |
| Site24x7 | Infrastructure monitoring | SaaS | $9/mo | No | Broader cloud, server, and network visibility |
| Datadog | Full observability | SaaS | $15/host/mo | Limited | Deep telemetry, tracing, and infrastructure visibility |
| New Relic | Application observability | SaaS | Usage-based | Yes | Stronger application performance monitoring and debugging |
| Gatus | Monitoring-as-code | Self-hosted | Free | N/A | YAML-based configuration and infrastructure-as-code workflows |

Key takeaways
- UptimeRobot is one of the easiest Pingdom alternatives for teams that want fast setup, predictable pricing, and reliable uptime monitoring without a broader observability stack.
- Self-hosted alternatives such as Uptime Kuma and OneUptime appeal to organizations that require greater control over infrastructure and data.
- Better Stack combines uptime monitoring, incident management, on-call scheduling, and status pages in a single platform.
- Datadog and New Relic are best suited for organizations that need full observability across applications, infrastructure, logs, and telemetry.
Why teams look for Pingdom alternatives
Reviewers consistently praise Pingdom’s ease of use, uptime checks, page speed testing, waterfall analysis, transaction monitoring, and historical reporting capabilities.
Most teams evaluating alternatives aren’t leaving because Pingdom is bad. They’re reassessing whether it still fits their requirements, budget, and infrastructure strategy.
Pricing becomes harder to justify as monitoring needs grow
Pricing is one of the most frequently discussed topics across Pingdom reviews. While the platform’s entry-level plans remain accessible, reviewers on TrustRadius, Software Advice, and Capterra frequently mention that costs become harder to justify as monitoring requirements expand.
Several reviewers specifically call out the jump between monitor tiers, with one Software Advice reviewer noting that “the moment you cross 10 [monitors] your plan price nearly triples.” Others describe Pingdom as “pricey for what you get” compared to newer alternatives.
For smaller teams, the removal of Pingdom’s free plan also prompted many users to evaluate alternative monitoring platforms, as noted in this BuyerSprint review.
Modern teams often need more than uptime monitoring
Pingdom remains focused on uptime monitoring, synthetic monitoring, real user monitoring (RUM), and performance reporting. For many organizations, that’s enough.
However, many teams need capabilities that sit outside Pingdom’s core offering, including:
- On-call scheduling
- Escalation policies
- Incident management
- Log management
- Application performance monitoring (APM)
As a result, engineering teams frequently combine Pingdom with tools such as PagerDuty, Statuspage, Datadog, or New Relic. Comparison analyses from OneUptime, Hyperping, and CubeAPM highlight this as one of the main reasons teams evaluate alternatives that combine monitoring and incident response within a single platform.
Some organizations require self-hosted deployment
Another reason teams consider Pingdom alternatives is deployment flexibility.
Pingdom is a SaaS-only platform. While that works well for many organizations, others operate under compliance requirements, data residency policies, security restrictions, or infrastructure ownership preferences that make self-hosted monitoring a requirement.
In those environments, platforms such as Uptime Kuma, OneUptime, and Gatus offer a fundamentally different approach by allowing organizations to run monitoring infrastructure inside their own environment.
Ultimately, most teams are not leaving Pingdom because it is a poor monitoring platform. They’re choosing tools that better match their preferred pricing model, workflows, or deployment requirements.
It’s also worth noting that Pingdom continues to receive strong reviews for transaction monitoring, waterfall analysis, multi-location testing, and historical reporting. Many organizations still consider these among the platform’s biggest strengths, even while evaluating newer alternatives.
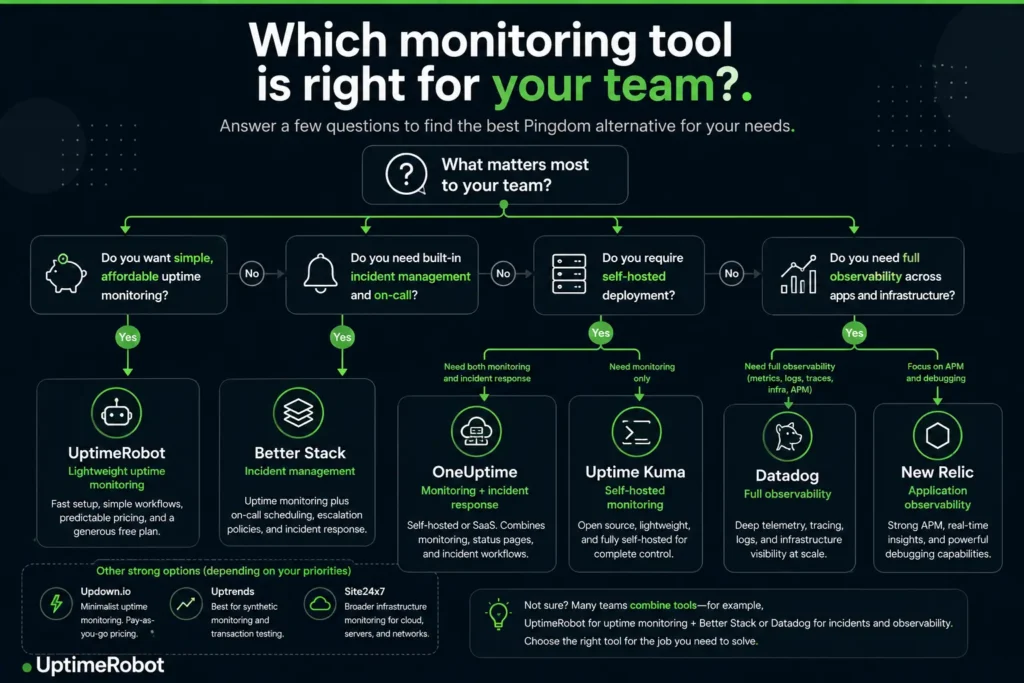
Which monitoring tool is best for your team?
The best alternatives for simple uptime monitoring
While observability platforms have expanded into tracing, telemetry, infrastructure analytics, and incident response, many teams still prefer dedicated uptime monitoring tools. For organizations focused primarily on availability, a simpler tool often means faster deployment, less maintenance, and lower costs.
1. UptimeRobot
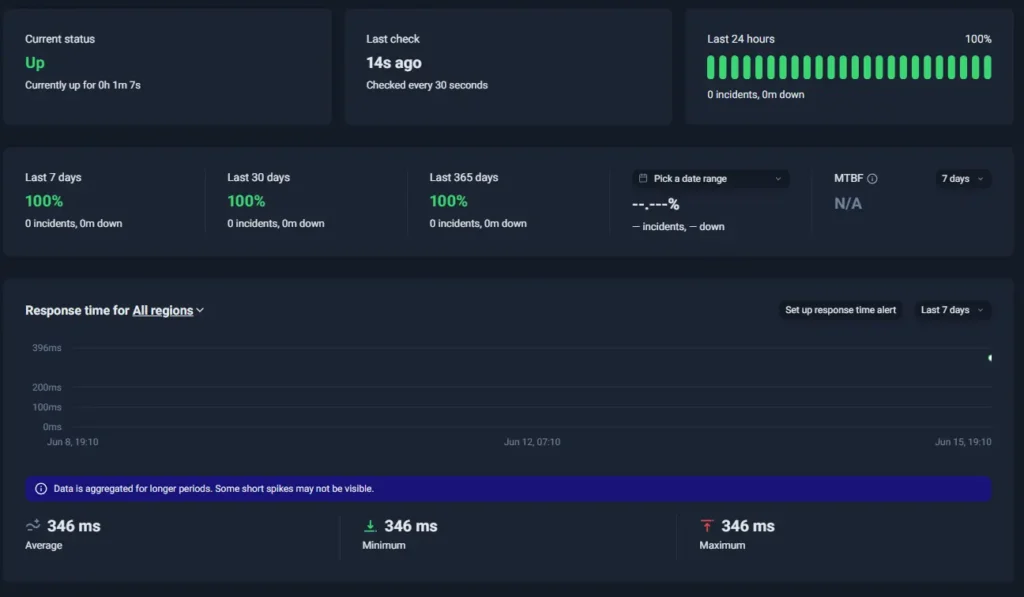
UptimeRobot dashboard
Best for: Teams that want reliable external monitoring without the cost and complexity of a larger monitoring platform.
UptimeRobot takes a much narrower approach than Pingdom, and for many teams, that’s exactly the appeal.
While Pingdom has expanded into synthetic monitoring, real user monitoring (RUM), transaction testing, and performance reporting, UptimeRobot stays focused on external uptime visibility, alerting, and operational awareness.
Setup is fast, the interface is straightforward, and teams can typically start monitoring production services within minutes rather than spending time configuring more complex monitoring workflows.
The platform supports:
- Website and endpoint monitoring
- API monitoring
- SSL certificate monitoring
- DNS, ping, UDP, and port monitoring
- Cron job monitoring
- Keyword monitoring
- Domain expiration monitoring
- Public status pages
UptimeRobot also supports a broad range of integrations and alerting channels, including Slack, Microsoft Teams, Discord, Telegram, PagerDuty, webhooks, SMS, voice calls, and Splunk.
That simplicity is a major reason the platform is widely used by:
- Developers
- DevOps teams
- IT teams
- Agencies
- Support teams
- SaaS companies
- Internal operations teams
Pricing is another major differentiator.
One of the most common reasons teams start evaluating Pingdom alternatives is cost. While Pingdom’s entry-level plans remain accessible, many reviewers note that pricing becomes harder to justify as monitoring requirements grow.
UptimeRobot’s Free plan includes up to 50 monitors with 5-minute monitoring intervals, making it one of the most generous free offerings in the uptime monitoring space.
Paid plans start at $9/month and unlock faster monitoring intervals, additional integrations, advanced alerting capabilities, and more status page customization options. Monitoring intervals can be reduced to as little as 30 seconds on higher plans.
For teams migrating from Pingdom, UptimeRobot also offers bulk monitor imports, making it easier to move large monitoring environments without rebuilding every monitor manually.
Organizations that rely heavily on synthetic monitoring, real user monitoring, or advanced performance analysis may still prefer Pingdom, Uptrends, Datadog, or New Relic.
For many teams, however, the biggest advantage is precisely what UptimeRobot doesn’t try to be. Instead of functioning as an all-in-one observability platform, it focuses on delivering reliable uptime monitoring, fast alerting, and simple operational visibility without unnecessary complexity.
| Pros | Cons |
| Free plan includes 50 monitors with 5-minute checks | Limited observability and APM capabilities |
| Fast setup with no credit card required | Less synthetic monitoring depth than Pingdom |
| Supports website, API, SSL, DNS, ping, port, cron, keyword, and domain monitoring | No real user monitoring (RUM) |
| Bulk monitor imports simplify migrations and large deployments | Limited infrastructure analytics |
| Broad integration ecosystem with Slack, Teams, Discord, Telegram, PagerDuty, webhooks, SMS, and voice alerts | May feel too lightweight for large enterprise environments |
| Public status pages and flexible alerting options | Not designed for deep cloud-native observability |
2. Updown.io
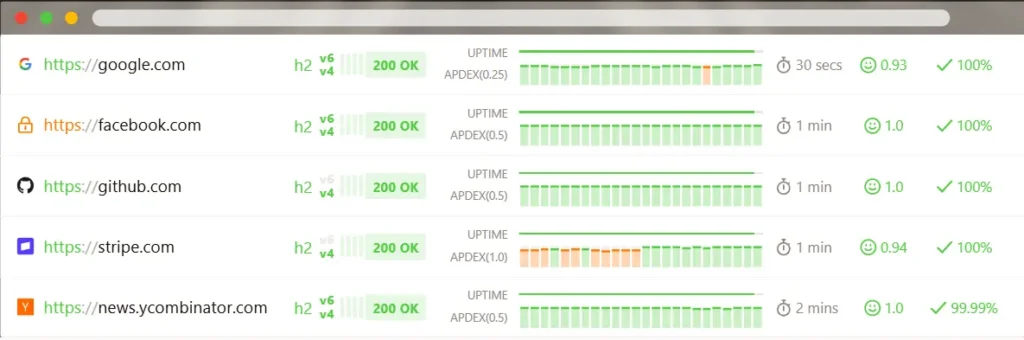
Source: Updown.io dashboard example
Best for: Developers and smaller teams that want minimal overhead and extremely focused uptime monitoring
Updown.io takes the opposite approach from large monitoring suites.
Instead, the platform stays intentionally narrow. The focus is almost entirely on uptime checks, response monitoring, SSL tracking, and alerting.
There are fewer dashboards, fewer workflows, and far less configuration involved overall. Many developers prefer it specifically because it avoids turning uptime monitoring into a larger operational system that requires ongoing management.
Features include:
- HTTP and HTTPS monitoring
- API monitoring
- SSL monitoring
- Response time tracking
- Status pages
- Webhook integrations
- Email and SMS alerts
Pricing is also much easier to understand compared to traditional monitor-tier pricing structures. That becomes particularly appealing for smaller environments that mainly want straightforward uptime visibility without navigating enterprise monitoring plans or synthetic-monitoring-heavy pricing models.
However, teams needing synthetic browser testing, advanced incident coordination, or cloud observability will likely outgrow it relatively quickly.
But for developers, smaller SaaS products, internal services, and lean operational environments, that stripped-down approach is often exactly the point.
| Pros | Cons |
| Simple and developer-friendly | Limited feature depth |
| Extremely lightweight operational footprint | Minimal synthetic monitoring |
| Straightforward pricing | Smaller integration ecosystem |
| Fast setup and low maintenance overhead | Less suited for enterprise environments |
The best alternatives for self-hosted monitoring
Some organizations are moving away from SaaS monitoring platforms entirely.
Teams with stricter compliance requirements, infrastructure ownership policies, customization needs, or data residency concerns often prefer self-hosted monitoring tools they can fully control themselves.
3. Uptime Kuma
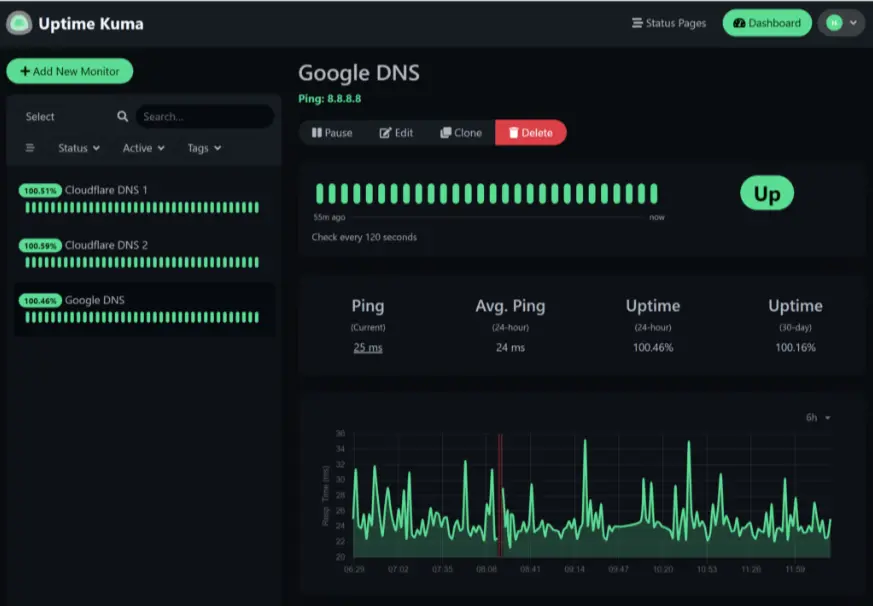
Source: Uptime Kuma dashboard example
Best for: Teams that want full control over a self-hosted monitoring environment
Uptime Kuma became one of the most widely adopted self-hosted uptime monitoring projects partly because it modernized an area of monitoring software that historically felt clunky and outdated.
Unlike Pingdom, Uptime Kuma runs entirely inside your own infrastructure. That immediately changes the operational conversation. Instead of paying recurring SaaS monitoring costs and relying on external vendors, teams gain direct control over deployment, configuration, data handling, and customization.
The flexibility makes Uptime Kuma especially appealing for:
- Self-hosted environments
- Privacy-focused organizations
- Internal infrastructure teams
- Homelab setups
- Organizations with compliance or data residency concerns
The platform supports:
- Website and endpoint monitoring
- Ping, TCP, and port monitoring
- SSL certificate monitoring
- DNS monitoring
- Keyword monitoring
- Database monitoring
- Docker container monitoring
- Public status pages
- Multiple notification integrations
Deployment is relatively straightforward for teams already comfortable with Docker and self-managed infrastructure, and the interface feels much cleaner and more modern than many legacy self-hosted monitoring platforms.
Teams needing deep transaction simulations, customer-journey testing, or broader infrastructure analytics will likely still prefer SaaS monitoring platforms with larger ecosystems and more mature reporting capabilities.
But for teams prioritizing infrastructure ownership, flexibility, and self-hosted control, Uptime Kuma fills a very different role than traditional SaaS uptime monitoring platforms.
| Pros | Cons |
| Free and open-source | Requires self-hosting and maintenance |
| Clean and modern interface | Limited enterprise reporting |
| Strong community adoption | Less synthetic monitoring depth than Pingdom |
| Flexible notification integrations | Smaller ecosystem than major SaaS platforms |
4. OneUptime
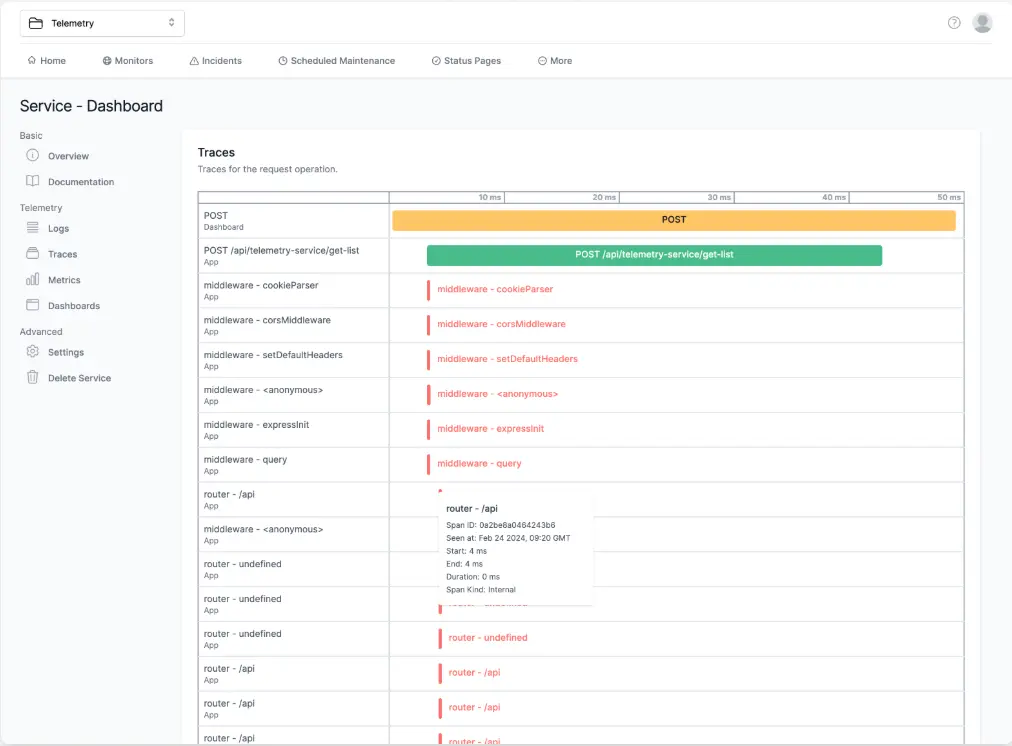
Source: OneUptime dashboard example
Best for: Teams that want monitoring and incident-management workflows inside the same platform
OneUptime positions itself differently from traditional uptime monitoring tools like Pingdom.
The platform combines uptime monitoring with incident management, escalation workflows, on-call scheduling, and status-page coordination.
The platform includes:
- Uptime monitoring
- Incident management
- On-call scheduling
- Alert escalation workflows
- Status pages
- Self-hosted deployment options
Compared to Pingdom, OneUptime feels much more operations-oriented. The platform spends less time emphasizing synthetic monitoring depth and more time focusing on what happens after an alert fires.
Self-hosting is another major differentiator. OneUptime can run inside your own infrastructure, which makes it more attractive for organizations prioritizing infrastructure ownership, compliance, or deployment flexibility.
OneUptime is newer, has a smaller ecosystem overall, and is still evolving rapidly compared to larger legacy monitoring vendors.
For teams trying to consolidate monitoring and incident coordination into a single operational platform, OneUptime offers a very different value proposition than traditional uptime-monitoring-first tools.
| Pros | Cons |
| Combines monitoring and incident management | Smaller ecosystem than Pingdom |
| Self-hosted deployment available | Less mature than older monitoring vendors |
| Built-in status pages and escalation workflows | Fewer synthetic monitoring capabilities |
| Strong operational workflow focus | Smaller integration footprint |
5. Gatus
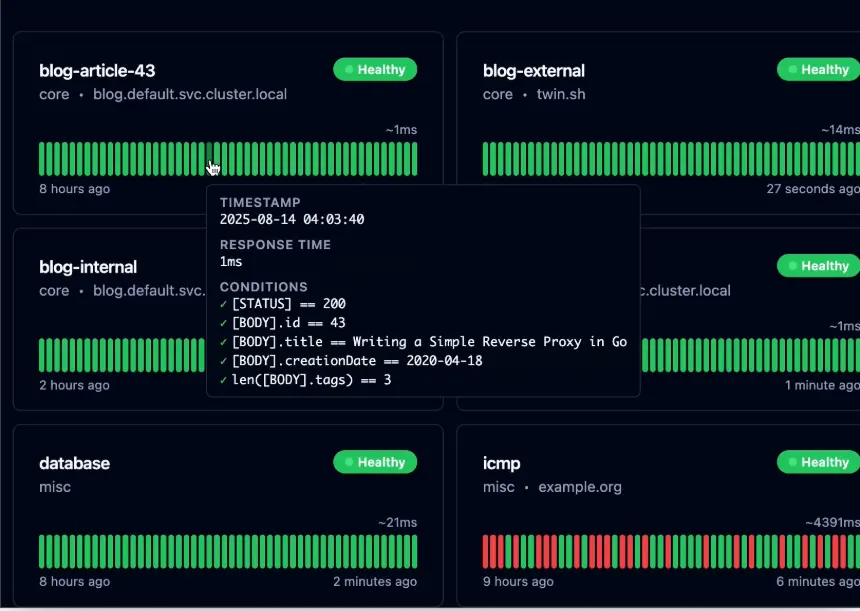
Source: Gatus dashboard example
Best for: Technical teams that prefer monitoring-as-code and lightweight self-hosted deployments
Gatus takes a very different approach from Pingdom and most traditional uptime monitoring platforms, and is built around YAML-based configuration and infrastructure-as-code principles.
For engineering teams already managing infrastructure through Git repositories, CI/CD pipelines, and automated deployments, this approach can feel significantly more natural than configuring monitors through a web interface.
The platform supports:
- HTTP and HTTPS monitoring
- TCP monitoring
- DNS monitoring
- ICMP monitoring
- SSH monitoring
- WebSocket monitoring
- gRPC monitoring
- Health checks and condition-based monitoring
- Status pages
- Alerting integrations
Gatus is entirely self-hosted and open source. Monitoring configurations can be stored in version control, reviewed through pull requests, and deployed alongside the rest of an organization’s infrastructure.
Gatus prioritizes flexibility and infrastructure ownership over convenience. Teams that want complete control over their monitoring stack often find that approach appealing, especially when compliance requirements, data residency concerns, or internal hosting policies make SaaS tools less attractive.
The platform, however, does require a more hands-on approach than Pingdom, UptimeRobot, or Better Stack. There are no polished onboarding flows, built-in synthetic monitoring capabilities, or customer-friendly reporting features. Teams are expected to be comfortable working with configuration files and managing their own monitoring infrastructure.
| Pros | Cons |
| Lightweight and open source | Requires technical setup and maintenance |
| Strong monitoring-as-code workflows | Steeper learning curve than Pingdom or Uptime Kuma |
| Excellent fit for DevOps and platform engineering teams | Minimal UI compared to SaaS monitoring platforms |
| Flexible self-hosted deployment | No built-in synthetic monitoring or RUM |
| Easy to integrate into CI/CD workflows | Limited enterprise reporting and analytics |
The best alternatives for operational workflows and incident management
For some organizations, uptime monitoring is only one part of the equation. They also need incident response workflows, on-call scheduling, status pages, and synthetic monitoring.
Better Stack, Uptrends, and Site24x7 combine more of those capabilities into a single platform, reducing the need for multiple tools.
6. Better Stack
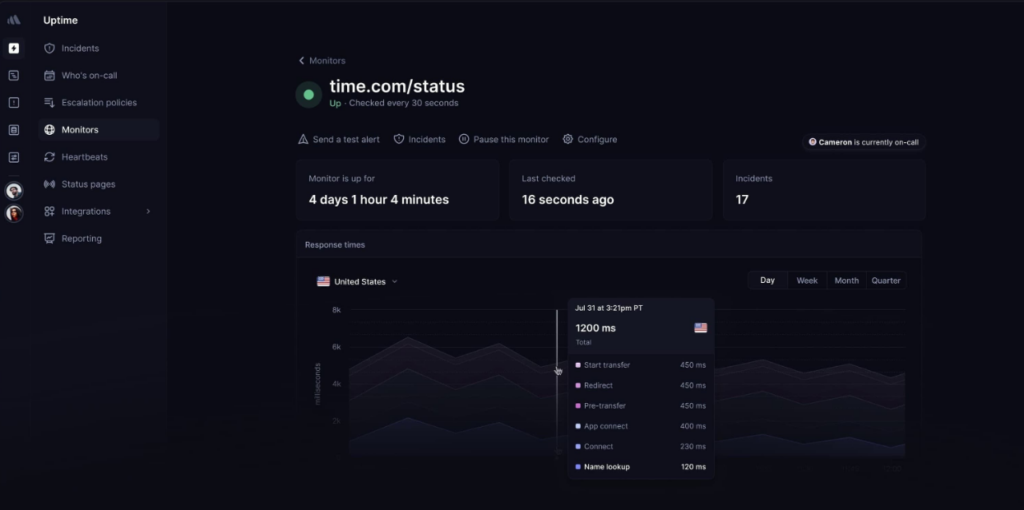
Source: Better Stack uptime monitoring dashboard example
Best for: Teams that want monitoring, incident response, and operational coordination inside one platform
Better Stack combines uptime monitoring, incident management, on-call scheduling, status pages, log management, and team collaboration tools in a single platform.
The platform includes:
- Uptime monitoring
- Incident management
- On-call scheduling
- Escalation workflows
- Status pages
- Log management
- Team collaboration workflows
Many organizations end up building workflows across several products. Monitoring alerts come from one platform, incident escalation happens in another, and customer updates are managed somewhere else.
Better Stack brings those functions together. Teams can detect incidents, notify responders, coordinate investigations, and communicate status updates without switching between multiple tools. That approach has made the platform particularly popular with DevOps and SRE teams looking to simplify their operational stack.
Compared to Pingdom, Better Stack places much greater emphasis on incident response and operational workflows. Monitoring is only one part of the product. The platform is made to manage the entire lifecycle of an outage, from detection through resolution and communication.
Organizations primarily looking for uptime checks, SSL monitoring, and alerting may find Better Stack broader than they need. Features such as log management, on-call scheduling, and incident response add capabilities that many smaller teams never use.
| Pros | Cons |
| Strong incident management workflows | Log management pricing can scale quickly |
| Built-in on-call scheduling and escalations | More operational complexity than lightweight uptime tools |
| Modern UI and collaboration workflows | Less focused on synthetic monitoring depth than Pingdom |
| Combines multiple operational tools in one platform | Can feel excessive for smaller teams |
7. Uptrends
Source: Uptrends dashboard example
Best for: Organizations that depend on synthetic monitoring, transaction testing, and customer journey validation
Not every monitoring problem looks like downtime.
Websites can remain technically available while customers struggle with failed logins, broken checkout flows, slow page loads, or third-party integrations that stop working. Uptrends is designed to detect those kinds of issues through synthetic monitoring and real-browser testing.
Uptrends supports:
- Synthetic transaction monitoring
- Real-browser testing
- Customer journey simulation
- Multi-step transaction checks
- Global monitoring locations
- Performance monitoring
- Reporting and SLA tracking
Uptrends lets teams simulate real user behavior across websites and applications. Rather than checking whether a page responds, organizations can monitor complete workflows such as account logins, product searches, shopping carts, and checkout processes.
Uptrends generally offers deeper transaction testing and synthetic monitoring capabilities. Organizations that rely heavily on customer journey validation often appreciate the additional flexibility, browser testing options, and reporting depth.
Those capabilities come with more configuration, more maintenance, and higher costs than tools such as UptimeRobot or Updown.io. Teams focused primarily on uptime checks and alerting may find the additional complexity difficult to justify.
In organizations where a broken checkout flow can be as damaging as an outage, however, Uptrends remains one of the closest alternatives to Pingdom’s traditional approach to monitoring.
| Pros | Cons |
| Strong synthetic monitoring capabilities | More operational complexity than lightweight uptime tools |
| Real-browser transaction testing | Pricing can scale quickly |
| Comprehensive reporting and SLA tracking | Larger learning curve |
| Excellent customer journey validation | Requires more setup and maintenance |
| Strong fit for enterprise monitoring environments | Can feel excessive for basic uptime monitoring |
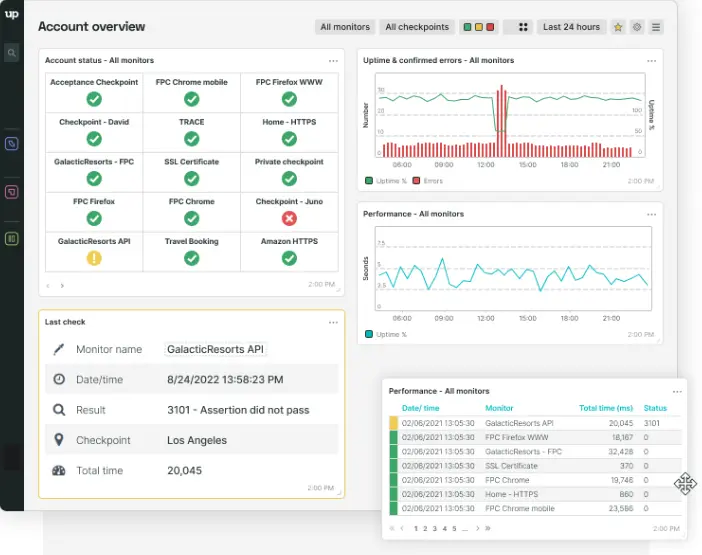
8. Site24x7
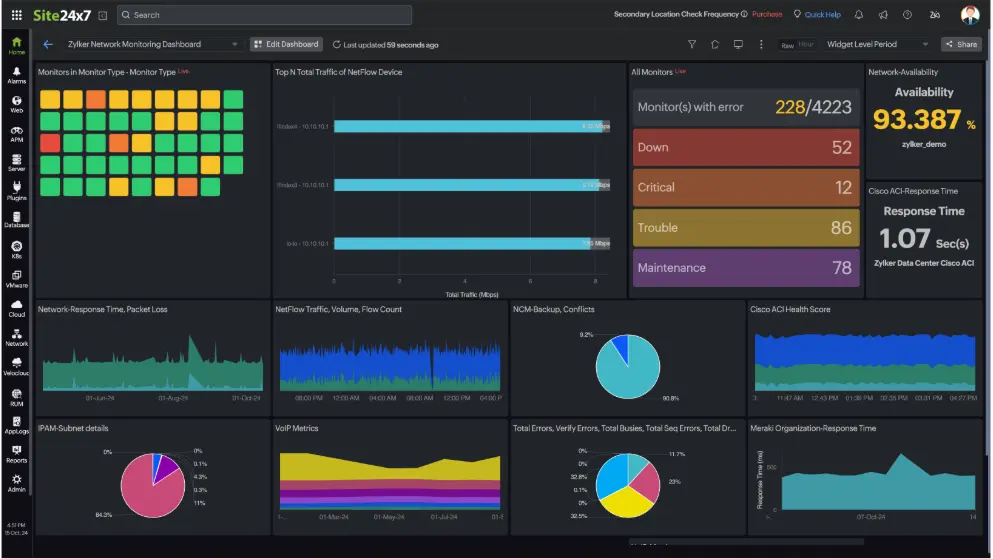
Source: Site 24×7 dashboard example
Best for: Organizations that want infrastructure, cloud, and uptime monitoring in a single platform
Knowing that a website is down is useful. Knowing whether the problem originated in a server, network device, cloud service, database, or application is often even more valuable.
Site24x7 is designed for teams that need visibility beyond uptime checks. Rather than focusing exclusively on availability monitoring, the platform brings together infrastructure monitoring, application performance monitoring, cloud monitoring, and network visibility in a single environment.
This platform includes:
- Visibility into servers, networks, and infrastructure health
- Cloud monitoring for AWS, Azure, and hybrid environments
- Application performance monitoring
- Synthetic monitoring and real user monitoring (RUM)
- Alerting, reporting, and incident workflows
- Public status pages
Teams can monitor websites and APIs while also tracking the health of supporting infrastructure, applications, and cloud services from the same platform.
The additional visibility comes with more setup and ongoing administration than lightweight monitoring platforms. There are more dashboards, more configuration options, and a much larger monitoring footprint to manage.
Organizations looking for a balance between traditional uptime monitoring and full observability platforms such as Datadog or New Relic often find Site24x7 occupies a useful middle ground.
| Pros | Cons |
| Broader infrastructure monitoring coverage | More operational complexity than lightweight uptime tools |
| Strong cloud and server visibility | Pricing can scale with broader monitoring usage |
| Includes synthetic monitoring and RUM | Larger learning curve |
| Combines uptime and infrastructure monitoring in one platform | More setup than dedicated uptime monitoring tools |
| Strong fit for hybrid and cloud environments | Can feel heavier than necessary for simple uptime monitoring |
The best alternative enterprise observability platforms
Uptime monitoring only tells part of the story. Engineering teams running complex applications often need visibility into infrastructure, logs, traces, application performance, and cloud services alongside uptime data.
9. Datadog
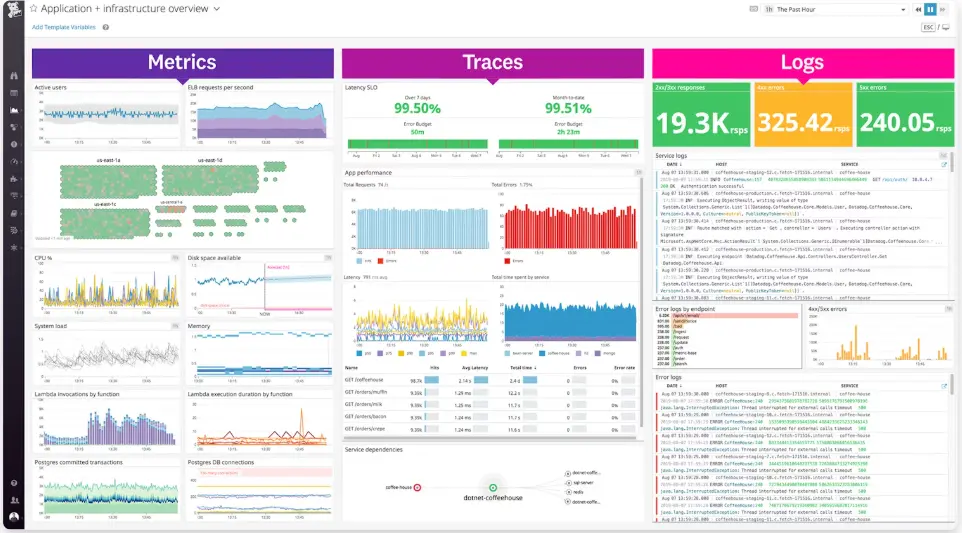
Source: Datadog dashboard example
Best for: Organizations running large cloud-native environments and distributed infrastructure at scale
Modern applications generate enormous amounts of operational data.
Datadog is designed to bring those signals together in a single platform, helping engineering teams investigate problems across entire environments rather than monitoring individual services in isolation.
The platform combines:
- Infrastructure and cloud visibility
- Application performance monitoring (APM)
- Distributed tracing
- Log management and analytics
- Synthetic monitoring and real user monitoring (RUM)
- Kubernetes and container monitoring
Organizations running microservices, Kubernetes deployments, multi-cloud environments, and large SaaS platforms often rely on Datadog because it provides context that traditional uptime monitoring tools cannot. Instead of simply showing whether a service is available, Datadog helps teams understand why performance is degrading, where bottlenecks originate, and how issues affect dependent systems.
Datadog requires considerably more investment than tools focused primarily on uptime monitoring. Pricing is usage-based, onboarding takes longer, and teams need a clear observability strategy to get the most value from the platform.
Organizations primarily looking for uptime checks, SSL monitoring, API monitoring, and incident alerts will usually find dedicated monitoring platforms easier to manage. Datadog shines when troubleshooting complex systems becomes just as important as detecting outages.
| Pros | Cons |
| Deep observability and infrastructure visibility | Expensive at scale |
| Excellent cloud-native integrations | Steeper learning curve |
| Strong APM and distributed tracing capabilities | More complexity than Pingdom |
| Broad monitoring and analytics ecosystem | Usage-based pricing can become difficult to predict |
| Strong fit for Kubernetes and microservices environments | Overkill for basic uptime monitoring |
10. New Relic
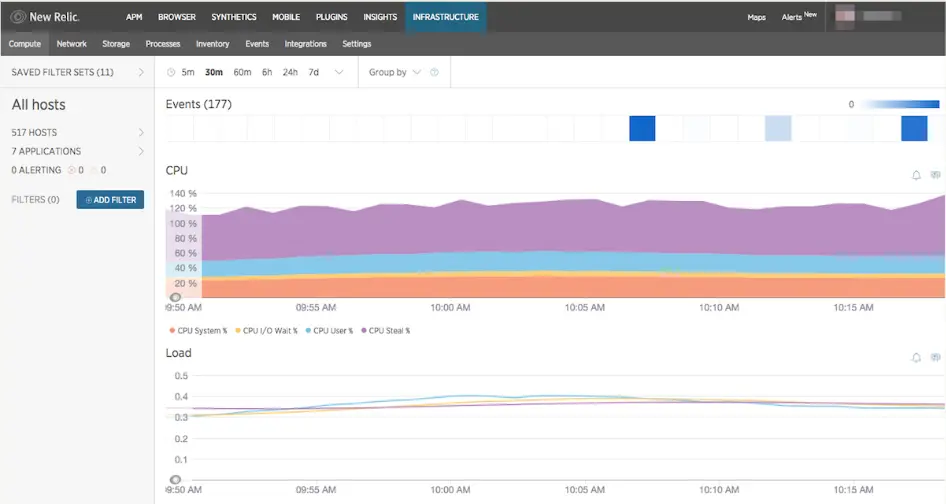
Source: New Relic dashboard example
Best for: Engineering teams focused on application performance, troubleshooting, and debugging
When users report that an application feels slow, the challenge is rarely determining whether the service is online. The real challenge is figuring out what is causing the slowdown and where to start investigating.
New Relic is built for that kind of analysis.
The platform includes:
- Application performance monitoring (APM)
- Distributed tracing
- Infrastructure monitoring
- Log management and analytics
- Cloud monitoring
- Real user monitoring (RUM)
- Telemetry and performance analytics
New Relic gives engineering teams visibility into how applications behave in production. Performance bottlenecks, slow database queries, service dependencies, infrastructure spikes, and application errors can all be traced back to their source through a single platform.
Although New Relic includes uptime monitoring and infrastructure visibility, its strongest capabilities sit closer to the application layer. Teams can move from an alert to the underlying code path, service dependency, query, or trace that contributed to the issue, making it a powerful troubleshooting tool as environments grow more complex.
Like most observability platforms, New Relic requires more configuration, training, and operational investment than dedicated uptime monitoring tools. Usage-based pricing can also become a consideration as telemetry volumes increase.
Organizations primarily looking for uptime checks, SSL monitoring, API monitoring, and external alerting often discover that a simpler monitoring platform meets their requirements more effectively. Engineering teams that spend significant time debugging applications, investigating incidents, and analyzing production performance, however, often find New Relic’s additional visibility worth the complexity.
| Pros | Cons |
| Strong developer-focused observability | Usage costs can scale quickly |
| Excellent application visibility | More complex than uptime-focused tools |
| Deep telemetry and tracing capabilities | Overkill for smaller monitoring environments |
| Strong cloud-native support | Requires more onboarding and configuration |
| Powerful troubleshooting and debugging workflows | Less focused on lightweight uptime monitoring |
Next steps
Pingdom remains a strong monitoring platform. The question is whether you still need everything it offers.
Many organizations discover that a simpler tool covers most of their day-to-day monitoring needs while reducing costs and administrative overhead.
If your priorities are reliable monitoring, fast alerting, status pages, and quick deployment, UptimeRobot is one of the easiest alternatives to switch to.
Start with the Free plan, monitor a few services, and compare the experience against your current workflow before committing to a larger migration.
-
The best Pingdom alternative depends on what you’re trying to monitor.
If your primary goal is uptime monitoring, services like UptimeRobot offer website, API, SSL certificate, DNS, domain, and cron job monitoring with straightforward pricing and fast setup.
Teams looking for full observability may also consider platforms like Datadog or New Relic, which combine monitoring with logs, traces, and infrastructure analytics. -
Many teams start looking for Pingdom alternatives when they need different pricing, additional monitoring capabilities, or a simpler user experience.
Some organizations want broader observability features, while others only need reliable uptime monitoring and prefer a more focused tool with less complexity. -
Yes. Pingdom remains a widely used monitoring platform and continues to provide uptime monitoring, synthetic monitoring, transaction monitoring, and performance insights. That said, monitoring requirements vary. Some teams find Pingdom meets their needs perfectly, while others prefer tools that offer different pricing models, deployment options, or feature sets.