Datadog built a genuinely powerful observability platform, and a lot of teams chose it when they needed fast coverage across infrastructure, APM, and logs. The problems that send teams looking elsewhere tend to cluster around two themes: cost that scales in ways that weren’t planned for, and use cases the platform wasn’t designed to serve well, particularly AI and LLM workloads.
This guide covers the main alternatives across three distinct categories: full-stack APM and infrastructure, ML and LLM observability, and high-scale log and metric management.
It also covers the case where a team doesn’t actually need Datadog’s breadth at all, just reliable external uptime monitoring, which is a different problem with a much simpler and cheaper solution.
Which alternative is right for you?
| Primary pain point with Datadog | Recommended alternative | Core focus |
| “We just need uptime monitoring, not full APM.” | UptimeRobot | External uptime checks, status pages, affordable at any scale |
| “It’s too expensive at scale.” | Chronosphere, Elastic | Downsampling, log management, predictable pricing |
| “We’re building AI/LLM apps.” | ZenML, LangSmith, Braintrust | AI evals, prompt tracing, MLOps |
| “We want open-source/self-hosted.” | Grafana, Elastic, Arize Phoenix | Full control, data privacy, no vendor lock-in |
| “We need better auto-discovery.” | Dynatrace, IBM Instana | Enterprise APM, AI-assisted root cause analysis |
Why look for a Datadog alternative in 2026?
There are two stand-out reasons team think about switching:
The cost factor
Datadog’s pricing is based on multiple usage metrics, including hosts, custom metrics, log ingestion, log retention, synthetic tests, and APM spans. As teams adopt more products, it’s common for costs to increase across several pricing dimensions at once.
High-cardinality custom metrics, which are common in Kubernetes and microservices environments, can become particularly expensive because Datadog charges per metric series rather than per data point.
Teams expanding AI workloads or large-scale data pipelines may also see observability costs grow rapidly as telemetry volume increases.
Usage-based pricing isn’t unique to Datadog, but combining per-host, per-metric, and per-GB pricing can make future costs harder to predict as infrastructure evolves.
The AI and ML observability gap
Datadog was built around infrastructure and application observability, making it well suited to monitoring CPU usage, memory consumption, latency, and distributed traces.
AI and ML workloads introduce different requirements. Teams often need visibility into prompt execution, token usage, evaluation results, model behavior, and dataset drift, which extend beyond traditional infrastructure telemetry.
Datadog has expanded its AI observability capabilities, but organizations building production LLM applications may find purpose-built platforms offer deeper insight into model development, testing, and evaluation.
Before you switch: do you need observability, or just external monitoring?
One pattern appears in many Datadog migrations. Teams start by looking for a cheaper replacement when what they really need is a narrower tool.
Datadog was built to observe what happens inside your applications and infrastructure. It collects telemetry from servers, containers, services, traces, and logs so engineers can investigate why something failed.
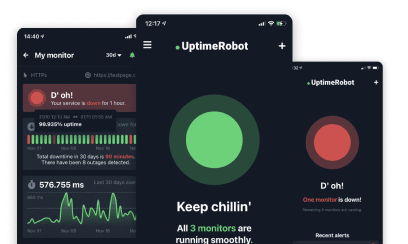
UptimeRobot on the other hand watches your services from the outside, checking whether websites, APIs, ports, and other public endpoints are actually available to users.
For many SaaS companies, agencies, and smaller engineering teams, that’s enough to detect incidents quickly without deploying agents or instrumenting applications.
If your stack doesn’t require distributed tracing, log analytics, or infrastructure monitoring, external monitoring is often simpler to manage and far less expensive.
Plans include:
- Free: 50 monitors, 5-minute checks
- Solo: $9/month billed annually, 60-second checks
- Team: $33/month billed annually
- Enterprise: From $69/month billed annually, 30-second checks
| Monitoring type | What it does |
| Website monitoring | Checks whether a website or endpoint is reachable over HTTP or HTTPS. |
| Keyword monitoring | Verifies that expected content appears on a page to catch issues beyond simple uptime. |
| SSL certificate error monitoring | Detects SSL/TLS configuration and validation errors that can prevent secure connections. |
| SSL certificate expiry monitoring | Alerts you before an SSL certificate expires. |
| Domain expiry monitoring | Warns you before a monitored domain registration expires. |
| API monitoring | Monitors API endpoints for availability and expected responses. |
| Ping monitoring | Confirms that a server or device responds to ICMP ping requests. |
| Port monitoring | Verifies that a specific TCP port is open and accepting connections. |
| DNS monitoring | Detects changes to DNS records and helps identify configuration issues or unauthorized modifications. |
| Heartbeat (cron job) monitoring | Confirms that scheduled jobs or background tasks run on time by expecting periodic heartbeats. |
| UDP monitoring | Checks the availability of UDP-based services and applications. |
In addition to monitoring, UptimeRobot includes public status pages, multi-channel alerts, incident management, and integrations with Slack, Microsoft Teams, PagerDuty, Telegram, webhooks, and many other services.
If external availability is your primary concern, UptimeRobot may be all you need. If you also need deep infrastructure visibility, traces, logs, or RUM, the alternatives below are a better fit.
Alternatives for full-stack APM and infrastructure
Full stack observability platforms bring together application performance monitoring, infrastructure monitoring, distributed tracing, logs, and alerting. They’re best suited for organizations that want a unified view of their production environment instead of separate tools for each monitoring task.
1. Dynatrace
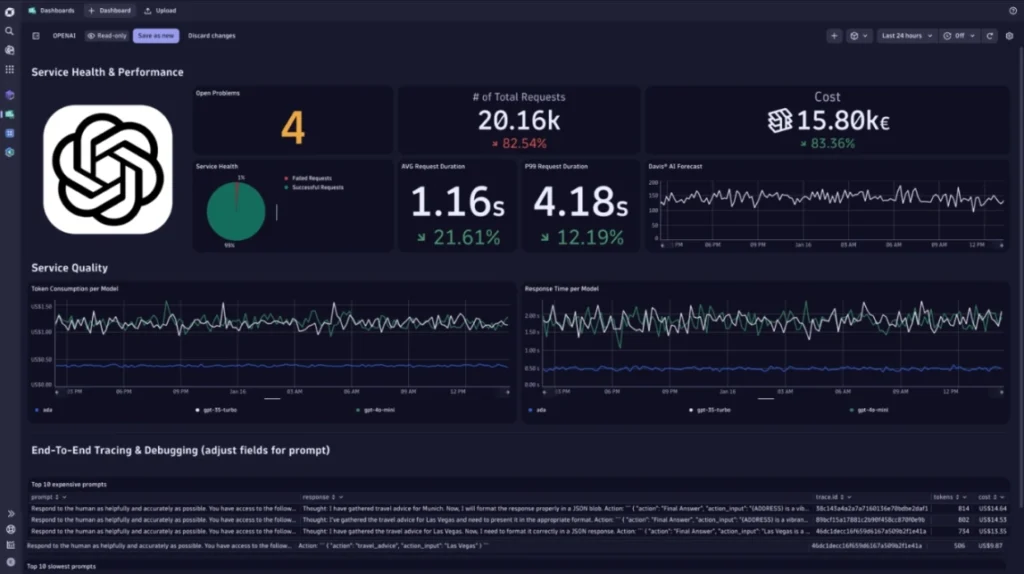
Source: Dynatrace dashboard example
Best for: Large enterprises that want automatic full-stack discovery and AI-driven root cause analysis with minimal manual instrumentation.
Dynatrace’s Davis AI engine automatically maps every component of an application stack from the browser to the host and database, without requiring manual service discovery or configuration.
Its OneAgent deploys in minutes and starts building a dependency map immediately. When a performance degradation occurs, Davis traces the root cause through dozens of microservices and surfaces a probable cause rather than leaving the engineer to correlate dashboards manually.
Pricing is consumption-based and starts around $58/month for full-stack monitoring, scaling with host units and data volume. A 15-day trial is available. Dynatrace is built for organizations with mature DevOps teams and complex cloud environments; the cost and implementation complexity reflect that scope.
| Pros | Cons |
| Davis AI pinpoints root cause across microservices automatically | Expensive, especially at enterprise scale |
| Zero-configuration auto-discovery via OneAgent | 15-day trial is short for complex evaluations |
| Strong Kubernetes and container monitoring | Overkill for smaller or simpler environments |
| Unified platform covering APM, infrastructure, and RUM | Proprietary agent creates some lock-in |
2. New Relic
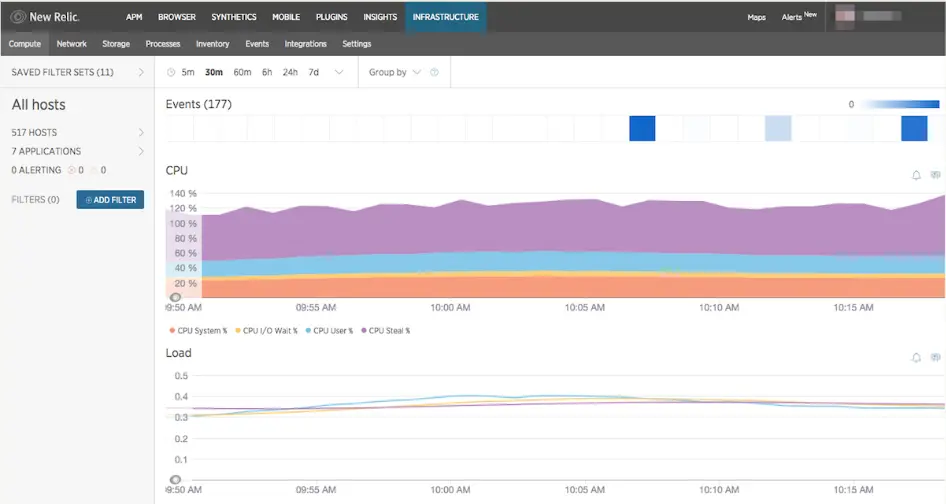
Source: New Relic dashboard example
Best for: Developer-led teams that want full-stack APM and observability with a genuinely usable free tier and strong OpenTelemetry support.
New Relic’s free tier is the most generous in this category with 100GB of data ingested per month and one full-platform user at no cost, covering APM, browser monitoring, infrastructure, logs, and synthetic checks in the same account.
NRQL (New Relic Query Language) gives teams a consistent way to query across all telemetry types, which reduces context-switching when debugging.
New Relic has also invested heavily in OpenTelemetry support, making it a reasonable choice for teams that want vendor-neutral instrumentation but prefer a managed backend over self-hosting.
Paid plans use a consumption-based pricing model based on data ingest and user licensing (or compute usage for eligible plans). Enterprise pricing is available on request. Overages can add up at high data volumes, so teams with significant telemetry should model the cost before committing.
| Pros | Cons |
| 100GB/month free tier, 1 full user included | Per-user pricing makes team scaling expensive |
| NRQL provides a unified query interface across all telemetry | Data costs can be hard to predict at high volume |
| Strong OpenTelemetry support, avoids proprietary lock-in | Feature breadth can overwhelm teams new to APM |
| Distributed tracing connects frontend issues to backend queries | Some advanced features require paid tiers |
3. Grafana (with Loki and Tempo)
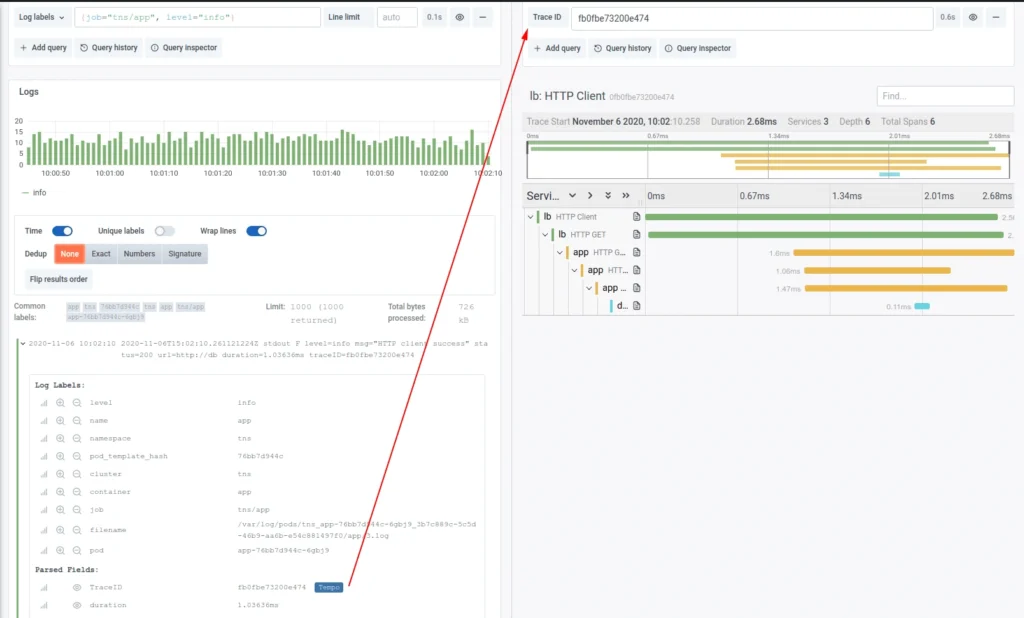
Source: Trace discovery example in Grafana Tempo
Best for: Teams that want a highly customizable, open-source visualization and observability layer without committing to a single vendor’s data model.
Grafana is an open source observability platform that visualizes data from a wide range of sources. Teams often pair it with Prometheus for metrics, Loki for logs, and Tempo for traces to build a complete monitoring stack.
Because Grafana connects to many different backends, organizations can keep the tools they already use instead of moving everything into a single platform.
Grafana is free to self host. Teams that prefer a managed service can use Grafana Cloud, which includes a free plan with 10,000 active series, 50 GB of logs, and 50 GB of traces each month.
The flexibility comes with additional setup and maintenance. Running Prometheus, Loki, and Tempo together means configuring multiple components, managing storage and retention, and maintaining the underlying infrastructure.
For teams that want a simpler deployment, a managed monitoring platform may require less day to day administration.
| Pros | Cons |
| Works with virtually any data source, minimal vendor lock-in | Configuration and maintenance require dedicated ops expertise |
| Open-source core, Grafana Cloud managed option available | No native auto-discovery or APM agent |
| Highly flexible dashboards and alerting | Requires separate components (Loki, Tempo, Prometheus) for full coverage |
| Large community, extensive plugin ecosystem | Debugging across disconnected backends adds complexity |
4. SolarWinds Observability
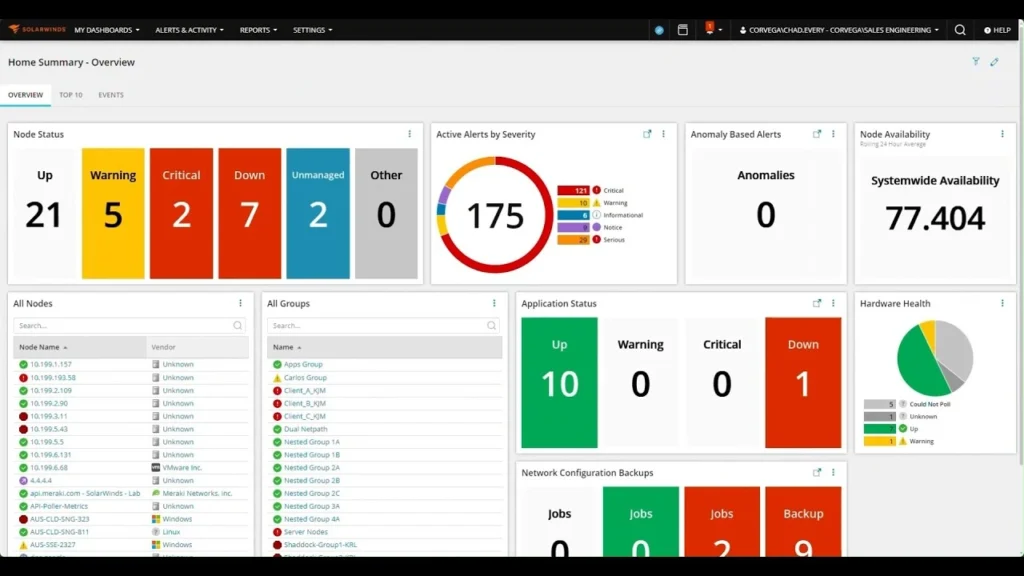
Source: SolarWinds Observability self-hosted version dashboard
Best for: Hybrid operations teams that need to bridge legacy on-premise infrastructure and cloud-native services in one monitoring platform.
SolarWinds Observability (previously SolarWinds APM, incorporating the AppOptics acquisition) is for environments where not everything is in the cloud, and not everything can be migrated soon.
It covers network performance, server and infrastructure monitoring, cloud monitoring, and application traces in one platform, with on-premise deployment options for environments where data can’t leave the building. It’s the monitoring equivalent of meeting the customer where they are rather than where they should theoretically be.
Pricing is custom and typically negotiated for enterprise accounts. SolarWinds has faced reputational headwinds since the 2020 supply chain attack, which is worth factoring into vendor evaluation for security-sensitive environments.
| Pros | Cons |
| Strong hybrid and on-premise coverage alongside cloud | Reputation affected by the 2020 Sunburst supply chain incident |
| Unified platform for network, server, and application monitoring | Custom pricing, no self-serve tiers |
| Deep support for legacy infrastructure types | Less developer-friendly than modern APM tools |
| On-premise deployment for data-sensitive environments | Interface feels dated compared to cloud-native competitors |
Alternatives for ML and LLM observability
This category is distinct from traditional APM. The observability needs of teams building LLM applications, AI agents, and ML pipelines don’t map well onto trace-span models built for microservices.
What matters here is prompt tracing, token usage, evaluation runs, model drift, and dataset quality, not CPU utilization and request latency in the traditional sense.
5. ZenML
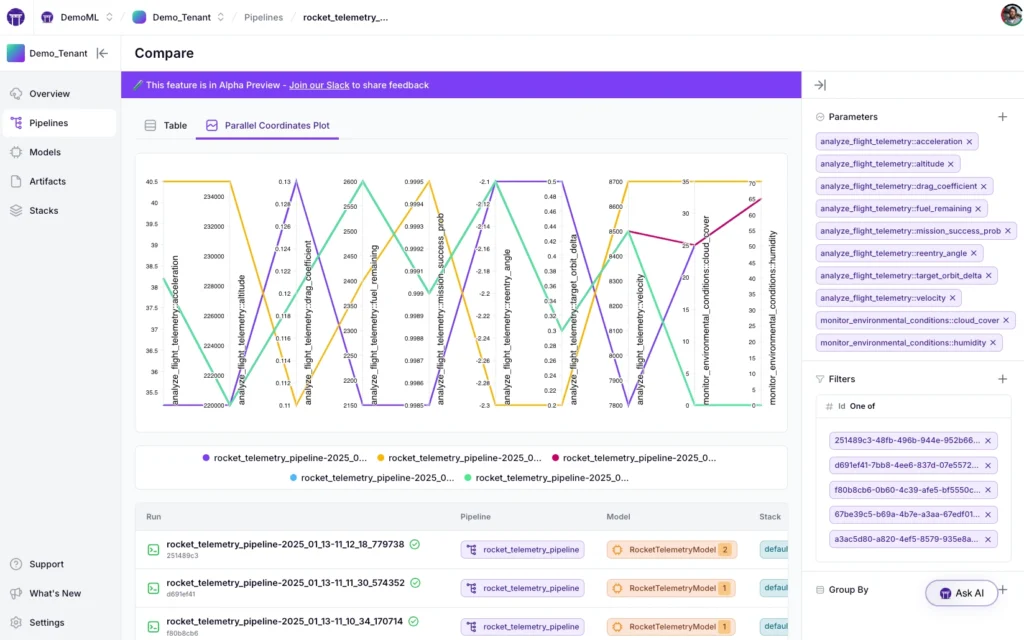
Source: ZenML dashboard example
Best for: ML engineering teams that need end-to-end pipeline orchestration, experiment tracking, and model versioning in one framework.
ZenML is an open-source MLOps framework that standardizes how ML pipelines are built, tracked, and deployed. It integrates with existing MLOps tools (Kubeflow, MLflow, Weights and Biases) as backends rather than replacing them, which means teams can adopt it incrementally without rebuilding their stack.
Its stack abstraction lets teams switch between local development and cloud production without changing pipeline code. ZenML Cloud is the managed offering for teams that don’t want to run the orchestration infrastructure themselves.
| Pros | Cons |
| Framework-agnostic, integrates with existing MLOps tools | More focused on pipeline orchestration than LLM-specific observability |
| Open-source core with active community | Learning curve for teams new to MLOps abstractions |
| Consistent pipeline code across local and cloud environments | Cloud-hosted version required for managed scaling |
| Good experiment tracking and artifact versioning | LLM evaluation features less mature than Braintrust or LangSmith |
6. LangSmith
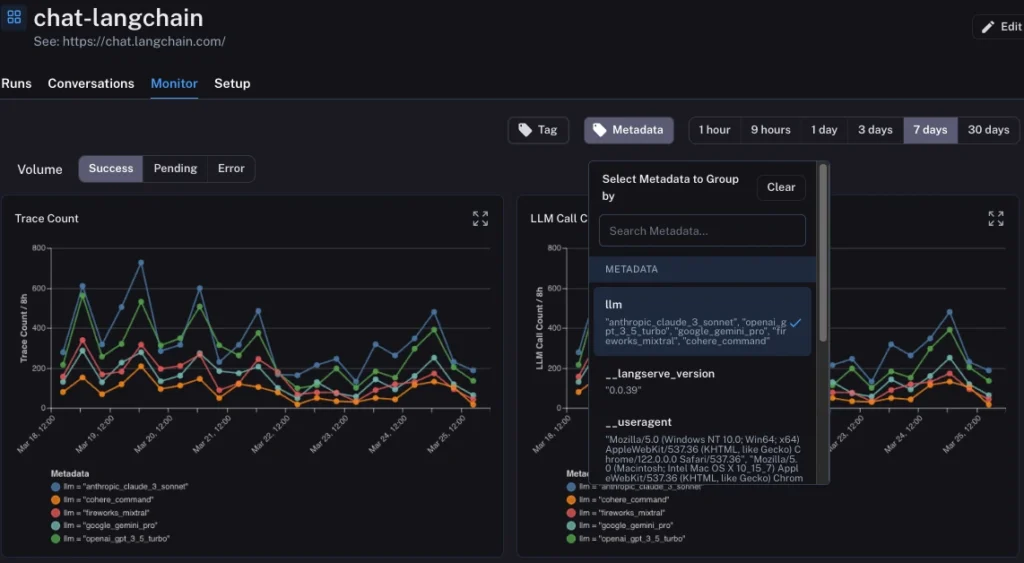
Source: LangSmith dashboard example
Best for: Teams building LLM applications that need detailed tracing, debugging, and evaluation tools.
LangSmith is LangChain’s observability platform for AI applications. It traces every step of an LLM workflow, capturing inputs, outputs, token usage, latency, and execution details to help teams understand how chains and agents behave.
For teams investigating why an agent produced an unexpected response or followed the wrong path, LangSmith makes it easy to inspect each step of the execution. It also includes prompt versioning, datasets, and automated evaluations for comparing prompt variations and measuring application quality over time.
LangSmith integrates natively with LangChain and LangGraph but also supports other LLM frameworks through its tracing SDKs. Unlike Datadog, which monitors infrastructure and applications, LangSmith focuses specifically on observability for AI and LLM workflows.
The Developer plan is free. The Plus plan starts at $39 per seat per month, while Enterprise pricing is available on request.
| Pros | Cons |
| Deep step-by-step trace visibility for chains and agents | Strongest when used with LangChain; more setup needed for other frameworks |
| Prompt versioning and automated evaluation runs | Not a general-purpose APM tool |
| Free developer plan with generous limits | Dataset and evaluation features still maturing |
| Built by the LangChain team, tightly integrated | Ecosystem overlap with LangChain creates some lock-in |
7. Braintrust
Source: BrainTrust dashboard examples
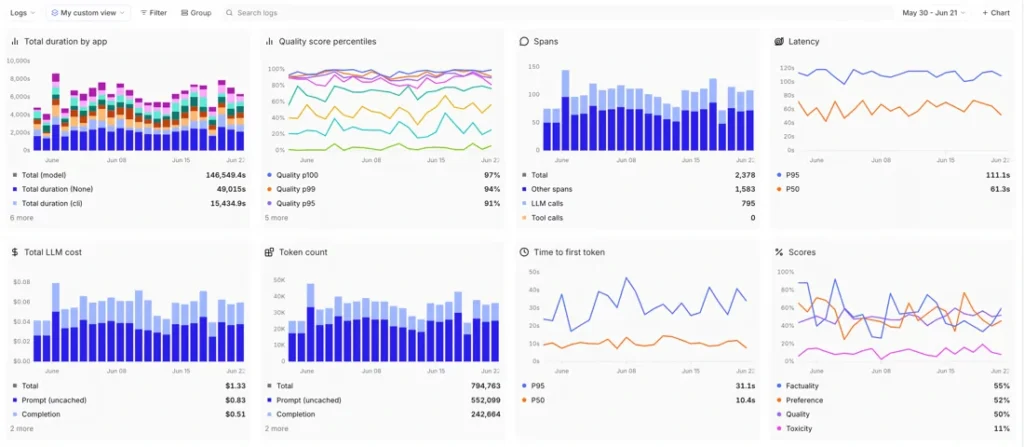
Best for: AI product teams that need automated LLM evaluation, prompt versioning, and quality control across model releases.
Braintrust is an evaluation platform for LLM applications: it lets teams define test datasets, run prompts through multiple model versions, score outputs against criteria, and track quality trends over time.
The core value is catching quality regressions before they reach production, the AI equivalent of a test suite for model outputs. It supports both human and automated scoring, and its prompt playground makes it easy to iterate on prompt versions with side-by-side comparison.
Braintrust is framework-agnostic and works with any LLM provider. It offers a free tier for individuals and small teams, with paid plans for higher usage and team features.
| Pros | Cons |
| Strong automated evaluation and prompt versioning workflow | Less focused on production trace debugging than LangSmith |
| Framework and model agnostic | Evaluation infrastructure requires upfront dataset curation |
| Human and automated scoring in the same platform | Smaller community than LangChain ecosystem tools |
| Good for tracking quality trends across model releases | Enterprise features require custom pricing |
8. Arize Phoenix
Source: Arize Phoenix metrics dashboard example
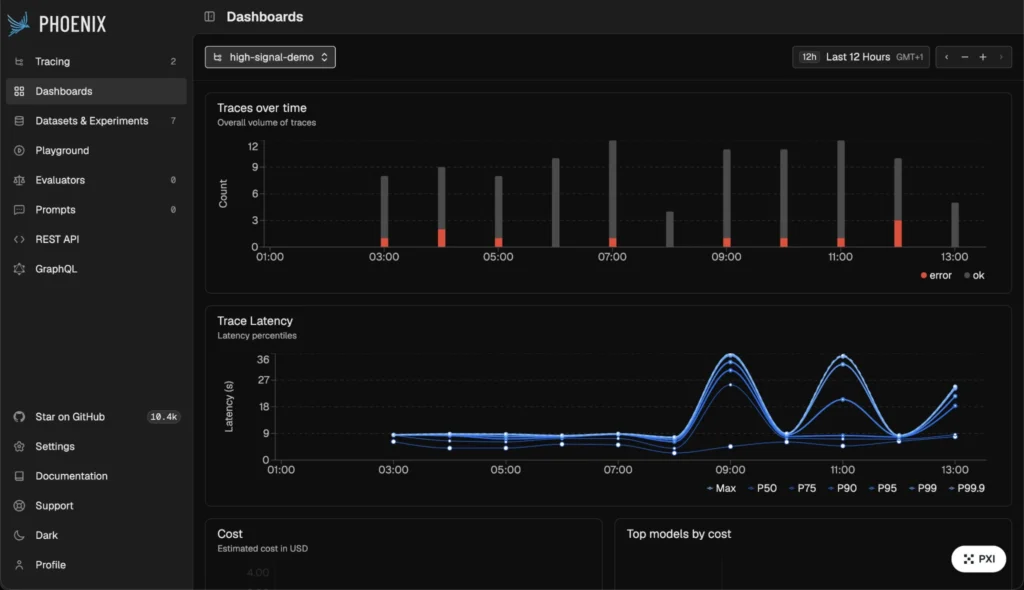
Best for: Teams that want open-source, local-first LLM tracing and drift detection without sending data to a third-party platform.
Arize Phoenix is an open-source observability tool for LLM applications that runs locally or in your own infrastructure.It supports OpenTelemetry based tracing, capturing LLM spans from any framework that emits OTel traces while adding LLM specific analysis such as embedding visualization, dataset drift detection, hallucination scoring, and retrieval quality metrics for RAG pipelines.
For teams with data privacy requirements that prevent sending production LLM inputs and outputs to a SaaS platform, Phoenix is the most capable self-hosted option.
| Pros | Cons |
| Open-source and local-first, data stays on your infrastructure | Requires hosting and maintenance |
| OpenTelemetry-based, framework-agnostic tracing | Smaller community than commercial alternatives |
| Strong RAG pipeline analysis and embedding visualization | UI less polished than commercial LLM observability tools |
| Drift detection and hallucination scoring built in | No managed cloud option |
Alternatives for high-scale log and metric management
At large scale, the challenge shifts from collecting telemetry to managing it efficiently. These platforms specialize in high-volume log and metric ingestion, long-term retention, and fast querying across distributed environments.
9. Chronosphere
Source: Chronosphere dashboard example
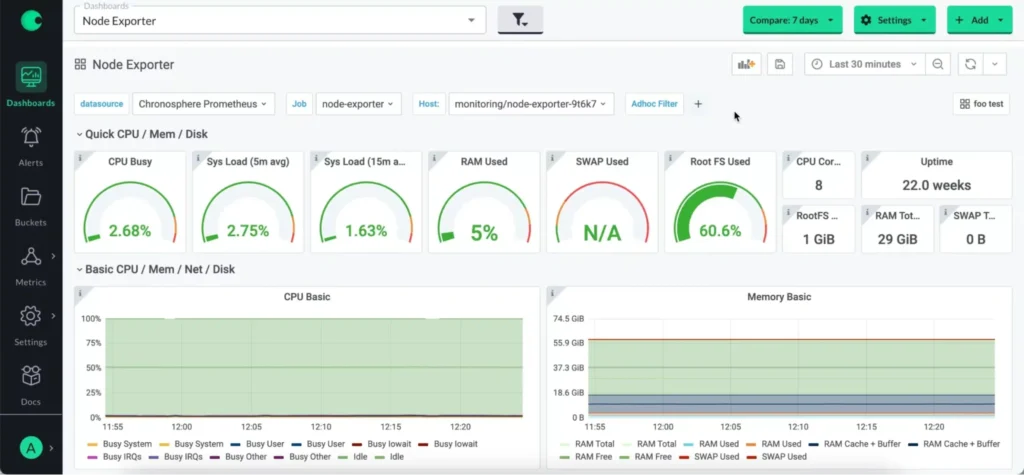
Best for: Large organizations that need to manage high volumes of metrics, logs, and traces while keeping observability costs under control.
Chronosphere is a cloud native observability platform built for large scale environments. It supports metrics, logs, traces, and events using open standards such as Prometheus and OpenTelemetry, making it a good fit for organizations that want to avoid proprietary telemetry formats.
One of Chronosphere’s biggest differentiators is its Control Plane, which lets teams analyze, filter, and shape telemetry data before it is stored. This cuts down on storage costs and improves query performance without requiring every metric or log to be retained. The platform also includes dashboards, alerting, and troubleshooting tools for investigating incidents across distributed systems.
Chronosphere is for organizations dealing with very large telemetry volumes rather than small teams looking for a simple monitoring platform. Pricing is available on request.
| Pros | Cons |
| Purpose-built for controlling high-cardinality metric costs | Enterprise pricing, not suited for smaller teams |
| Downsampling and aggregation policies at the metric level | Complex initial configuration for policy design |
| Predictable cost model compared to per-metric Datadog pricing | Narrower scope than full-stack APM platforms |
| Strong Kubernetes and cloud-native metric support | Smaller ecosystem and community than Prometheus or Datadog |
10. Elastic (ELK Stack)
Source: Elastic dashboard example
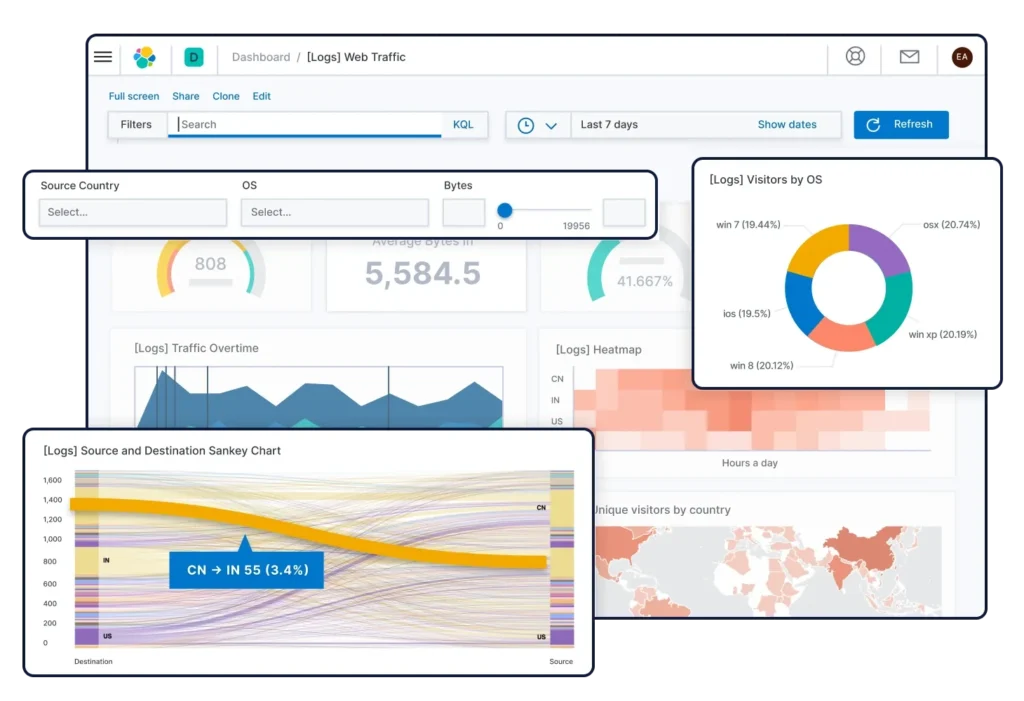
Best for: Teams that need powerful search, large scale log management, and a mature platform they can self host or run as a managed service.
Elasticsearch, Logstash, and Kibana make up one of the most widely used platforms for log management and search. Elastic’s biggest strength is fast, full text search across large volumes of data, making it easy to investigate incidents by searching for specific errors, events, or patterns across distributed systems.
Elastic Observability extends the platform with application performance monitoring, infrastructure monitoring, log analytics, synthetic monitoring, and OpenTelemetry support. Organizations can deploy the stack themselves or use Elastic Cloud, which offers fully managed hosted and serverless deployments.
One consideration is licensing. Elasticsearch and Kibana no longer use the Apache 2.0 license. Since 2024, portions of the source code have been available under AGPLv3 alongside the Elastic License and SSPL, while the default distribution continues to use the Elastic License. Some organizations still choose OpenSearch instead, depending on their licensing requirements.
| Pros | Cons |
| Best-in-class full-text log search at scale | Self-hosting requires significant ops investment |
| Open-source core with mature, large community | SSPL license change (2021) affects some use cases |
| OpenTelemetry support across logs, metrics, and traces | Resource-intensive: Elasticsearch requires substantial memory |
| Elastic Cloud managed option removes hosting overhead | Managed pricing can rival Datadog at high volume |
Key features to look for in your next observability stack
Different platforms solve different observability challenges, but there are a few capabilities worth looking for regardless of your requirements. The features below can make it easier to control costs, avoid vendor lock-in, and choose a platform that fits your environment.
Predictable pricing
One of the biggest reasons teams leave Datadog is rising costs. Look for pricing that’s easy to understand and scales predictably as your infrastructure grows. Usage-based pricing can work well, but make sure you know how adding hosts, metrics, or telemetry will affect your monthly bill.
OpenTelemetry support
OpenTelemetry has become the standard for collecting metrics, logs, and traces. Choosing a platform with strong OTel support makes it easier to switch backends in the future without re-instrumenting your applications.
The right fit for your use case
Observability platforms can solve different problems. Some focus on full stack application monitoring, while others specialize in AI workloads, large scale log analytics, or external uptime monitoring. Start by identifying your biggest challenge, then compare the tools built for that use case.
Conclusion
Datadog remains one of the most capable observability platforms available, but it isn’t the right fit for every organization. Cost, complexity, and changing monitoring requirements often lead teams to look elsewhere.
The best alternative depends on what you’re trying to solve. Dynatrace and New Relic are strong choices for full stack observability, Grafana and Elastic offer flexible open source ecosystems, Chronosphere is built for high volume telemetry, and LangSmith and Braintrust focus on AI application observability. If your priority is external uptime and API monitoring rather than full APM, UptimeRobot provides a simpler and more affordable approach.
Evaluate the platforms that match your requirements, run a proof of concept where possible, and compare them against the workloads that matter most to your team before making the switch.
-
It depends on your priorities. UptimeRobot is a good choice for straightforward uptime monitoring, while Grafana, Elastic, and Prometheus-based platforms offer greater flexibility for teams willing to manage more of their own observability stack. Teams looking for full-stack APM often compare Dynatrace and New Relic.
-
Start by identifying the capabilities you need, such as infrastructure monitoring, logs, metrics, traces, APM, synthetic monitoring, or AI observability. Then compare pricing, OpenTelemetry support, deployment options, integrations, scalability, and ease of use to find the platform that best matches your environment.