Update: If you prefer watch our video on this topic:
Somewhere between monitor 200 and monitor 500, uptime monitoring stops being a tool one person configured and becomes a system your organization depends on. The checks themselves do not change. Everything around them does.
Teams running 5,000 or 10,000 monitors don’t simply scale up the same processes. They’re doing different things like naming conventions instead of memory, routing rules instead of a shared inbox, ownership records instead of “ask Dave.”
We’ll go over what actually changes when you get into large scale monitoring with insights drawn from patterns we see in accounts of that size.
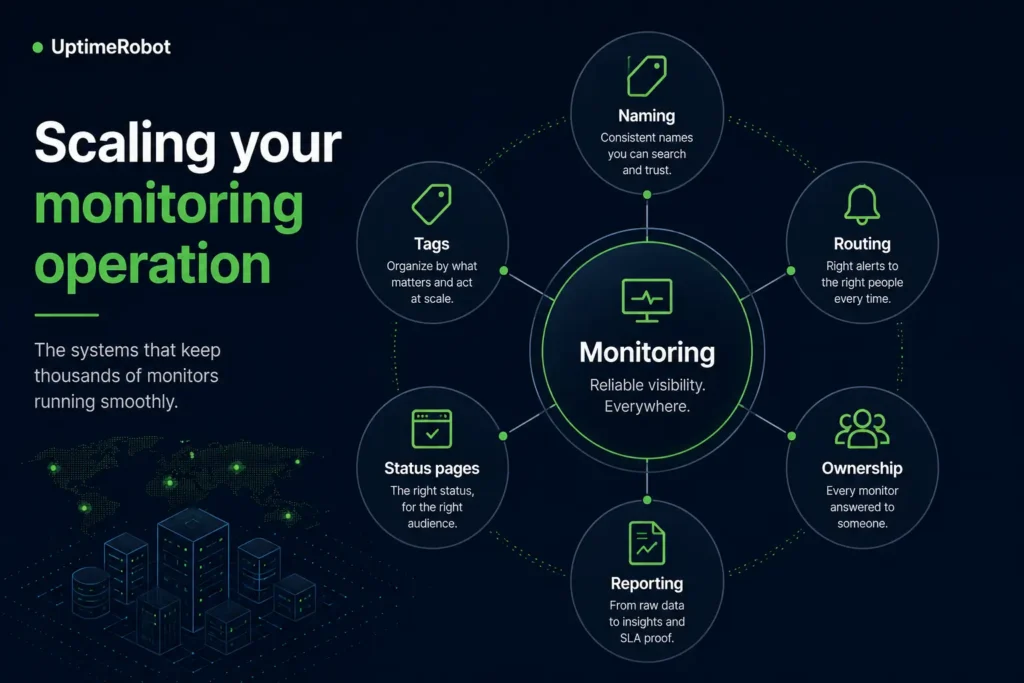
Naming: make monitors easy to search
With 30 monitors, you scan the list. With 3,000, you query it. That only works if names are consistent and machine-sortable.
Pick a convention and enforce it at creation time. A pattern like client-environment-service-checktype (for example acme-prod-checkout-keyword) means anyone can find anything, filters work predictably, and API scripts can parse monitor names reliably.
The convention matters less than its consistency. Retroactively renaming 3,000 monitors is a project, but naming them right on day one is free.
Tags: decide the taxonomy before you need it
Tags are how you divide the fleet into manageable slices, and can be by client, environment, service, team, or criticality. At scale they drive everything downstream, including dashboard filters, bulk actions, status page composition, and reporting.
Two rules keep a taxonomy healthy. Tag along lines you will filter and report by, not lines that merely describe. Be sure to keep the criticality tag as mandatory, because it’s the one alert routing and escalation depend on.
Bulk actions let you edit, pause, or re-tag hundreds of monitors at once, but only if the tags exist to select them.
Alert routing: from “notify everyone” to a routing policy
Under 50 monitors, everyone can hear about everything. Past 500, that produces hundreds of notifications a week and trains the team to ignore them, which is how real incidents get missed.
The fix is a written routing standard tied to your criticality tags. Production-critical monitors page an on-call rotation through PagerDuty or SMS and voice. Important monitors notify the owning team’s Slack or Teams channel plus direct email.
Everything else lands in a low-noise channel nobody is expected to watch in real time. UptimeRobot attaches alert contacts per monitor, so the standard is enforceable at creation time.
Ownership: every monitor answers to someone
At 5,000 monitors, “who owns this monitor?” becomes a daily question. Unowned monitors are the ones that alert into the void, stay paused after maintenance, and page people who changed teams two reorgs ago.
Make ownership explicit by assigning a team tag to every monitor, holding admin access through roles rather than individuals, maintaining more than one admin at all times, and including alert contact cleanup in your offboarding process.
The account itself should belong to the organization, using a shared or role-based identity so no single departure strands it.
Escalation: assume the first alert is missed
For smaller teams, an alert often goes straight to the person responsible. At enterprise scale, alerts usually pass through an escalation process with defined ownership and backup contacts.
Someone must acknowledge, someone must escalate if they don’t, and the path must survive vacations and time zones.
In practice this means pairing UptimeRobot with an on-call layer for the critical tier, using multi-channel redundancy (push plus email plus SMS or voice) for direct notifications, and reviewing the escalation path quarterly.
The alert that fires perfectly and reaches nobody is indistinguishable from no monitoring at all.
Status pages: one becomes many
At scale, a single status page stops fitting. Agencies need per-client pages, each driven by that client’s tags and branded on the client’s domain. Platform teams need a public page for customers and private pages for internal services. Support teams need one link to share instead of a thousand explanations.
Because status pages are composed from monitors you select, a clean tag taxonomy makes new pages a few minutes’ work. Custom domains need a CNAME and SSL issuance, so set them up before the client asks, not during an incident.
Reporting: from screenshots to pipelines
As your monitoring environment grows, reporting becomes part of the process. Teams may need to provide monthly uptime reports to clients, SLA metrics to procurement, or incident history for audits and compliance reviews. Screenshots are no longer enough.
Choose a reporting workflow that fits your needs. Use scheduled email reports for routine client updates, the API for programmatic exports into your own reporting stack, and the dashboard for ad hoc questions.
Check your plan’s data retention window against your longest reporting obligation, because an annual SLA review needs twelve months of history available when asked.
Pricing predictability: know your growth axis
Enterprise monitoring budgets usually run into one of two problems. Costs rise faster than expected as the number of monitors grows, or organizations pay for capacity they never use. Both are easier to avoid when you understand what drives your costs.
Monitor count usually grows about twice as fast as site count, because thorough coverage means keyword, DNS, domain expiry, and heartbeat checks per property (SSL expiry alerts come included with HTTPS monitoring, so they add coverage without adding slots). Seats grow with the team, and SMS or voice credits grow with your critical tier. Once you know which of these drives your growth, forecasting is arithmetic.
For fleets heading past 1,000 monitors, the enterprise plan is priced for exactly this range (the sizing conversation starts at 1,000 and runs past 25,000 monitors), with 15-second checks and volume terms that beat stacking smaller plans. Institutional buyers can also handle billing through annual invoicing and wire transfer rather than a card.
Scaling checklist
If your monitoring environment is growing past a few hundred monitors, use this checklist to verify that the operational foundations are in place before scale becomes a problem.
- Adopt a consistent naming convention for every monitor.
- Define a mandatory tag taxonomy (for example environment, criticality, owner, or client).
- Document alert routing rules for each criticality level.
- Assign an owning team and maintain at least two account admins.
- Test your escalation path regularly and review it after organizational changes.
- Organize status pages around clients, services, or audiences instead of using a single page.
- Choose a reporting workflow (dashboard, scheduled reports, or API exports) that matches your operational needs.
- Review your pricing model regularly and forecast monitor growth before you outgrow your current plan.
The earlier these standards are documented, the easier it becomes to scale from hundreds of monitors to thousands without spending months cleaning up inconsistent naming, ownership, or alerting.
Planning a large-scale deployment?
If you’re designing a monitoring environment for thousands of checks, the architecture matters just as much as the monitors themselves.
An enterprise demo can help you review monitor organization, tagging strategy, alert routing, reporting workflows, and enterprise deployment options before your environment becomes difficult to manage.
-
The pain typically starts between 200 and 500 monitors, which is exactly when fixing it is still cheap. If you are at 200 and growing, adopt the conventions now rather than retrofitting them at 2,000.
-
Yes. Enterprise accounts run from 1,000 to beyond 25,000 monitors, with 15-second check intervals, bulk management, tags, per-monitor alert routing, and API access designed for fleets of that size.
-
Use a small set of mandatory tags for your environment, criticality, and owning team or client. Add optional tags only when you have a specific filtering or reporting need. A small, consistently applied taxonomy is more useful than a large one that nobody maintains.
-
Route by criticality tag, not by default. Only the production-critical tier should page anyone; the rest goes to channels for visibility. Multi-location verification already suppresses single-region blips before an alert fires.
-
Identify the factors that will drive your monitoring costs. Monitor count, seats, and SMS or voice credits all contribute to pricing, with monitor count typically growing the fastest. Plan for the tier you’ll need in six months, and move to enterprise pricing once your deployment grows beyond 1,000 monitors.
-
The organization, not a person. Use role-based ownership, keep at least two admins, tie alert contacts to teams and rotations, and make contact cleanup part of offboarding.